This post goes out as an email to our subscribers every day and is posted for free here around 2 PM ET. To get your real-time copy, sign up for the free or premium version here: Opening Print Subscribe.
Follow @MrTopStep on Twitter and please share if you find our work valuable!

I want to talk about the volume in the S&P futures and why it has fallen off a cliff. It picked up a little yesterday, but I think the bottom line is “Joe Public” isn’t day trading the S&P futures. It used to be the hottest game in town, but over the years, it has been replaced by exploding options and ETF volumes.
A big part of this total volume has dropped considerably; at its all-time high during the credit crisis, the ES volume jumped to a record of 6.6 million contracts. I remember being at my desk on the floor, and over two weeks, I wrote the volume on a trading card, and it went from 3.5 million to 4 million to 4.5 million to 5 million to 5.25 million, up to 5.75 million to 6.4 million, up to 6.69 million.
While the exact daily total may be off, I remember very clearly saying the ES would never see volume like that again, and while I don’t know what the highest it’s been since then, I don’t think it’s reached 5 million, and I can’t recall many, if any, 4.5 million contract days. Last Monday, it was 1.15 million, and on 4/27, it was 1.085 million. The daily average over the last 8 sessions is 1.379 million.
If you take the 1.379 million average and subtract the average daily Globex volume of 225k, that equals 1.154 million. Then you take out 70% for algorithmic and HFT, which is 808k; that leaves 346k contracts for the day session from 9:30 AM ET to 4:00 PM ET.
I know a lot of traders don’t think about this, but the retail trader funding program that uses a simulator has added to the decline of the S&P futures volume. While these firms do not publicize their sim volume, I don’t think it’s far-fetched to say that it’s 3 to 5 million a day or higher on larger CME volume days. APEX alone has over 90,000 people online every day, and some of the other firms range from 40k users to 70k users.
Now, not all these sim traders are trading the ES; they trade gold, bonds, currencies, and crude oil, but that said, a good portion of the CME’s volume is missing due to these companies, and I’m sure the CME, which never really paid attention to it, is now.
I want to be clear, I do not have the exact numbers; I could be over- or underestimating the volume figure, but one thing is for sure: real CME futures volume is being affected.

The numbers speak for themselves; the markets have exploded higher, and there seems to be no letup. When I talked to the PitBull last night, he said he has never seen anything like this. Since bottoming on March 30, the U.S. stock market has added approximately $7.3 trillion in total market capitalization, and the “Magnificent 7” stocks alone have accounted for roughly $4 trillion of that recovery, representing over 50% of the total market gain in just over five weeks, while non-AI sectors like enterprise software, consumer discretionary, and financials are currently lagging
How long can the markets keep going up without a real drop? I don’t know, but I do wonder if Trump really has a deal and what happens if he doesn’t? It’s 10:20 p.m., and the ES is down 0.50 points.
Our lean: My guess is we still see higher prices, but I think the next 100 to 150 points could get tricky. 7500–7550 is where I think we could see a top. I can’t rule out a pullback/selloff, but I still think they will get bought. On the month, the ES is up 11.11%, and over the last 3 months, it’s up 16.33%.
ES Market Profile Technical Map — Settlement: 7,389.50
Market Profile Value Structure
Value Area High (VAH)
7,445.00 | Upper Fair Value Boundary
Point of Control (POC)
7,389.50 | Highest Volume / Price Magnet
Value Area Low (VAL)
7,345.00 | Lower Fair Value Boundary
Full Value Area — 70% Fair Value Zone
7,345.00 → 7,445.00
Claude AI ES Support & Resistance Map
Upper Resistance Distribution
7,475.00 | Extreme Extension | LVN
7,460.00 | Major Breakout Zone | RES
7,445.00 | Value Area High (VAH) | RES
7,430.00 | High-Volume Node (HVN) | RES
7,420.00 | Minor Resistance | RES
7,400.00 | Psychological Pivot | ROUND
Core Market Profile Zone
7,445.00 | VAH
7,430.00 | Upper Value Rotation
7,400.00 | Mid-Value Pivot
7,389.50 | Point of Control (POC)
7,375.00 | Lower Value Rotation
7,345.00 | Value Area Low (VAL)
Lower Support Distribution
7,375.00 | First Support | SUP
7,360.00 | High-Volume Support | HVN
7,345.00 | Value Area Low (VAL) | SUP
7,330.00 | Major Support Zone | SUP
7,315.00 | Low-Volume Node (LVN) | FAST MOVE
7,300.00 | Psychological Support | ROUND
7,275.00 | Extreme Support | SUP
ES is balanced around the 7,389.50 POC within the 7,345–7,445 value area. Acceptance above VAH favors expansion toward 7,460–7,475, while rejection below VAL opens the door to the 7,330–7,300 support distribution.


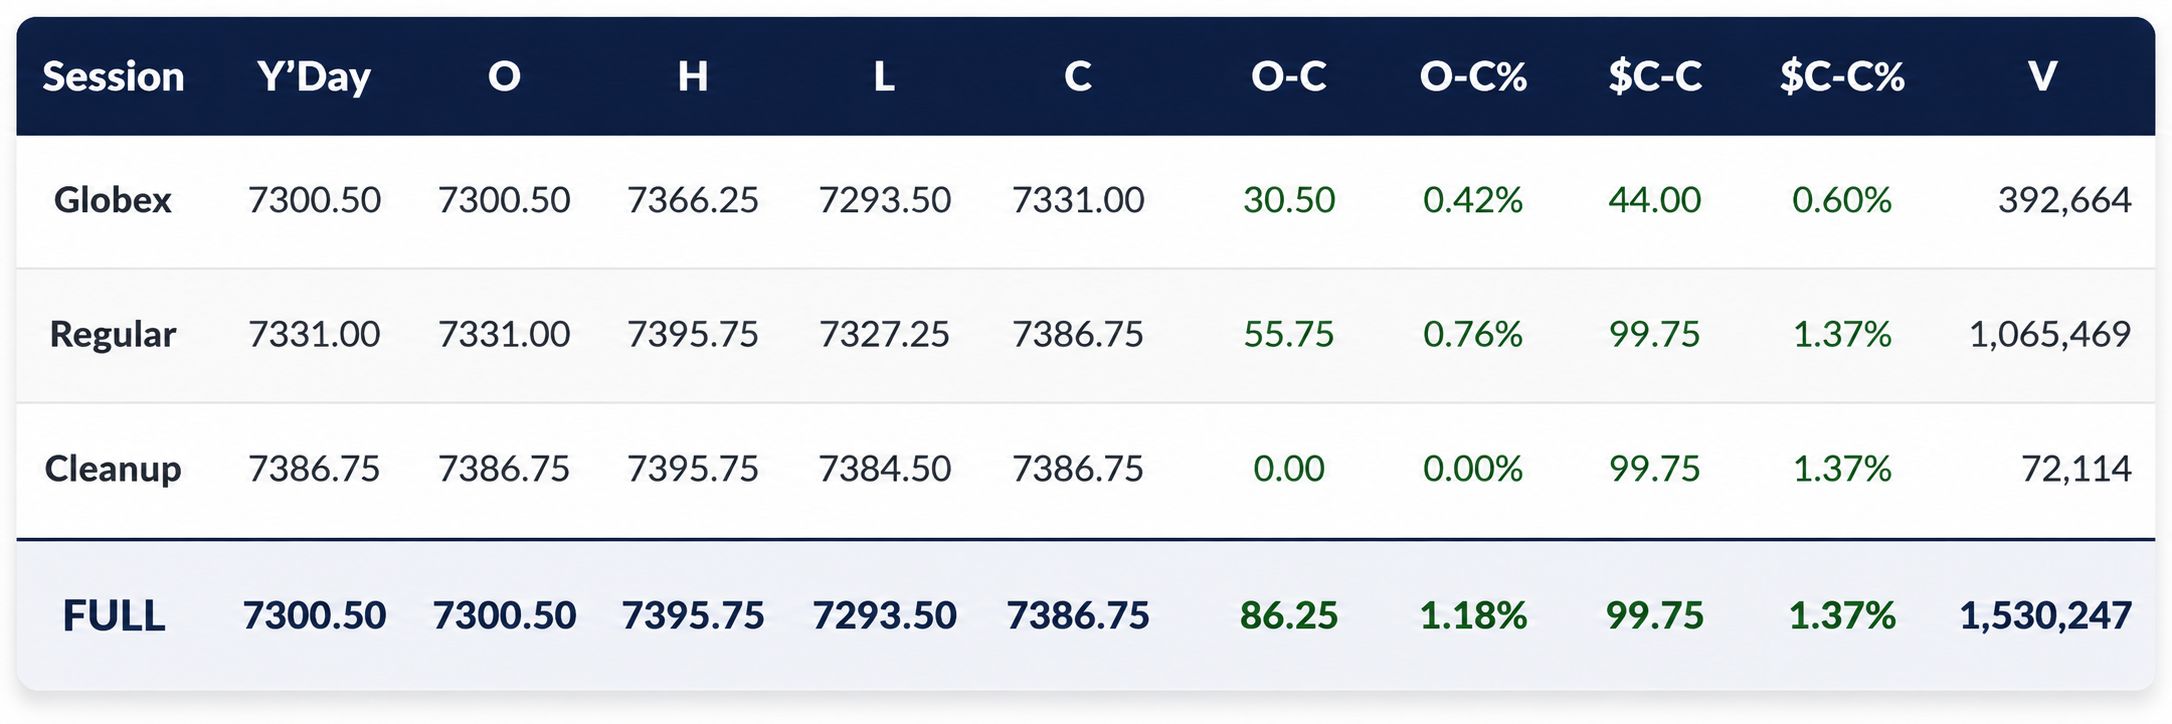
There is an Aerosmith song called “Train Kept A-Rollin’,” and I think it should be the theme song for the US stock market. After AMD reported smashing earnings, the ES made a 7293.50 low, rallied up to 7366.25, and opened Wednesday’s regular session at 7331.00, up 44 points or +0.42%.
After the open, the ES traded down to 7227.25, made a series of higher lows, and rallied 147.75 points up to 7375.00 at 11:05. It pulled back to 7363.75 at 11:10, rallied up to a lower high at 7373.50, sold off 14.75 points down to 7358.75 at 11:40, did a sideways-to-up back-and-fill, and made another lower high at 7369.75. It sold off 15.25 points down to 7354.50 at 12:55, traded back up to a new high at 7390.00 at 3:25, pulled back a few points, retested the high at 3:43, and traded 7386.50 as the 3:50 cash imbalance showed $3.5 billion to buy. It traded up to 7395.75 at 3:55 and traded 7386.75 on the 4:00 cash close.
After 4:00, the ES slowly drifted down to 7384.50 and settled at 7389.50, up 102.25 points or 1.40%. The NQ settled at 28,716.75, up 580.75 points or +2.06%, up 4 of the last 6 sessions for a total gain of 1,519.50 points or +5.59%. The YM settled at 50,034, up 619 points or +1.25%, up 2 in a row for a total gain of 946 points or +1.93%. The RTY settled at 2,895.20, up 42.30 points or 1.48%, up 4 out of the last 5 sessions for a total gain of 156.20 points or +5.70%.
In the end, I was right so far about the US and Iran — mainly the US — wanting an end to the war. In terms of the ES’s overall tone, it was another nonstop buy-fest and new all-time highs. In terms of the ES’s overall trade, volume was higher at 1.53 million contracts traded.
Why does the US want the Iran war over? I can’t say for sure, and I doubt I can list all the reasons, but below are a few of the reasons the US wants a halt to the war.
Memorandum of Understanding:
-
The US allies in Middle Eastern countries have seen mammoth damage to their cities and oil infrastructure.
-
A prolonged war would cause a global and domestic economic crisis.
-
Escalating military costs: I think the US used up a lot of its military hardware stockpile, and 13 out of 19 Middle East bases have been destroyed with a total repair cost of $25 billion and a total conflict cost of $40 to $50 billion.
-
Domestic political pressure: Polls show 6 out of 10 Americans disapprove of the administration’s handling of the war.
-
Strategic stalemate and regional stability: Allied vulnerability with US allies in the Gulf (Saudi Arabia, UAE, Jordan) have suffered direct missile and drone hits, leading to regional instability that threatens long-term U.S. interests.
-
China influence: Trump is heading to China this month, and he can’t meet with Xi with the Iranian blockade ongoing.
Where it is at now: The U.S. and Iran appear to be moving toward an initial agreement that would lift sanctions and release frozen Iranian funds in exchange for the reopening of the Strait and a halt to nuclear enrichment. However, the U.S. administration has maintained that “the bombing starts” again if a final deal is not reached.

MiM
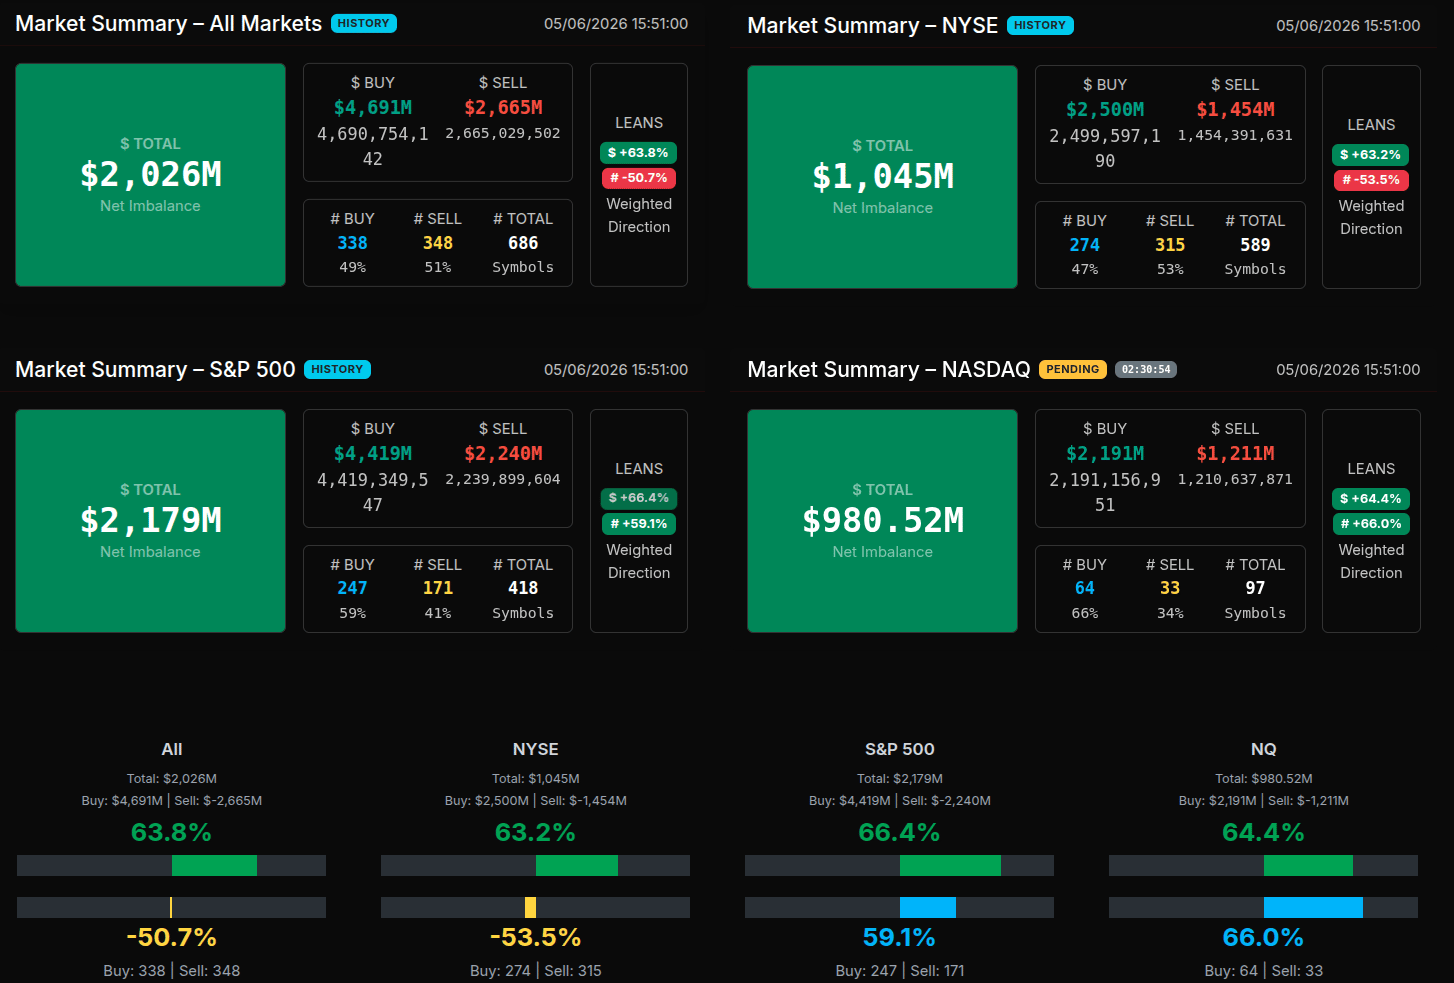
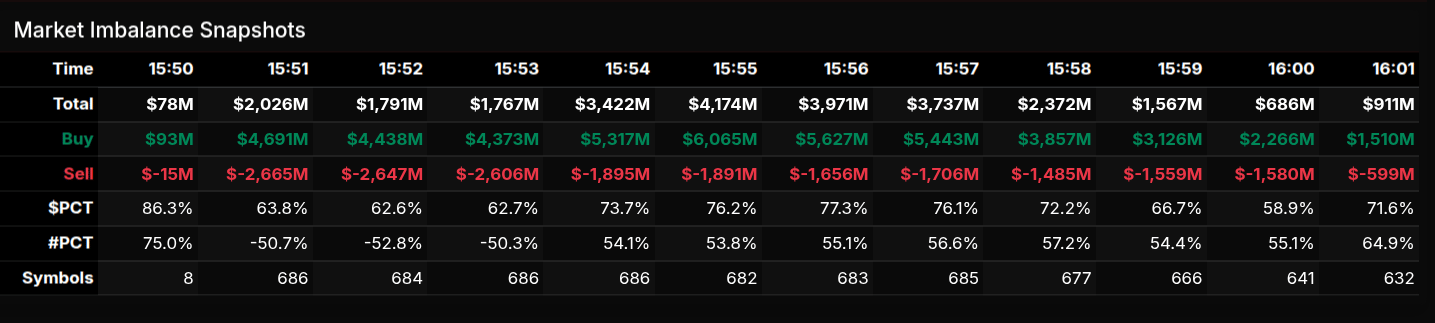
The MOC opened with a clear buy-side imbalance and quickly expanded into a broad institutional bid. At 15:50, the market showed $1.8B net, but by 15:51 it jumped to $2.026B, with $4.691B to buy against $2.665B to sell. That early transition was important: the dollar lean was +63.8%, while the symbol lean was -50.7%, showing that the dollars were aggressively buy-side even though the count of symbols was still slightly sell-heavy. That is rotational beneath the surface, but with large-cap demand carrying the tape.
The strongest early indication came in the S&P 500, which showed $2.179B net to buy at 15:51. The S&P dollar lean reached +66.4%, right on the wholesale-buy threshold, while the NASDAQ showed $980.5M net with a +64.4% dollar lean and +66.0% symbol lean. NASDAQ was not quite wholesale by dollars, but the symbol count was very close to a broad buy program.
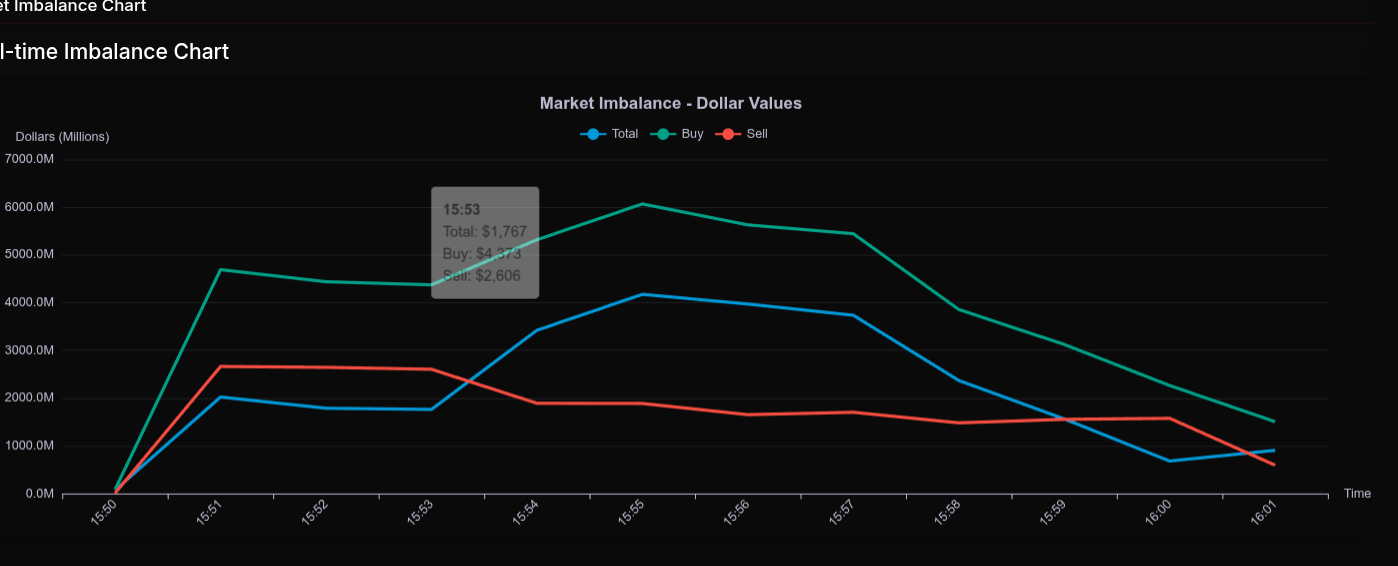
The imbalance peaked around 15:55, with total net demand reaching $4.174B. Buy dollars climbed to $6.065B while sell dollars stayed near $1.891B. From there, the MOC faded steadily into the close, dropping to $686M at 16:00 before rebounding to $911M at 16:01. Even with the fade, the closing profile remained buy-side.
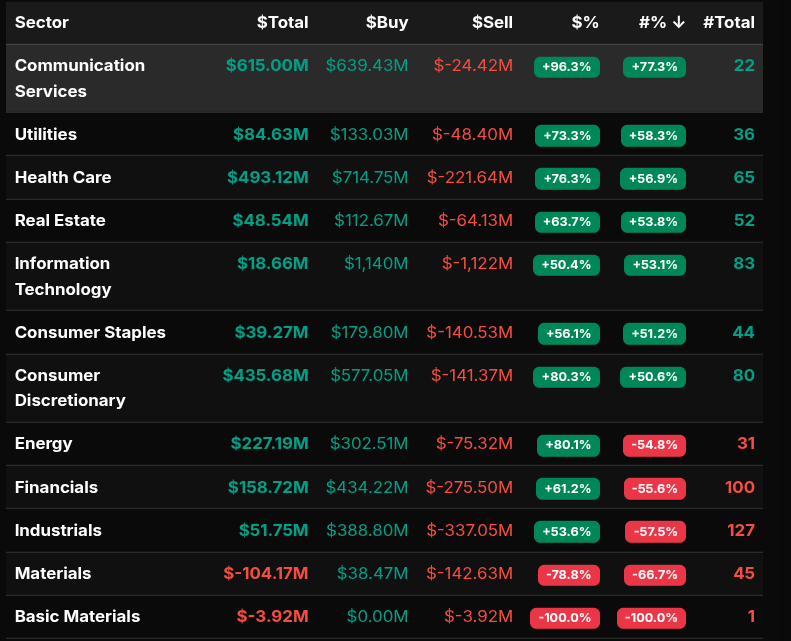
Sector leadership was heavily concentrated in Communication Services, Consumer Discretionary, Energy, Health Care, and Utilities. Communication Services had a notable +96.3% dollar lean and +77.3% symbol lean, a clear wholesale buy. Consumer Discretionary and Energy were also strong dollar buyers at +80.3% and +80.1%. Health Care showed +76.3%, while Utilities came in at +73.3%.
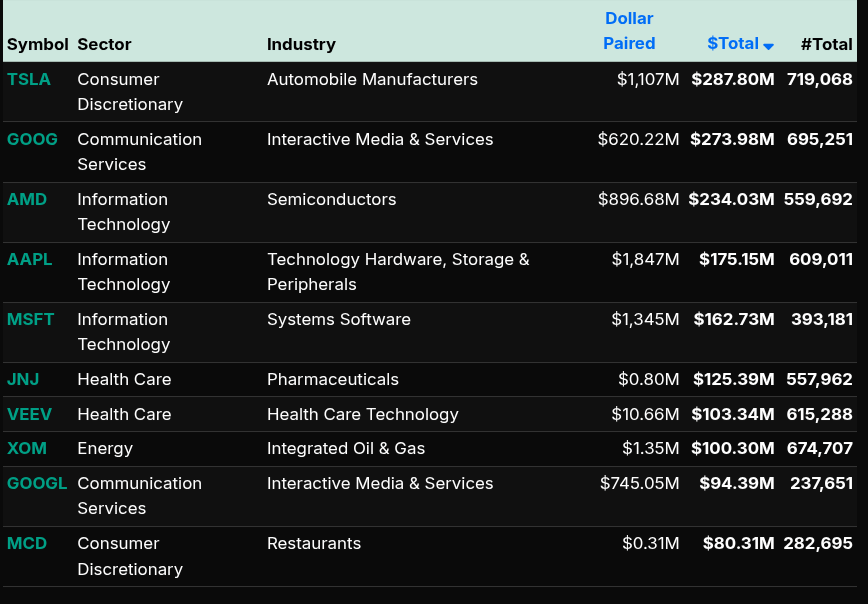
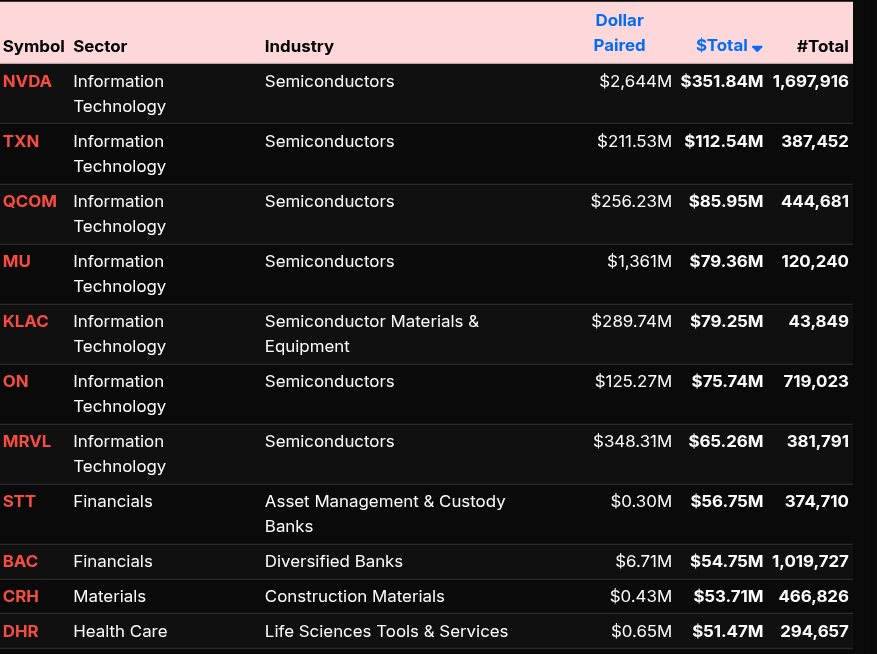
On the sell side, Materials stood out with a -78.8% dollar lean and -66.7% symbol lean, indicating wholesale selling. Basic Materials was fully offered at -100%, though only one symbol. Key buy symbols included TSLA, GOOG, AMD, AAPL, MSFT, JNJ, VEEV, XOM, GOOGL, and MCD. Major sell imbalances included NVDA, TXN, QCOM, MU, KLAC, ON, MRVL, STT, BAC, CRH, and DHR.
Live today at 9AM:


Fair Values for May 7, 2026
-
S&P: 25.65
-
NQ: 120.04
-
Dow: 102.14
Daily Breadth Data 📊
For Wednesday, May 6, 2026
• NYSE Breadth: 62% Upside Volume
• Nasdaq Breadth: 67% Upside Volume
• Total Breadth: 65% Upside Volume
• NYSE Advance/Decline: 68% Advance
• Nasdaq Advance/Decline: 65% Advance
• Total Advance/Decline: 66% Advance
• NYSE New Highs/New Lows: 216 / 32
• Nasdaq New Highs/New Lows: 562 / 122
• NYSE TRIN: 1.29
• Nasdaq TRIN: 0.92
Weekly Breadth Data 📈
For the Week Ending Friday, May 1, 2026
• NYSE Breadth: 54% Upside Volume
• Nasdaq Breadth: 54% Upside Volume
• Total Breadth: 54% Upside Volume
• NYSE Advance/Decline: 54% Advance
• Nasdaq Advance/Decline: 53% Advance
• Total Advance/Decline: 53% Advance
• NYSE New Highs/New Lows: 317 / 80
• Nasdaq New Highs/New Lows: 651 / 340
• NYSE TRIN: 1.00
• Nasdaq TRIN: 0.97

ESM2026

The bull/bear line for the ES is at 7371.50. This is the key pivot for today’s sentiment. ES is currently trading around 7397.00, which places price above the bull/bear line and keeps the short-term tone constructive as long as buyers continue to defend above 7371.50.
The upper range target for today is 7426.50. Price is already pressing near the upper side of the current range, with resistance first at 7426.50 and then at 7478.25. A sustained move above 7426.50 would keep upside momentum intact and open the door for a test of 7478.25.
The lower range target for today is 7316.75. If ES loses 7371.50 and fails to reclaim it, expect downside pressure toward 7316.75. A break below 7316.75 would weaken the setup further and bring 7293.50 into play, followed by 7223.25.
Additional support below the current price comes in at 7371.50, 7316.75, 7293.50, 7223.25, and 7158.25. Additional resistance above the current price comes in at 7426.50 and 7478.25.
Overall, ES remains bullish above 7371.50, but price is close to the upper range target, so chasing strength here carries risk. Bulls want to see pullbacks hold above 7371.50 or a clean breakout through 7426.50. Bears need a failure back below 7371.50 to shift momentum lower toward 7316.75.
NQM2026
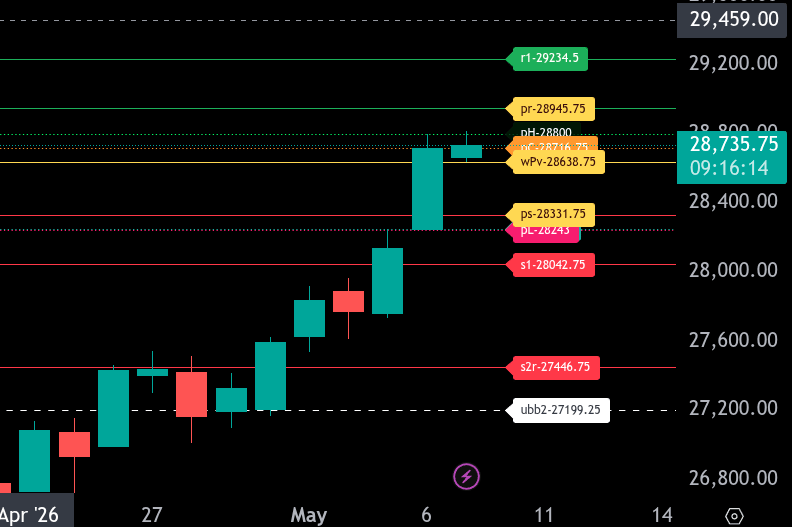
The bull/bear line for the NQ is at 28638.75. This is the key level for today’s sentiment. As long as NQ holds above 28638.75, the near-term tone remains constructive and buyers can look for dips to hold above this area.
Currently, NQ is trading around 28733.50, which places price above the bull/bear line and shows early strength in the Globex session. The first resistance is 28800.00. If price can clear and hold above 28800.00, the next upside target is 28945.75, which is today’s upper range target.
On the downside, first support comes in at 28638.75. A break back below that level would weaken the bullish setup and put pressure back toward 28331.75, today’s lower range target. Below 28331.75, additional support sits at 28243.00, followed by 28042.75.
If NQ continues holding above 28638.75, the preferred path is for a test of 28800.00 and potentially 28945.75. If NQ loses 28638.75, momentum likely shifts back toward a more defensive posture, with 28331.75 becoming the key downside objective.
Higher resistance remains at 29234.50. Bulls would need a sustained move through 28945.75 before that upper resistance becomes a realistic extension target.

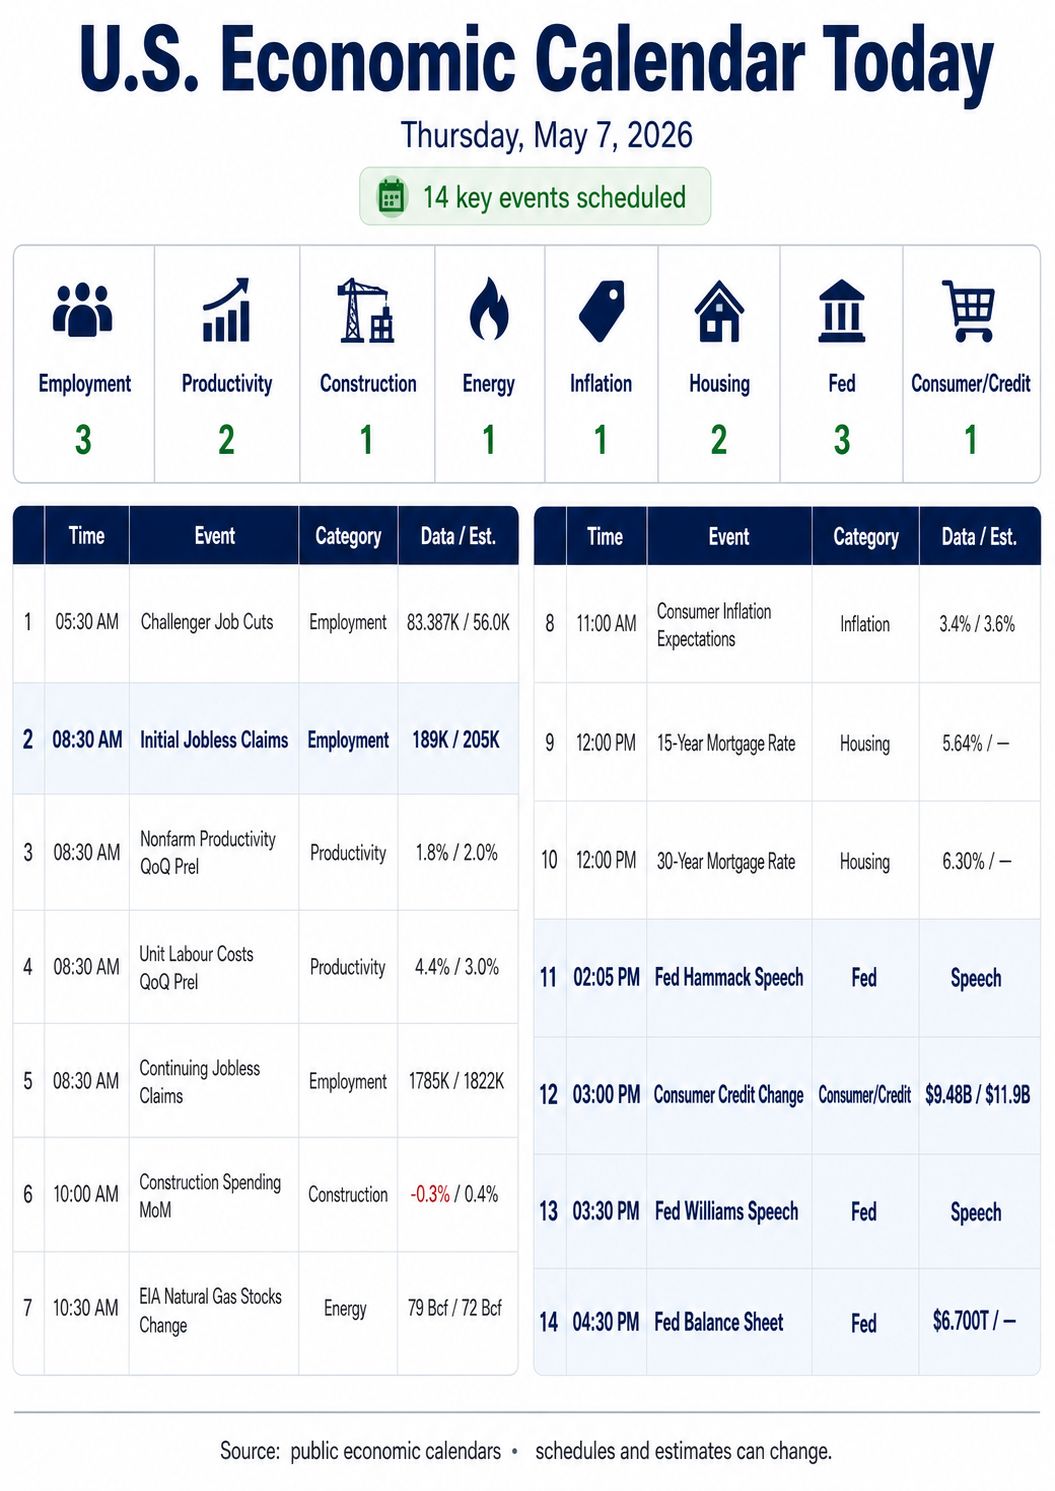
Today’s Economic Calendar
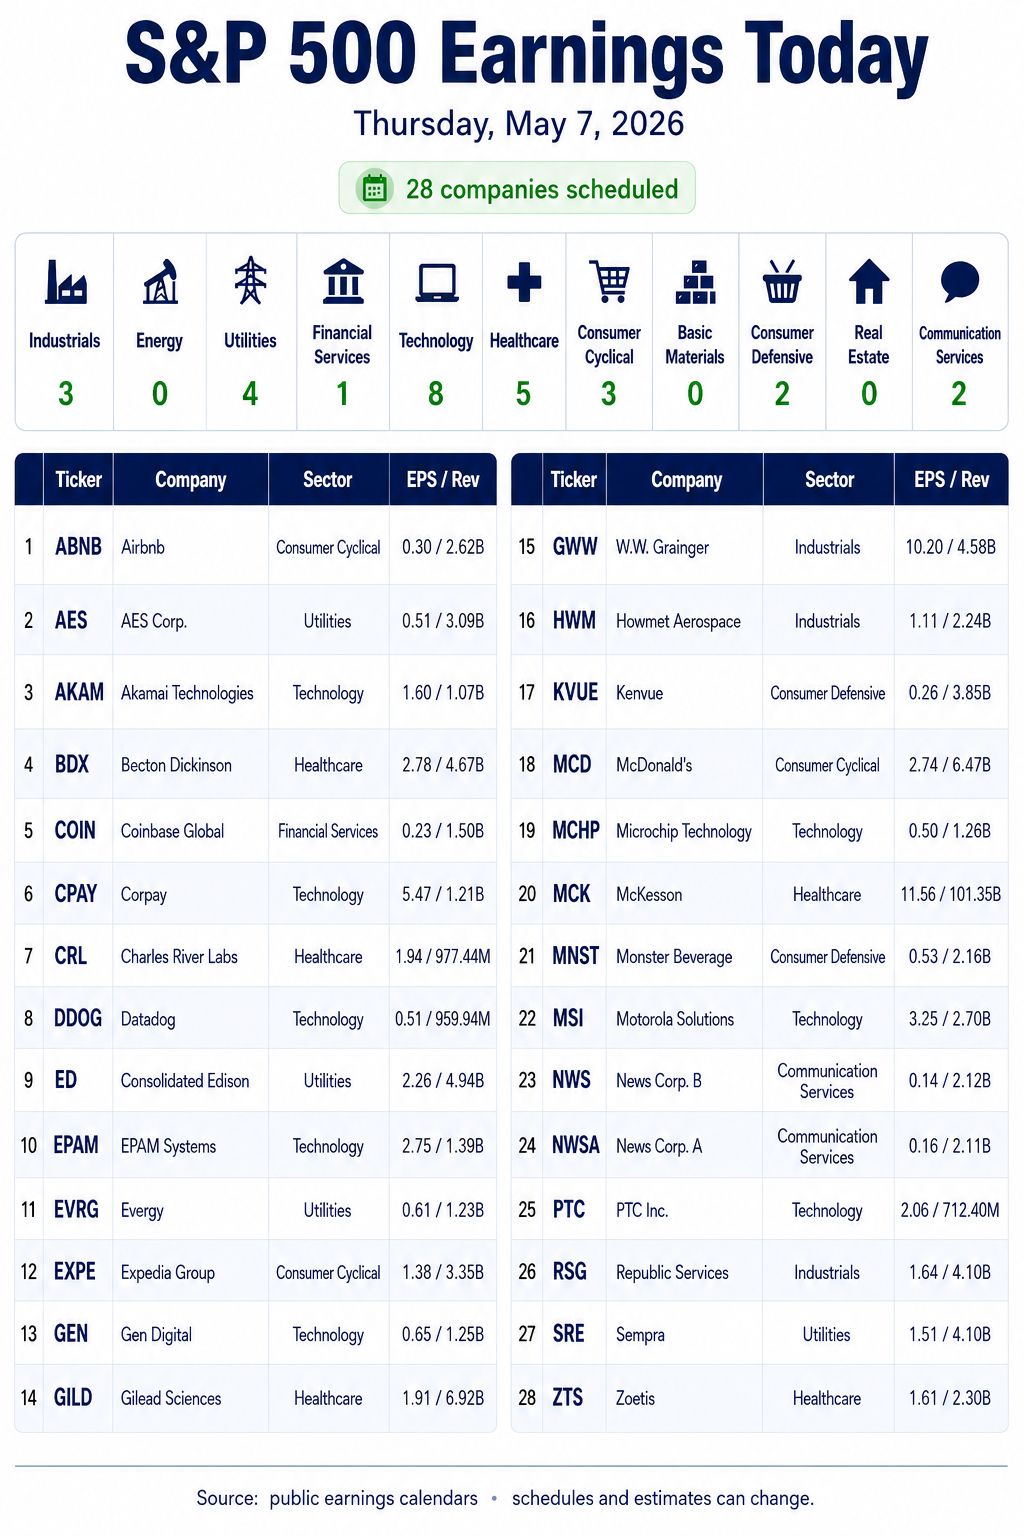
Earnings:

PTG Room Summary – For Wednesday, May 6, 2026
Pre-market setup
-
PTGDavid posted the opening chart link.
-
He shared the standard PTG key links:
-
Polaris Trading Group website
-
Daily Trade Strategy
-
Daily Range Calculator
-
Programming notice
-
David announced he would be absent from the day’s session.
-
Charts would remain online for members to follow.
DTG Room Preview – Thursday, May 7, 2026
Markets are focused on:
-
A possible US/Iran de-escalation proposal
-
Corporate earnings
-
Friday’s Jobs Report
US/Iran headlines:
-
The US has proposed a one-page memorandum of understanding to gradually reopen the Strait of Hormuz and ease the blockade on Iranian ports.
-
Nuclear negotiations would come later, broadly aligning with what Iran previously proposed.
-
Iran is expected to respond within two days, though Iranian media has suggested parts of the agreement may be unrealistic.
-
Trump said there is no deadline for an agreement, while also warning that bombing could resume if Iran does not agree.
-
Israel remains concerned and is seeking clarity from US officials.
Market reaction:
-
US stock futures and gold moved higher overnight.
-
Oil is down roughly 16% from Wednesday’s peak, easing some pressure on yields and curve dynamics.
-
Brent remains about 40% above pre-war levels.
-
Gasoline prices above $4.50 continue to pressure consumer sentiment and the administration’s messaging.
China energy theme:
-
Rising diesel prices and war-related energy pressure are accelerating China’s shift toward electric heavy trucks.
-
Electric trucks have grown to nearly one-third of new heavy-truck sales in China over the past two years.
-
China’s EV incentives and trade-in programs remain a key driver.
Earnings focus:
-
Premarket: MCD, SHEL, USFD, BCE, BDX, CNQ, LNG, DDOG, HWM, KVUE, SRE, TPR, TRGP, VTRS, GWW, WMG, ZTS and others.
-
After the close: ABNB, COIN, DKNG, EXPE, GILD, MCK, MCHP, MNST, MSI, RKT, TXRH, TOST and others.
-
Friday morning: TM, AU, BAM, ENB, FIS, KT, PPL and TU.
Economic calendar:
-
Challenger Job Cuts at 7:30am ET
-
Weekly Jobless Claims, Productivity and Unit Labor Costs at 8:30am ET
-
Delayed Construction Spending at 10:00am ET
-
Consumer Credit at 3:00pm ET
-
Fed speakers: Kashkari, Hammack and Williams
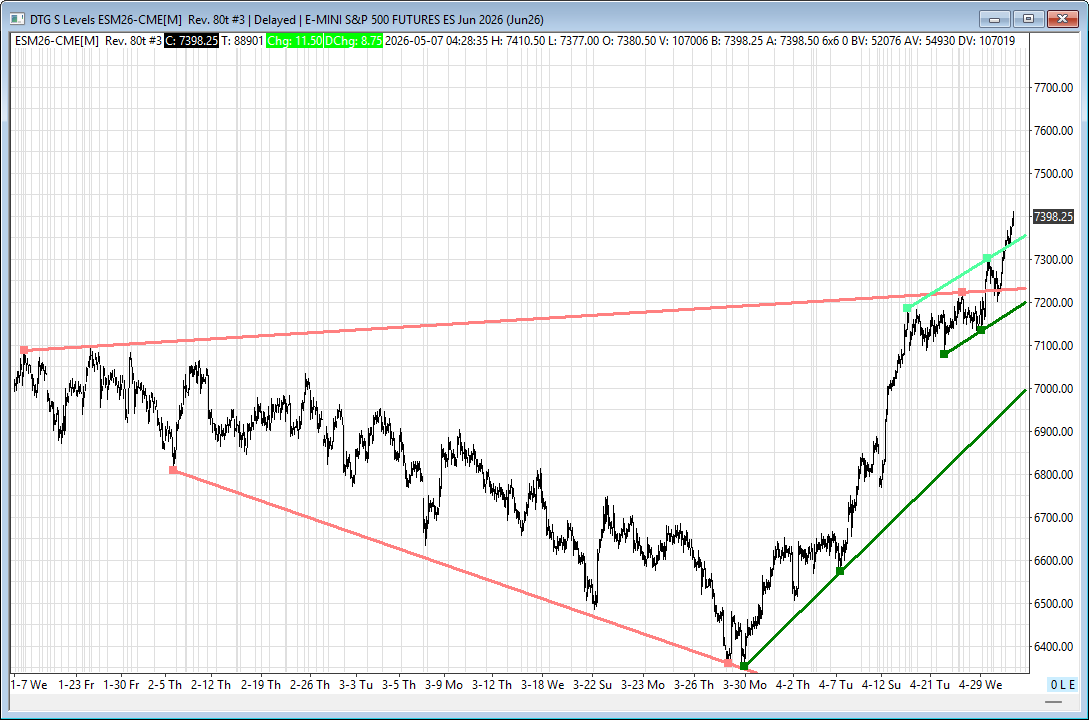
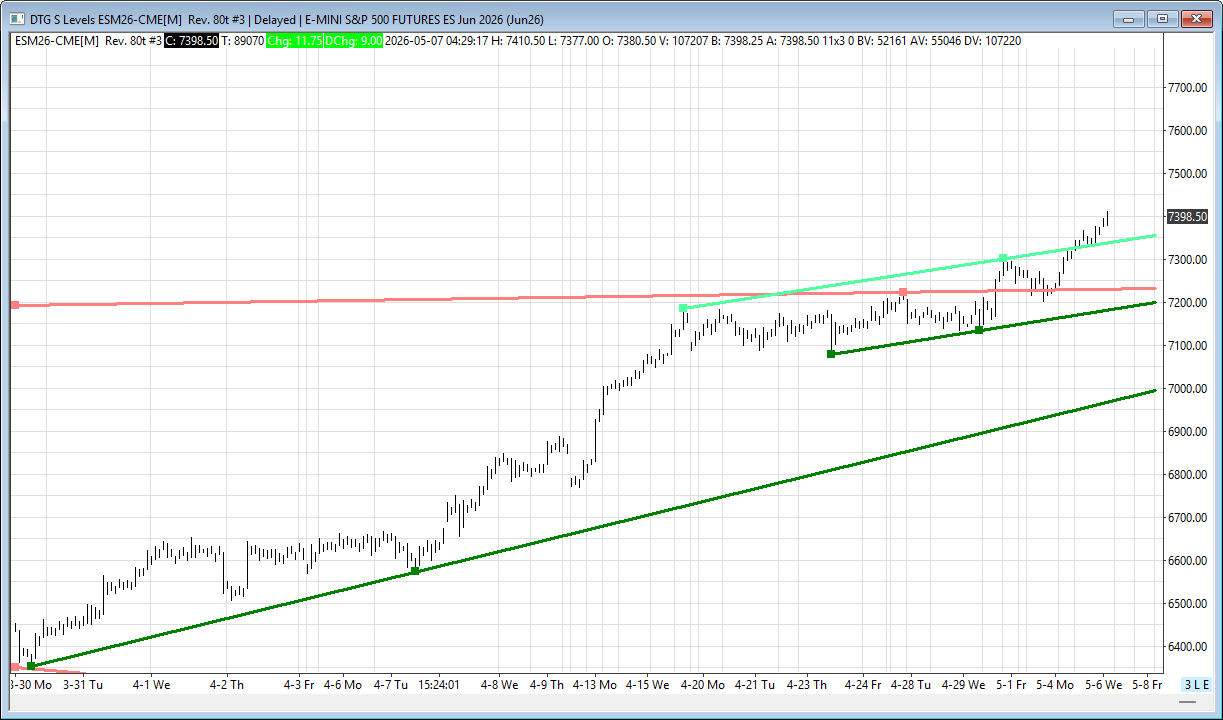
ES technicals:
-
Volatility remains elevated, with the ES 5-day average daily range rising to 89.75 points.
-
Whale bias is slightly bullish into the 8:30am ET jobless claims release, though overnight large-trader volume is lighter than recent sessions.
-
The short-term uptrend strengthened after the prior channel top held as support.
-
Bulls have blue sky above until a new swing high develops.
-
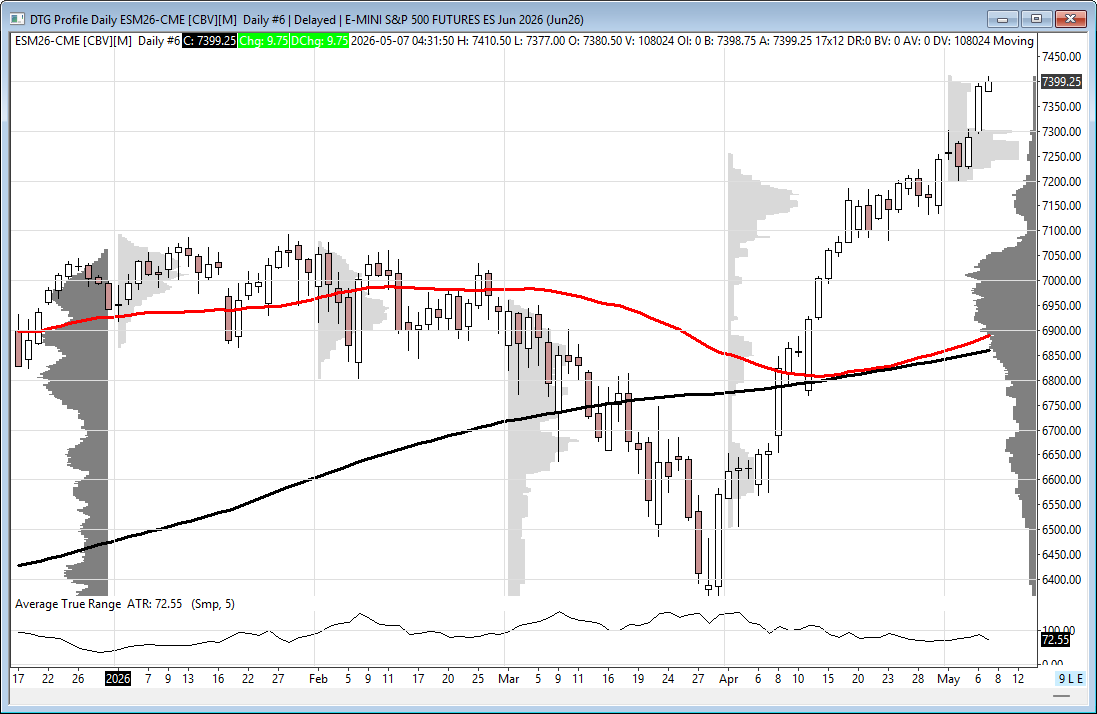
The 50-day MA remains above the 200-day MA, keeping the moving-average bias bullish.
-
ES is up more than 1,000 points, or nearly 16%, from the March 30 swing low.
Key ES levels:
-
Resistance: None listed
-
Support: 7343/46, 7234/29, 7197/00, 6997/02
Affiliate Disclosure: This newsletter may contain affiliate links, which means we may earn a commission if you click through and make a purchase. This comes at no additional cost to you and helps us continue providing valuable content. We only recommend products or services we genuinely believe in. Thank you for your support!
Disclaimer: Charts and analysis are for discussion and education purposes only. I am not a financial advisor, do not give financial advice and am not recommending the buying or selling of any security.
Remember: Not all setups will trigger. Not all setups will be profitable. Not all setups should be taken. These are simply the setups that I have put together for years on my own and what I watch as part of my own “game plan” coming into each day. Good luck!
This post goes out as an email to our subscribers every day and is posted for free here around 2 PM ET. To get your real-time copy, sign up for the free or premium version here: Opening Print Subscribe.
Comments are closed