The Opening Print Recap
The ES traded in a narrow range on Globex with only 109,000 contracts traded. On the 9:30 ET futures open, it traded 4617.75 and traded in a 7.5 point trading range between 4620.50 to 4613 for 4.5 hours leading up to the Fed.
Fed days tend to be like this…a slow, low-volume grind until the headlines hit. However, this was a particularly quiet day up until 2:00 when the Fed headlines started hitting the tape, saying “Tapering Starting November, With Monthly Reductions Of $15 Billion — Prepared To Adjust Taper Pace ‘As Warranted.’”
Further, Powell says the Fed will remain patient on rate hikes, which allowed the ES to rally up to 4632.50 in 4 minutes before pulling back down to 4625.25. From there, it skyrocketed up to 4647.25 going into 3:00.
After a little back-and-fill near the high, the ES pushed up to a new high at 4649.25, just 3 ticks shy of ES 4650. The ES pulled back down to 4644.25 as the early MIM showed $400 million to sell. After the dip, the ES shot up to 4657 on the 3:50 cash imbalance, which ‘flipped’ to $335 million to buy. The ES traded 4652.75 on the 4:00 cash close. After 4:00, the ES drifted around in a 4-handle range and settled at 4651.75 on the 5:00 futures close, up 30.25 points or 0.65% on the day.
In the End
In the end, the Fed did pretty much what we expected: It stuck to its plan.
In regard to the ES’s overall tone, it was very firm and it was one of the tightest pre-Fed announcement ranges I can remember. In terms of the ES’s overall trade, there were only 109,000 contracts traded on Globex and 927,000 on the day session for a total of 1.026 million contracts traded with most of the volume coming from 2:00 to 4:00.
Our View
You just can’t fight the Fed. You’re lucky if you can make any money on the short side and I am not interested in that at all. I screwed up yesterday. When the ES popped up after 2:00 I got out of my position at 4630.50. As @PaulOlson70 said on Twitter — and quoting @jimcramer in the process — “No one goes broke taking a profit.”
He also added, “You did us and yourself right with your market feel this week.”
That was nice of Paul but my intention is to hold a long ES position into the end of the year and I blew it.
Our Lean
If you maintained your longs this far, keep them. If you didn’t, continue to buy the pullbacks when they come. Today could very well be a down day and if they are weak late in the day I am going to buy.
As we all know, there’s no crystal ball when it comes to trading stocks, options, or futures. But the Market Imbalance Meter may be as close as it comes. Knowing how the “Big Money” is placing its bets can give our trading room a big wave to ride — or a warning sign to stay out of the water. Come check it out now, risk-free for 30 days.
Technical Breakdown
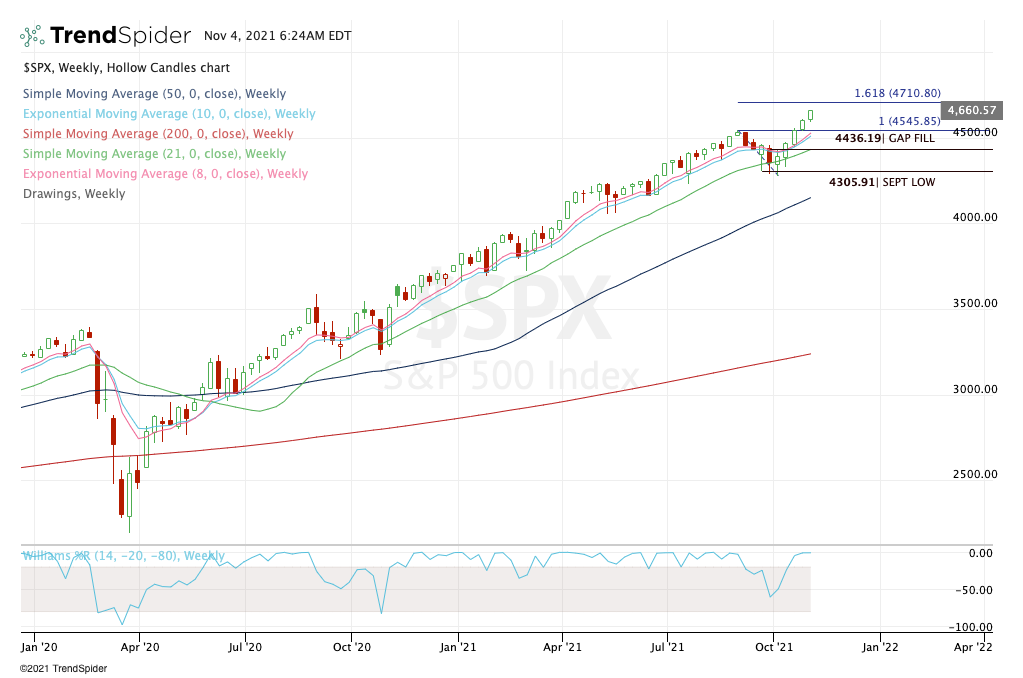
After losing the 8-day and 10-day moving averages, the S&P 500 index was rejected by both measures on Oct. 12 and 13. Then a 1.2 burst sent the index rocketing higher over these measures and they haven’t been tested in 14 days since. For a high-growth stock, this would be a good run and wouldn’t be that unusual. For the S&P, it’s unusual.
Like Danny says, “continue to buy the pullbacks when they come.” The Fed didn’t do much to change the BTD narrative for now. For a daily chart of the SPX, see yesterday’s post.
As for above, we’re looking at a weekly chart, just to illustrate how darn orderly this run has been since the Covid lows in Q1 2020. We did have one little blip in September-October, with the index falling almost 6%.
For now, it still looks like 4,700 to 4,710 is on tap. The question is whether we will get that dip to the 8- and 10-day first or after.
QQQ

As far as the QQQ goes — as well as the Nasdaq and NQ futures — we have a pretty similar situation to the SPX. The asset has been screaming higher and with the Fed now keeping a lid on interest-rate hikes, tech may have some room to run. AMZN isn’t getting killed after disappointing earnings and if it’s ready to run, we could see more upside in this ETF.
As for the charts, It really wouldn’t be a bad thing to get a reset back to the $283.50 to $383 area. Unless it happens in “one fell swoop,” it will likely break the 8- and 10-day moving averages to get there.
I’ll be honest, I’m likely a dip-buyer at either measure — the 8/10 day or the $382.50 to $383 level. Below $380 and a bit more selling may take place, but I’m not looking for that big of a dip. Just one to reset the indices before a year-end push.
ROKU

Generally speaking, Roku reported a good quarter, but certainly not a blowout quarter even though revenue grew 50% year over year. Still, down 36% from the highs ahead of earnings and it would have seemed like expectations were priced in at these levels.
As far as Roku is concerned, a nasty gap-down would have been somewhat nice, as an undercut of the May low near $272 and a recapture of this level would give us a strong reversal signal. However, we may have to settle for the same trade on an undercut of the October low.
A monthly-down rotation that gets reversed higher would give us a decent entry opportunity, because it would give us a low-risk low to measure against. It’s one of those situations where we can risk a few points on the downside and look for double-digit points on the upside in a good scenario.
Even in a “just okay” setup, this can give us a great cash flow trade by quickly booking some profits on a decent bounce and moving to a breakeven stop-loss. This is great for more conservative traders who are risk-averse at the moment.
SOFI

The trade in SoFi continues to work well. Let’s keep it simple, as we wrote a few days ago:
“Some ‘back-and-fill’ — as Danny would say — would be productive and allow some of the shorter term moving averages to catch up. Above $21.75 and bulls remain in control. On the upside, I am looking for an eventual push to the $24 to $25 area.’
You can’t blame yourself for missing the breakout. However, the stock gave us a perfect dip back to last month’s high and bounced hard. If you are in this name on that dip, I continue to look for more upside. Let’s see if we can get the $24+ zone. We now have some great cushion in the trade.
Ethereum

Are there any crypto traders in The Opening Print?
While many will disregard this group for obvious reasons, it does tend to be a volatile yet technically accurate trading vehicle. Focusing specifically on Ethereum, we finally got that breakout to new highs over ~$4,400.
The more time Ethereum builds over this level, the more bullish it becomes. To see it act as support on a dip along with the 8- and 10-day would solidify the bull case even more. The more time it spends over $4,400, the better the odds are we see a push up to the 161.8% extension near the $4,900 level, followed by $5,000.
Disclaimer: Charts and analysis are for discussion and education purposes only. I am not a financial advisor, do not give financial advice and am not recommending the buying or selling of any security.
Remember: Not all setups will trigger. Not all setups will be profitable. Not all setups should be taken. These are simply the setups that I have put together for years on my own and what I watch as part of my own “game plan” coming into each day. Good luck!
Disclaimer: Charts and analyses are for discussion and education purposes only. I am not a financial advisor, do not give financial advice and am not recommending the buying or selling of any security.
Remember: Not all setups will trigger. Not all setups will be profitable. Not all setups should be taken. These are simply the setups that I have put together for years on my own and what I watch as part of my own “game plan” coming into each day. Good luck!
Comments are closed