Our View — Rate Cuts & Hikes
I am not surprised by yesterday’s rally at all. Everyone was offside going into the two-day Fed meeting. When the crowd gets too short in front of such an important economic data point, the markets tend to short cover and that’s what we saw on Tuesday. Remember, big dead-cat rallies are part of bear markets.
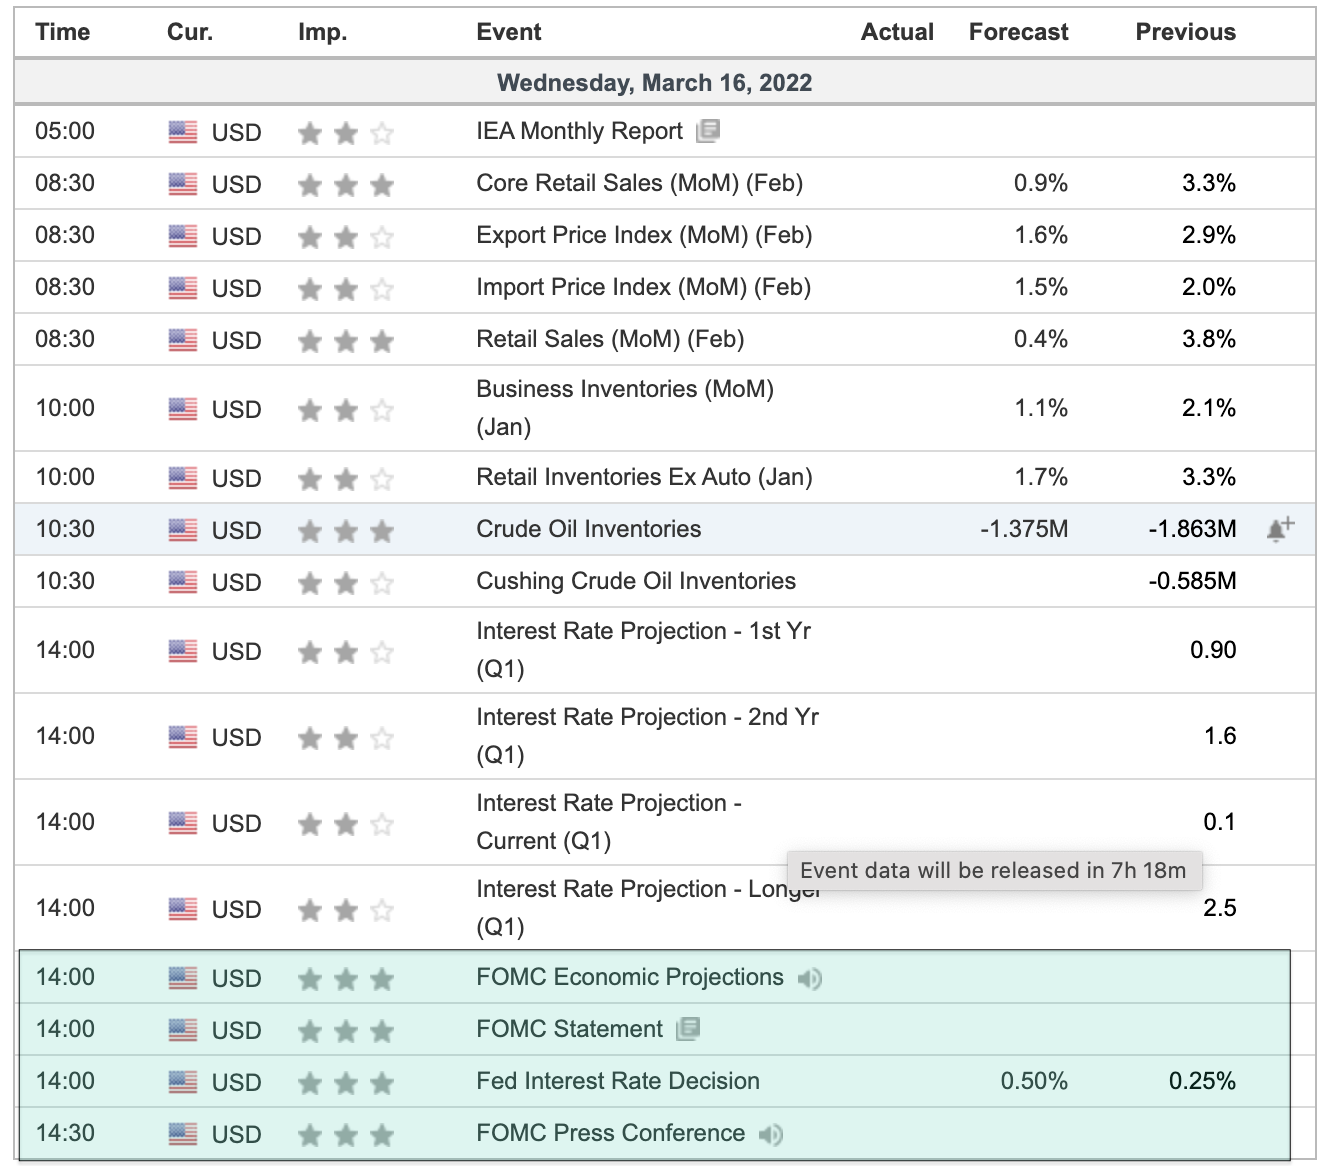
Today the Federal Reserve is going to raise interest rates by 25 basis points. As you know, I’m a big believer in historical stats. While there are both rate cuts and rate hikes in the graph below, it clearly shows how the markets recover more often than not.
Does that mean the S&P is going to rally after today’s rate hike? Not necessarily, but I think the odds favor it. Call it what you like, but a relief rally of sorts could certainly be in the cards.

Our Lean
For months the concern is that when rates rise, not only will bond prices fall, but higher rates will pressure equities and push stock prices down. Does it have any historical basis? Actually, the argument presented here is quite the opposite. Historically, stocks have performed favorably during periods of higher rates.
I think we still go higher, but I have a feeling there is going to be a big two-way trade. Our lean is to sell the early rallies and buy the pullbacks or just be patient and buy the pullback for the first part of the day and then flatten out. If the ES sells off after the headline and the price action is holding, I would be a buyer.
Lastly, BE SMART.
If you are getting whipped around and taking on too much risk…then take a few days off. The PitBull taught me a long time ago that taking a step back is the best way to clear your head and recharge. Remember, the markets are here every day, 52 weeks a year. They ain’t going anywhere.
Daily Recap
The ES traded down to 4129.50 and rallied up to 4196 on Globex at 9:12 am and opened Tuesday’s regular session at 4194. It gyrated quite a bit in the opening minutes of the day, trading up to 4208 and then dropped down to 4178.50 at 9:45.
It leveled out and eventually climbed more than 60 points to ~4239 just after 12:30. It was all buy stops and buy programs, then a headline hit saying: “Russia Pres Putin: Kyiv is not serious about finding a mutually acceptable solution.”
From there, it was a big ping pong game: The ES fell to 4220 and rallied to 4237. Then it fell to 4213 and rallied to 4216. One last flush sent the ES down to 4208 shortly after 2:10.
From there, the bulls took over. We got 10 straight higher closes on the 10-minute chart, with the ES rallying 55 handles to its high of day at 4263.25. That came after the MIM 3:50 cash imbalance showed $4.3 billion to buy. The ES traded 4256.25 on the 4:00 cash close and settled at 4250 on the 5:00 futures close, up 79 points or 1.9% on the day.
In terms of the ES’s overall tone, it was firm all day with every pullback being bought. In terms of the ES’s overall trade, volume was high at 2.03 million contracts traded.
Technical Edge
- NYSE Breadth: 74% Upside Volume
- NASDAQ Breadth: 77% Upside Volume
Bulls stepped up on Tuesday, delivering a solid rally ahead of the Fed event. While the narrative for rising rates is that it’s a negative for growth stocks — and thus, stocks in general — many people don’t seem to realize that stocks historically rise during a rising-rate environment.
We need three things to stop the bear market now:
- Get past the first rate hike, which we’ll do today.
- See some resolution in Eastern Europe — or at the very least, no further escalation (and none in China, either).
- Inflation to cool.
Rising inflation is starting to fire up the “recession” talk, while geopolitical risk triggers obvious “risk-off” behaviors. However, if we can cross two of the three issues off our list — and inflation is still a tough one — then we can at least take a step in the right direction.
Game Plan
Unfortunately, we don’t write the game plan for entertainment! It’s our real game plan we bring into the market each day.
Right now, I’m looking at a market that wants to rally. The question is, can it continue to push higher after the Fed announces the rate hike? That has been my feeling — as the Fed has telegraphed its actions pretty clearly, in my opinion — even as yesterday’s rally got things going a little early.
One observation that stood out to me on Tuesday was the lag in growth stocks. ARKK got going late, but many growth faves were lagging throughout the session. Further, breadth was a little lackluster. We failed to generate an 80%+ upside day, which I thought may be possible given Tuesday’s strength.
S&P 500 — ES
- Feel free to extrapolate this layout to the SPY.

**Just go level to level. For example, if the ES clears 4275, it puts ~4303 in play. If it breaks below XX, it puts XX in play.**
Upside levels to watch:
- 4275
- 4303 & 21-day sma
- 4327
- 4360 to 4378
Downside levels to watch:
- 4250
- 4223
- 4186
- 4152
- 4138
Nasdaq — NQ

Upside levels to watch:
- 13,550 — 61.8% retracement and 10-day ema
- 13,800 and the 21-day sma (both have been active resistance)
Downside levels to watch:
- 13,270
- 13,190
- 13,000 to 13,025 — key area. Feb & March low.
Individual Stocks
I want to reiterate my note from Tuesday, which is that, “I want to be patient over the next day or two.”
We hit a couple of good cash flow trades on Monday with the Tesla rotation and BTU. Crude also paid quite well for some decent scalps off our key levels. As a result, I mostly want to sit tight and see how the indices handle the Fed. Plain and simple.
Energy and MKC are some exceptions.
Energy Stocks — XLE

Many stocks look similar to the XLE ETF and even more rallied nicely off today’s low. What we’re seeing here is an “ABC” correction to the 21-day sma, with a doji candle and a tag of the 161.8% downside extension.
Nice!
It doesn’t guarantee any sort of profit, but the setup at least lines up nicely. If we get a daily-doji-up rotation over yesterday’s high, let’s see if the XLE can fill the gap at $73.55 and possibly climb to the 10-day ema.
If we get a daily-doji-down rotation below Tuesday’s low, it could open the door down to the 50-day. Of course, how oil/CL trades will be a big influence on the XLE.
Might it be time for a rotation out of energy and into tech? We’ll see how the market handles the Fed.
MKC

Definitely not the sexiest name out there. But over ~$99 puts MKC over numerous daily highs, as well as the 10-day, 21-day and 50-day moving averages.
Go-To Watch List
*Feel free to build your own trades off these relative strength leaders*
Numbered are the ones I’m watching most closely.
- Crude — Let’s see if it can hold the 10-week ema here and this $94 to $95 support area. Key for XLE, too (charted)
- TU — doji on the 21-day.
- TECK
- VRTX — breakout over $243. Remember, we were looking for this on 3/11
- CCK
- Energy —XLE, APA, CNQ, CVX, ENB | b/e stop on these.
- Boring but Good: BRK.B, MKC
- ABBV, BMY
- Gold, GDX
- ADM — inside day. Now look for a move over Tuesday’s high
- CHKP
- COOP
- AR
- COST, DLTR
Economic Outlook
Comments are closed