Our View
I am always concerned that when the markets go haywire, the small guys (retail accounts) get wiped out. A very well-known Chicago futures broker told me that in the first four months of the year, the firm lost 35% of its active futures and options accounts. I must heed the warning about this because I think the trading and the losses can get worse as the ‘summer chop’ continues into July.
Yes, the markets have been going up lately, but be prepared for the 50- and 70-point drops along the way. Even on a semi-quiet day, the ES has a 100-point trading range.
As you know, I talk to the PitBull a lot. He thinks trading against the ES and NQ bots is impossible right now. I had some bad runs over the last two months, but seem to be getting back on track. One of the things I really have to work on is the same three rules I have posted over and over:
- Don’t get fooled into getting too bullish.
- All rallies are dead-cat bounces — it’s just a question of how far they’ll rally.
- The trend is your friend and remember, the trend has been down.
Our Lean
Ah…four-day trading weeks are always tough. I think it has to do with essentially cramming five sessions worth of stuff into four sessions. Of course, it doesn’t help that we had the FOMC minutes on Wednesday and the jobs report on Friday.
I honestly hate talking ‘gloom and doom’ because I’m a bull at heart. However, we expected the ES would firm up going into July — and it has — but it has also been susceptible to some decent downside raids. It seems like most people are looking for more upside. I can’t rule that out, but I also can’t rule out new lows at some point.
Do I think that is coming soon? No, not really. But everything feels like it’s on some kind of bad balancing act that could tip at any moment. We all know how all the previous rallies have ended. I think it’s OK to be bullish, but I also think it’s OK to be a cautious bull.
Our lean, you can sell the early rallies and buy the pullbacks or just be patient and buy the pullbacks. Keep an eye on 3850 — a pivot from Wednesday. Above 3865 should get us to 3875. I know it’s just 10 points, but hey, 10 points is 10 points.
3850, 3865 and 3875 are highlighted below:

Daily Recap
The NQ swung within a 100-plus-point range in each of the first three 15-minute candles this morning, while the ES swung in two 28-point ranges in each of the first two 30-minute candles.
The ironic part? One hour into the session and the ES was less than 1-point from where it opened, at 3836.50. The ES then sold back down to 3817.25 at 11:00, rallied up to 3829.50, and then broke down to 3811.50 at 11:45.
It rallied back up to 3839.75 going into 2:00, tagged 3841 after the Fed minutes hit the tape and then dropped down to 3822 at 2:12. Then a big buy program hit, pushing the ES straight up to 3859.50 at 2:33, a 38-point rally in 33 minutes.
The ES traded down to 3851 at 3:02 and printed 3875 at 3:37. The ES traded ~3857 as the 3:50 cash imbalance showed $900 million to buy and sold off down to 3741 at 3:53 — 34 points off the high. The ES traded 3846.50 on the 4:00 cash close and settled at 3854 at the 5:00 futures close, up 14 points or 0.37% on the day.
In the end, it was all about the ‘chop’ — The ES swung in 20 and 30 handle moves right up to the Fed minutes. The Nasdaq futures have been the upside leader for the last two days, but like several days over the past few months, it got weak going into the cash close.
In terms of the ES’s overall tone, the action was sloppy. In terms of the ES’s overall trade, volume was on the low side at 1.64 million contracts traded. Remember when we would kill for that much volume last summer? Now it’s light.
- Daily Range: 66.25 points
- H: 3875
- L: 3808.75
Technical Edge
- NYSE Breadth: 26% Upside Volume
- NASDAQ Breadth: 57% Upside Volume
- VIX: ~$26.75
You can tell that the VIX is coming down because our individual stock trades continue to perform well. That doesn’t usually happen when the VIX is $30+
UUP, DG, MRK, AAPL, GOOGL, etc. have all been trading exceptionally well lately. In this kind of tape, it’s important to “book ‘em while you got’em” because the ranges are simply too wide to mess around.
I have gotten used to taking ½ off at the first target, then moving to ¼ targets from there. With an opening bid this a.m., be sure to check out the Trade Sheets down below for managing the open positions.
Game Plan: S&P 500 (ES & SPY), Nasdaq (NQ & QQQ), DLTR
S&P 500 — ES

There was a lot of volatility in Wednesday’s session, but so far the bulls are keeping things “bid.” However, Danny said it best: “The ES has been susceptible to some decent downside raids.”
It’s quietly working on its fourth straight up-day. Last week, the 21-day moving average stopped the ES in its tracks. It wobbled there yesterday too, but is pushing higher in the overnight session.
Daily-up over 3875 gets us 3900. Above that and 3920 to 3950 is back in play, along with last week’s high (3950).
On the downside, only two zones matter: 3800 to 3810 and 3740 to 3750.
Cash flow idea: Depending on the open, a rally to 3875 that fails could give us a decent reversal short, especially if we have just a small, short-lived move above this level so we can use the HOD as our stop.
S&P 500 — SPY (Daily and Weekly)

Being rejected by the 21-day moving average just like last week, let’s see if the SPY can go daily-up over $385.87.
If it can, it could open the door for a push into the $390s and to last week’s high.
On the downside, $380 needs to hold for the bulls. Otherwise, it’s back down to $374.
Nasdaq — NQ

Yesterday we wrote: “We could have a quick move into the 12,000+ level and the 50-day.”
We came within 25 points of that 12K level, but if we can clear yesterday’s high near 11,975, we could see a push higher today.
The NQ is above its short-term moving averages. Now let’s see if it can get to the 12,225 to 12,250 area.
Nasdaq — QQQ

QQQ is in a similar situation, now above its short-term moving averages. I want to see it stay above $285.
Below opens the door back down to the $277 area.
Otherwise, let’s see if this can drift up to the $295 to $297 area.
DLTR

DLTR went monthly-up over $163.36 on Tuesday and held that level today.
This is one to keep an eye on, especially over the June high. Currently, it’s struggling with the post-earnings high from May.
Definitely on “BTD” watch.
Go-To Watchlist — Individual Stocks
*Feel free to build your own trades off these relative strength leaders*
- Numbered are the ones I’m watching most closely.
- Bold are the trades with recent updates.
- Italics show means the trade is closed.
Trade Sheets:
- MCK — We have hit two trim zones so far on MCK. Feel free to cash the last ⅓ of the position as you see fit. $335 to $340 is a potential upside target if it continues higher. Moving stop-loss up to $315
- DG — Trim and raise stops → “If this stock sees $250 to $252 today, I will be out of ½ and looking for $256 for the second tranche and $260 to $262 for the last portion.”
- That is still the plan → ¼ at $255 to $256 & ¼ at $260 to $262
- Stop at $243
- MRK — Hit Targets 1 & 2 → Now out of ½
- $90 to $91 Stop Loss (or B/E).
- Looking for $95+ for ¼, then not sure. Maybe hold the last ¼ for a push to $100 if we don’t get stopped out.
- GOOGL — Long from daily-up trigger near $2,270 → Should have specified $2,300+ as a trim spot. From here, a retest of yesterday’s high near $2,311 would warrant a trim for me, but really am looking for $2,350 to $2,375.
- Aggressive bulls can use a stop-loss at $2,225
- Conservative bulls can use a B/E stop-loss
- AAPL — Long from daily-up trigger near $141.70 → First target was specified at $143.50 and that hit yesterday. Under no circumstance do we let this go against us now.
- Trim on any notable opening push higher.
- $145 to $146 is still the next upside target and if achieved, we will be out of ⅔ to ¾ of the position
Relative strength leaders (List is cleaned up and shorter!) →
- DLTR — just went monthly up.
- BMY
- MRK
- ABBV
- UNH
- JNJ
- XLE — 200-day is getting close.
- CLR
- VRTX
- DG
- IBM
- MCK
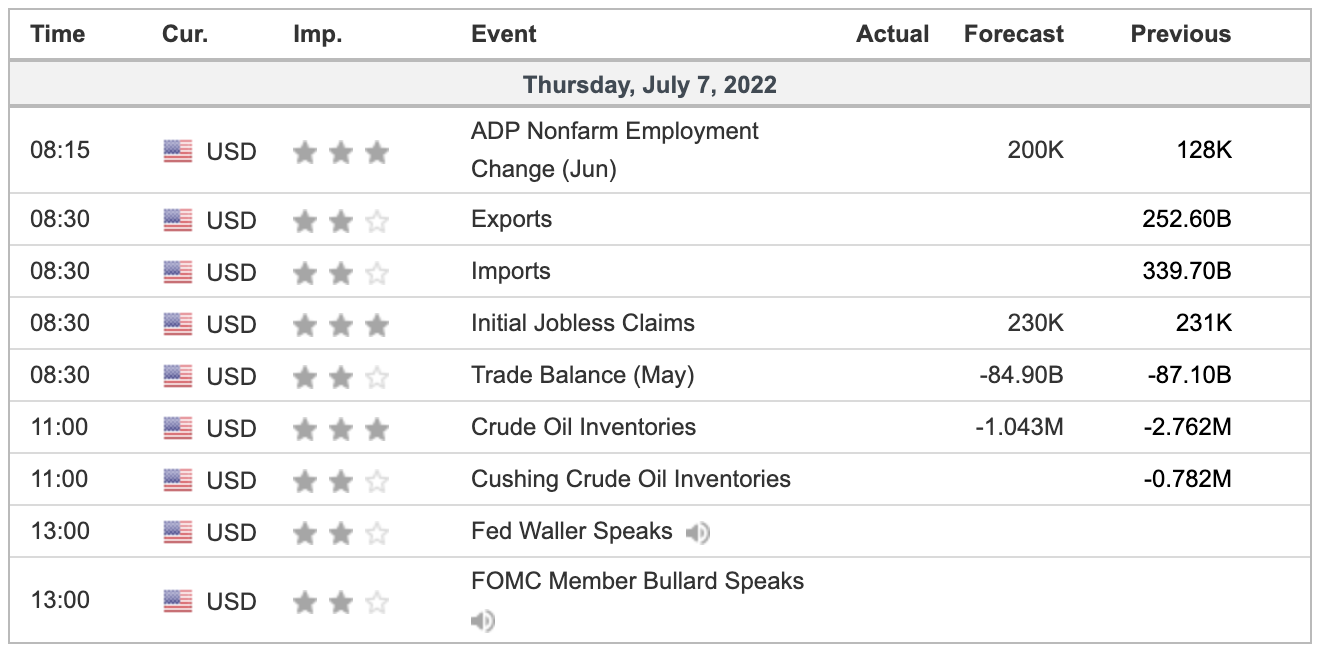
Economic Calendar
As we all know, there’s no crystal ball when it comes to trading stocks, options, or futures. But the Market Imbalance Meter may be as close as it comes. Knowing how the “Big Money” is placing its bets can give our trading room a big wave to ride — or a warning sign to stay out of the water. Come check it out now, risk-free for 30 days.
As we all know, there’s no crystal ball when it comes to trading stocks, options, or futures. But the Market Imbalance Meter may be as close as it comes. Knowing how the “Big Money” is placing its bets can give our trading room a big wave to ride — or a warning sign to stay out of the water. Come check it out now, risk-free for 30 days.
Comments are closed