Our View
This could very well end up being a very volatile week that will be capped off by Fed Chairman Jerome Powell and his speech from Jackson Hole, WY. on Friday.
In that speech, he’s expected to give an update on the central bank’s efforts to combat inflation. That speech — plus economic reports or earnings — could weigh on the S&P, but I get this feeling that after a two-day 3.5% drop, we could get a bounce.
I am going to leave it like that, but I think the S&P acts nervous.
Our Lean
I suspect the ES will bounce on Globex, but if the ES opened lower tomorrow my lean would be to buy the early weakness and sell any 30- to 50-point rally — notice the change vs. when we were buying the 50- to 70-point dips over the last few weeks.
The NQ has fallen more than 800 points from its recent high and has slid in four of the last five sessions. It seems overdue for a bounce. From the Globex low to the recent high, the 50% retracement for the NQ is 13,282. If we rebound to this level, it would likely be a decent spot to sell.
Daily Recap

The ES made a high of 4229.50 and a low of 4177.50 on Globex, then traded 4178.50 on Monday’s 9:30 ET futures open. After the open the ES sold off down to 4151 and then rallied to 4265.50 at 12:05, chopped in a 6 to 8-point range, and then sold off down to a new low at 4233 at 2:59.
The ES short-covered back up to the 4245.50 level at 3:16 and then sold back off down to 4131.50 at 3:30. The ES traded 4137.50 as the 3:50 cash imbalance showed $1.3 billion to sell and traded 4142.75 on the 4:00 cash close, settling at 4146.50 on the 5:00 futures close, down 90 points or 2.1% on the day.
In the end, the ES was overbought and ‘spooked’ over the possibility that Putin will up the ante during the Ukrainian Independence Day and amid the recent attacks in Crimea. I think the world knows that Putin is stuck and I doubt he will resort to using a tactical nuclear weapon, but I do think there is going to be repercussions for killing one of his ally’s daughters.
In terms of the ES’s overall tone, it was weak but again with the Nasdaq leading the way lower. In terms of the ES’s overall trade, 1.67 million ES contracts traded, just above average.
- Daily Range: 90 points
- H: 4221.50
- L: 4131.50
Technical Edge
- NYSE Breadth: 82% Downside Volume (second 80%+ in a row)
- NASDAQ Breadth: 78% Downside Volume
- VIX: ~$23.50
Game Plan: S&P, Nasdaq, Oil, OXY, PEP, Utilities
Closing near the lows on Friday set us up for one of two outcomes: A bounce from active support or a possible “change in tune.” We’re seeing the latter play out as selling pressure again picks up in the market.
With a little luck and a focus on relative strength leaders, we were able to get another strong push from some of our individual stocks. The dollar — UUP — is back to 52-week highs, while AR got us another trim yesterday (more on managing these, below).
We are down to just a couple of positions now, and they are running at breakeven or profitable stops. That’s a great position to be in from a stress/position management point of view.
We’ve had one of our best stretches of the year over the last 6 to 7 weeks. In that respect, I’m very much okay with letting the market reset and consolidate a bit here before rushing back into some positions, although we do have our eye on a few.
S&P 500 — ES

I’m not surprised we’re pulling back, but I am surprised that the ES knifed through the 10-day and 21-day moving averages so easily, as well as the 4170 level.
From here, I want to see if we can get a bounce going and how strong it is if we get it. Basically, I want to know if 4170 to 4200 will be resistance or if the bulls can reclaim it.
It would be classic action to draw in the longs, then deal out a couple of quick declines that “trap” them at higher prices.
Thought out loud: Could it really be so obvious to top at the 200-day and pull back to the 50% retrace and 50-day moving average, near 3980 to 4000?
S&P 500 — SPY

I want to see if SPY is rejected by $416.50 to $417, then $420 — or if it can reclaim these levels. If it can, $430 and the 200-day is back in play. If it can’t, bulls need to be cautious in the short-term.
Note that SPY found buyers late in the day after filling the gap and tagging the 21-day. Now we see how it handles from here. More selling pressure could eventually put $397 to $400 in play.
Nasdaq — NQ
The Nasdaq has been underperforming the S&P, and we’re seeing it potentially lose a key area around 13,000.
If we bounce, does the 13,150 to 13,250 area act as resistance or is it reclaimed? That’s what we’ll need to see. Otherwise, the broader target could be the 12,400 area.
Oil

We have not dabbled in oil much since it broke below support. Currently testing active resistance via the 21-day, oil is one to keep an eye on.
If this thing picks up steam and begins to push higher, there goes the “inflation is dead” argument, which will mean more rate-hike rhetoric and likely lower stock prices. Just something to keep an eye on.
OXY

Aggressive bulls can justify a long position right now, but I really love the idea of buying a dip into the $66s, where we find a key rotation point and the 10-day moving average.
Oil is rallying today, so it may not come to fruition, but I would love to own OXY on a dip to this area.
PEP
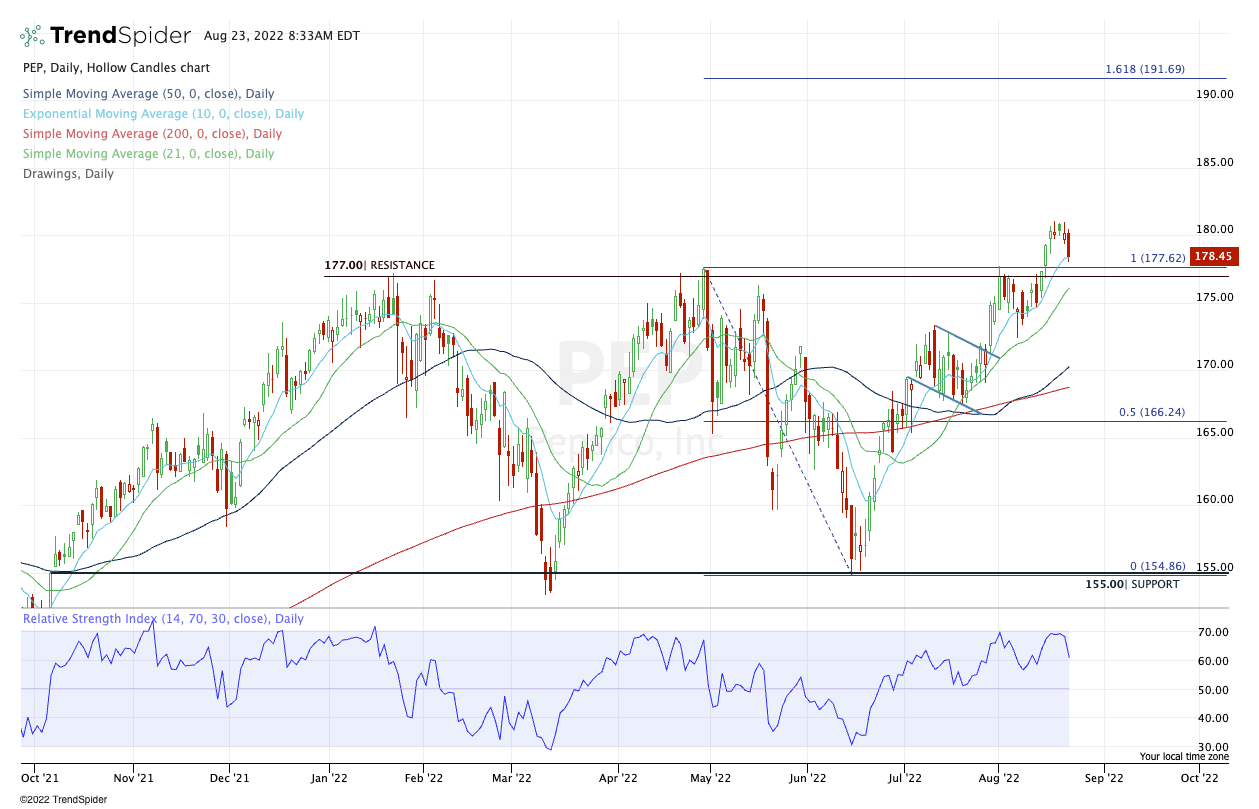
Aggressive buyers can be long right now, but in this tape, I prefer waiting for a retest of $177 and perhaps even a test of the 21-day.
XLU

One of the best performing sectors is the XLU — which may be kind of concerning for bulls. But regardless, the Utilities continue to do well.
Into active support here, let’s see that last week’s low at $76.43 holds as support.
Back over $77 and this one can press the recent highs. Below last week’s low and the XLU may want $75 and the 21-day. Either way, I’m looking to nibble at this one.
Go-To Watchlist — Individual Stocks
*Feel free to build your own trades off these relative strength leaders*
- Numbered are the ones I’m watching most closely.
- Bold are the trades with recent updates.
- Italics show means the trade is closed.
- UUP — Trim another ¼ on any new high today, as UUP is back to the 52-week highs. Raise stops to $28.40 to $28.50.
- CHNG — second target of $25 hit. Now down to just ⅓ position. Take all profit here or move to a B/E stop and look for $25.50. (Really Nice reset on the 10-day).
- APLS — HALF position at $65. Exit at even for conservative traders. Otherwise, $63.50 stop-loss and $68 as our first upside target.
- AR — Out ⅔ of position after hitting our second target at $44. B/E stop. Might as well look for $46.50+ for the rest.
Relative strength leaders (List is cleaned up and shorter!) →
Top 5:
- HRB
- PEP
- XLU
- CI
- MCK
The Rest:
- CNC
- F
- BMRN
- APLS
- ENPH
- TAN
- FSLR
- LNG
- PWR
- CHNG
- CELH
- COST
- UNH
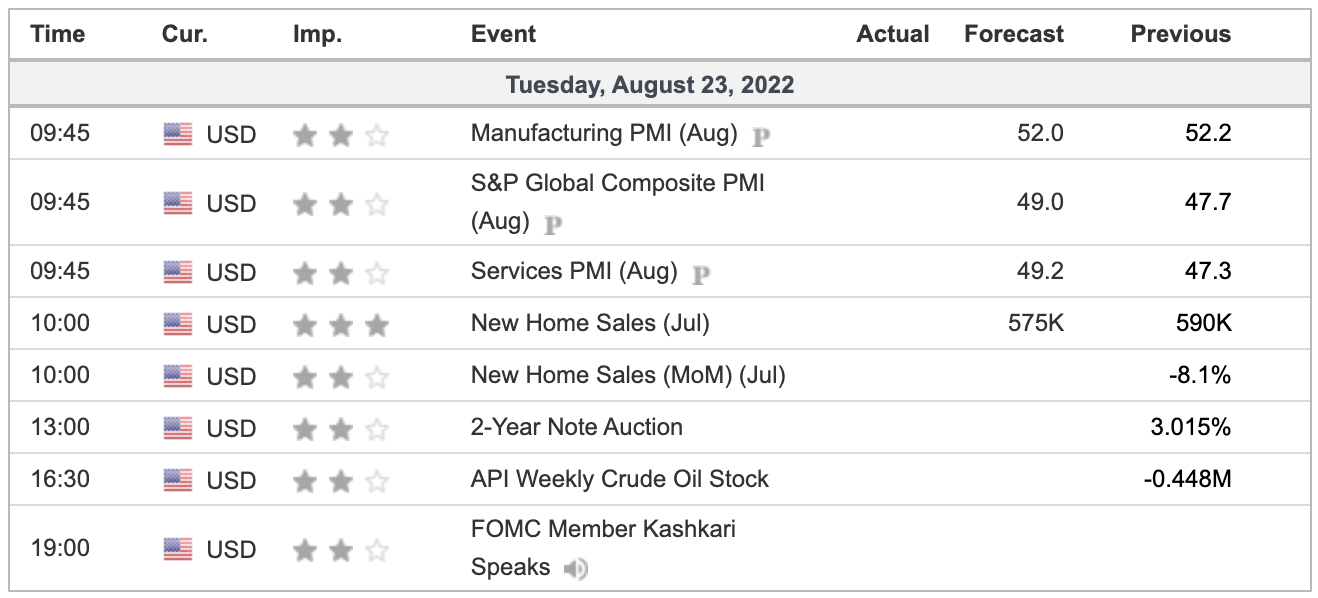
Economic Calendar
Comments are closed