We officially have a date and a link for the Mr. Top Step webinar on Saturday, Sept. 10. The signup link can be found here.
Our View
Coming into Friday, investors were looking for a Fed pivot from Chairman Powell. He did anything but, doubling down on the Fed’s fight against inflation. Fed President Neel Kashkari’s comments yesterday only added to it, saying:
“I was actually happy to see how Chair Powell’s Jackson Hole speech was received…People now understand the seriousness of our commitment to getting inflation back down to 2%.”
You know the old rule: Don’t fight the Fed — and right now the Fed seems to prefer tightening over loosening, hawkish over dovish, higher rates over lower rates and being more restrictive rather than accommodative.
As we enter September, the Fed’s plan now calls for unwinding some of its balance sheet. Here are some of the highlights:
- The Fed will boost its monthly caps for the number of Treasuries and holdings of mortgage-backed securities that it will let mature to $60 billion and $35 billion, respectively while using its $326 billion stash of T-bills as filler when coupons run below the monthly level. September will be the first month that bills will be redeemed since coupons will fall below the monetary authority’s new cap.
- The Fed’s portfolio has $43.6 billion of Treasury coupons maturing in September, which means that officials will need to let go of $16.4 billion of bills as well. It will also need to let another $13.6 billion runoff in October. These will be the largest declines for the bill portfolio until September 2023.
- There are longer-term concerns because as the Fed has fewer securities to lend to dealers in its daily operations, it will impede their ability to cover short positions and make it more expensive to borrow in the repo market.
Our Lean
Despite the down-tick on the close, the ES seems to be a lot of ‘back and fill’ price action at the 4020 to 4030 level. While T+2 did show some buying yesterday, we think there could be more today.
The 50% retracement from the recent low to the 4327.50 high sits at 4167.25, while the 61.8% is up at 4205. If we zoom into just the price action since Jackson Hole, the ES has a range of ~4007 to ~4217 — the 50% retracement of that zone is 4112.
To bring it home, here are the levels on my screen that I’ll be watching today: 4086, 4112, and 4167.
I think if the bulls grab control, we could see the second target — 4112 — in Tuesday’s session.
Our Lean: If the ES opens 35 to 40 points higher, it will be hard not to sell the open or the early rally, but I think the overall bias will be up. The DAX has rallied almost 450 points from yesterday’s low.
Daily Recap

The ES traded down to 4006.75 on Globex and opened Monday’s regular session at 4028. After the open the ES traded down to the 4020.75 level and at 9:42 traded up to 4043.75. After the high, the ES sold off down to a higher low at 4029, rallied up to 4047.25 at 9:57, pulled back to another higher low at 4030.50 at 10:06, and then rallied up to a new high at 4050.50 at 10:21.
From there though, it dropped 33.50 points down to 4017 at 10:54. After a 33 points rally to erase the recent decline, the ES dipped 13 points around 12:30 then rallied another 22 points to new session highs. From there, it was a series of 20-point pops and drops, with the ES eventually hitting the session high of 4064 at 1:45. The ES made a lower high at 4052.25 as the MIM flipped from small to sell to small to buy and traded 4045 as the 3:50 cash imbalance showed $240 million to buy, then dropped down to 4029.25 on the 4:00 cash close. After 4:00, the ES slowly traded up to 4035.75 and settled at 4035.75 the 5:00 futures close, down 23.75 points or -0.60% on the day.
In the end, after the early low and bounce you could see the sell volume start to shift and the buys pushing into the buy stops above 4038 up to the highs. After the high though, the ES had a hard time regaining its footing. In terms of the ES’s overall tone, most or all of the buying was short covering. In terms of the ES’s overall trade, 1.9 million contracts traded.
- Daily Range: 57.25 points
- H: 4064
- L: 4006.75
Technical Edge
- NYSE Breadth: 35% Upside Volume
- NASDAQ Breadth: 42% Upside Volume
- VIX: ~$25.50
Game Plan: S&P, Nasdaq, Oil, Bonds, Individual Stocks
Monday’s action saw the stock market trying to rally, but failing to gain sufficient upside momentum. In a holiday week — Labor Day — that’s not too surprising, although volume has been pretty steady so far.
The biggest focus right now? Have we shifted gears?
Put another way, have we gone from buying the dips to selling the rips?
We may be due for a bounce as the ES/S&P flushed down into a key support area on the charts and they gave us a doji-like close yesterday. There are plenty of charts to get through. Let’s get started!
S&P 500 — ES

Friday’s lows around 4042 have been an interesting pivot. It was resistance yesterday until the afternoon, then support, and then finally lost shortly before the close. Again, it was resistance in the early part of Globex but has been support in the overnight session once reclaimed.
On the upside, keep 4064 in mind — yesterday’s high.
A move above that level that doesn’t reverse keeps a daily-up rotation in play, opening the door to the 4080s, then 4112. The latter is the 50% retracement of the recent range and was also a support level last week (until Friday’s action).
On the downside, a move back below 4040 is not good and puts the Globex low in play around 4027, followed by yesterday’s low at ~4007.
SPY
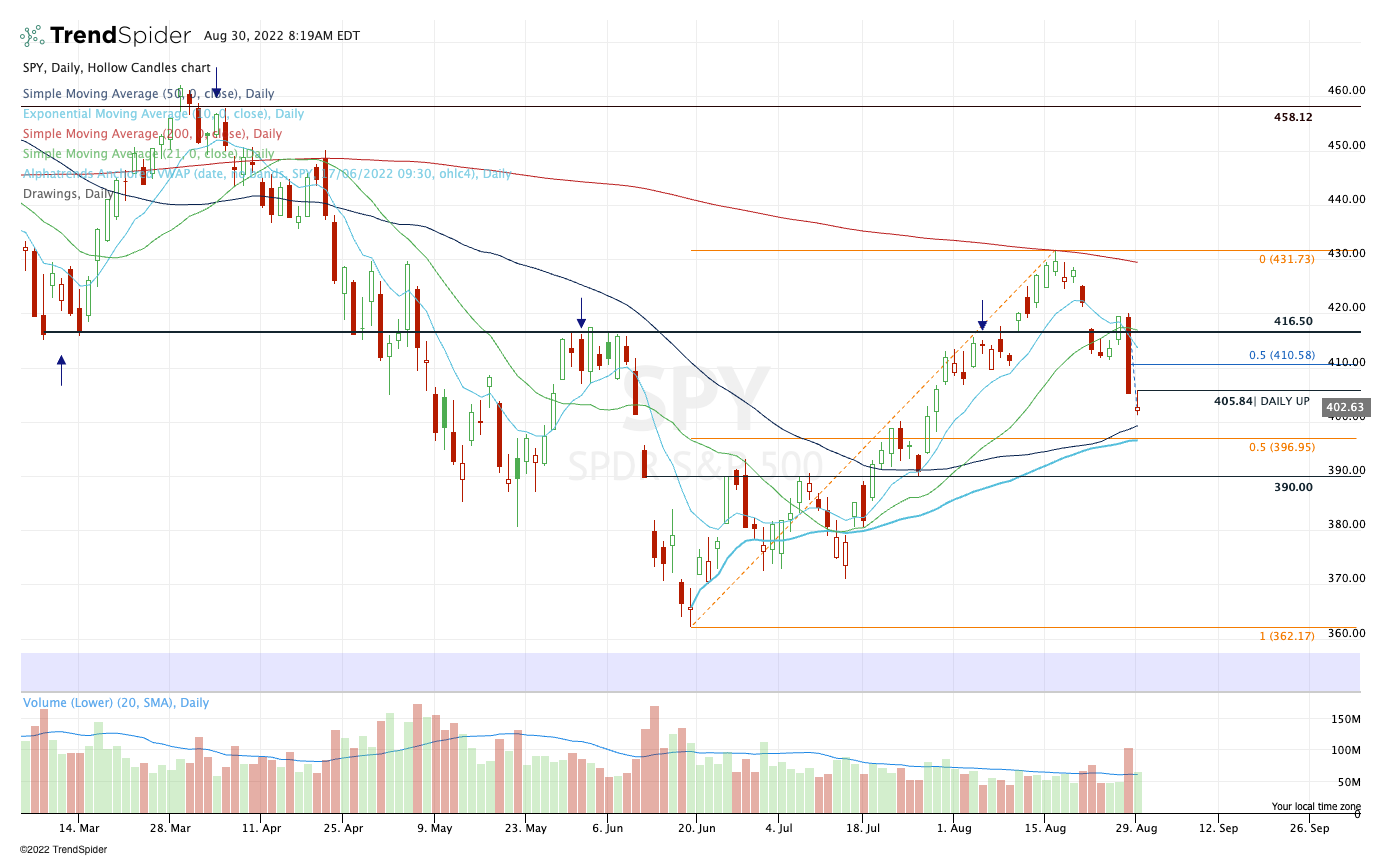
Daily-up spot is $405.84. If the SPY can clear that and not reverse it could open the door up to the $410 area.
A rally toward yesterday’s high and a fade leaves the SPY susceptible to more selling pressure. For active traders, they must keep that scenario in mind.
A break of yesterday’s low at $401.20 opens the door down to the 50-day moving average, then ~$390.
Nasdaq — NQ
12,610 is daily-up. If we get that, we could see 200 points in upside if the bulls really take over.
I would love to see a doji-daily-up in the NQ today and a push back up to the 12,800s.
An eventual break of 12,388 could open the door down to the 12,100 level.
QQQ

Like the others, a nice “indecision” candle on the 50-day.
I am looking for a daily-up rotation over $307.22 that holds above this level. If we get it, $310 is in play, then $312.50 which is the 50% retracement and prior support level last week.
A move below yesterday’s low of $303.28 could put $300 in play, but largely speaking, the $300 to $303 area is critical for bulls right now. Below $296.50 and this can completely unravel.
Oil — CL

If oil holds up above $90 to $92, then that’s a bullish development. If this thing breaks out over the 50-day and pushes back to $100, there are going to be some serious issues with the “inflation is dead” call, even though the CPI readings will be lagging energy prices.
For what it’s worth, nat gas prices continue to hover near the highs.
Bonds — TLT

Drifting down to the bonds, the TLT continues to migrate lower. There was a great selling opportunity on Friday as the TLT rallied into active resistance. Now we see if it can find its footings or if more pressure is underway.
Remember, we recently looked at the bonds as a warning sign for stocks.
OXY

We flagged the OXY trade last week, but it was fast and furious on that breakout over $66.
Now consolidating, let’s see if we can get an opportunity near $71-ish, where it find prior resistance and the rising 10-day moving average. (Energy stocks appear to be back in the driver’s seat…what does that mean for tech, in anything?)
CNC
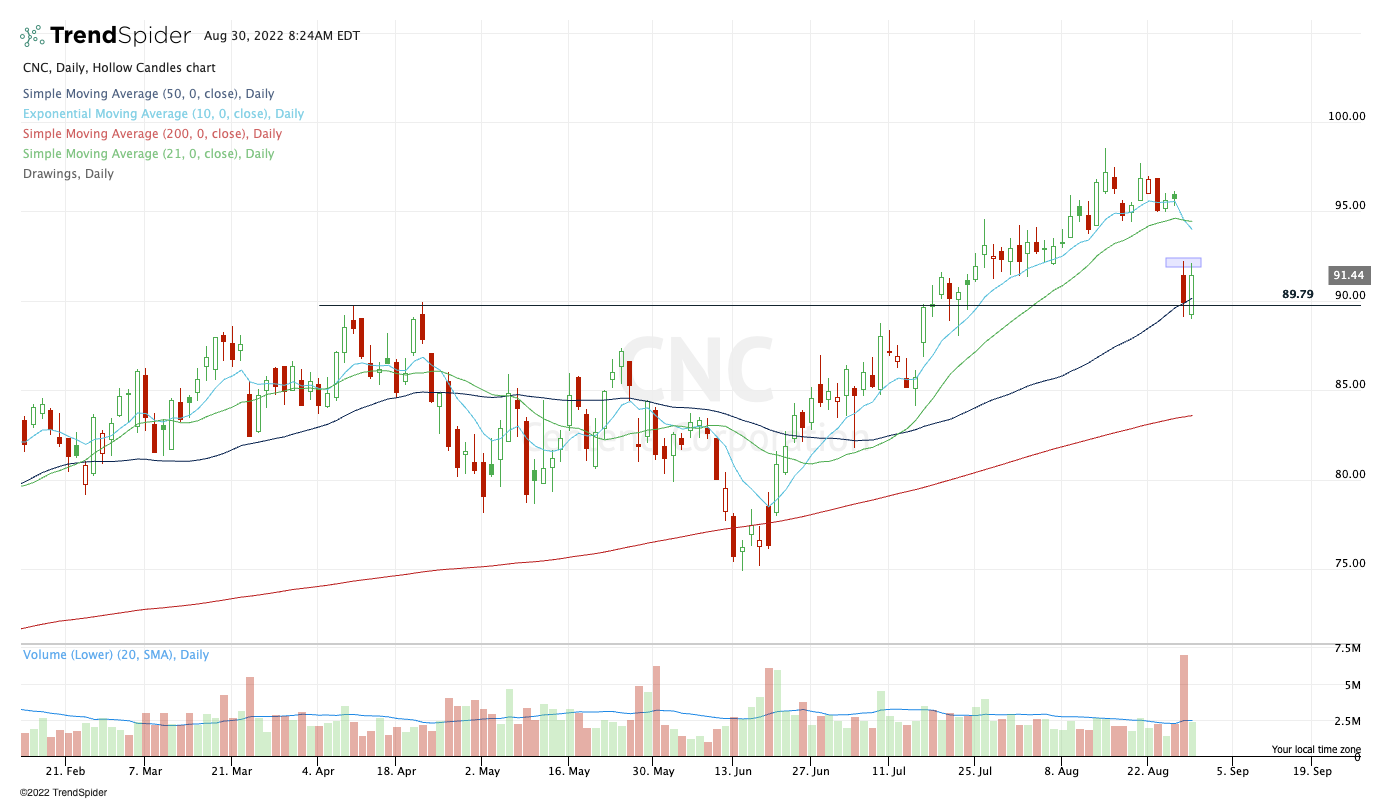
Beautiful two-day setup here. I would love an open below the two-day high of $92.20, then a push through that level.
Aggressive buyers will be at risk of a reversal, but if this one can rotate through $92-$92.20 and hold, then we could be looking at a push back up to $94 to start and potentially back into the $97s.
It’s finding support at the prior breakout level (~$90) and the 50-day. If the long setup triggers, a stop just below the two-day low is a good place to cap our risk.
Go-To Watchlist — Individual Stocks
*Feel free to build your own trades off these relative strength leaders*
- Numbered are the ones I’m watching most closely.
- Bold are the trades with recent updates.
- Italics show means the trade is closed.
For those that want to preserve their gains, feel free to exit any position below, as many are a ½ positions or less.
- UUP — Down to ¼ position as we hold for potentially higher prices. Raise stops to $28.40 to $28.50.
- CHNG — second target of $25 hit. Now down to just ⅓ position. Take all profit here or move to a B/E stop and look for $25.50.
- Still looking for $25.50 on the upside, but can be back up to a ½ position or more $24.73. $24.25 is a reasonable stop-loss for those that added.
- AR — Out ⅔ of position after hitting our second target at $44. B/E stop. Might as well look for $46.50+ for the rest.
- HRB — long from $46.75. Raise stop to $45.50. Can make a minor trim at $47.50 just to get some risk off the table, but really looking for $48.25+
Relative strength leaders (List is cleaned up and shorter!) →
Top:
- XLU
- XLE
- OXY
The Rest:
- CNC
- F
- BMRN
- APLS
- ENPH
- TAN
- FSLR
- LNG
- PWR
- CHNG
- CELH
- COST
- UNH
Economic Calendar

Comments are closed