Taking it easy ahead of earnings and after a huge day.
Follow @MrTopStep and @BretKenwell on Twitter and please share if you find our work valuable.
Don’t Forget: The Long-term performance of the S&P 500, some longer-term setups, and 5 red flags that showed up before the 2022 bear market.
Our View
Guys/gals, traders/faders —
I know we said we are going to keep this short yesterday, but it worked like a charm and we’re going to do the same thing today.
The CPI report consists of four readings and every one of them came in ahead of expectations yesterday. It all but cements the Fed’s predetermined rate-hiking plan. Going into yesterday’s report, we were ready for one of two things:
“It’s going to be an algo run regardless. Hot numbers and they’ll tank it. Cool numbers and they’ll likely rip it.”
Well, it was hot and the market tanked…but then it did something funny. It found its footing at the 3500 level (in the SPX), a zone we have been highlighting ad nauseam over the last few months. That’s been on the “big picture” write-ups and in the videos.
The SPX ripped off this zone and many traders walked away with a six-figure day. Pat yourself on the back if you were one of them! If not, take notes so you can be on the bandwagon next time.
Our Lean — Danny’s Take
Clues were piling up about today’s action. It started when the VIX was negative going into the open (and shortly after the open) despite the pounding in the ES and SPX. Then the dollar began fading.
At that point, a long S&P was the perfect trade and it was highlighted to (near) perfection in the Technical section below.
Everyone who caught a huge chunk of gains on Thursday might want to consider just taking Friday off. I try to do that whenever I hit a huge winner so it doesn’t go to my head and so I don’t give back the gains.
There’s a lesson in that, you know.
Anyway, we have a bunch of bank earnings on Friday morning: JPMorgan, Citigroup, Wells Fargo, and Morgan Stanley. If the market reacts well to this, it could be pedal to the medal and up we go.
That said, I can’t help but notice that the SPX and ES are stalling right near ~3700 and the declining 10-day ema/21-day SMA.
Our Lean: I would love a little back-and-fill to work off some of today’s reversal, but holding a bulk of the gains will be key as earnings season gets underway. Watch 3660-ish, the overnight low on the downside.
On the upside, keep an eye on the 3700 level, then 3715, and lastly, 3735 to 3750. Yesterday they bought the 25- to 40-points dips. See if they do it again today.
Daily Recap
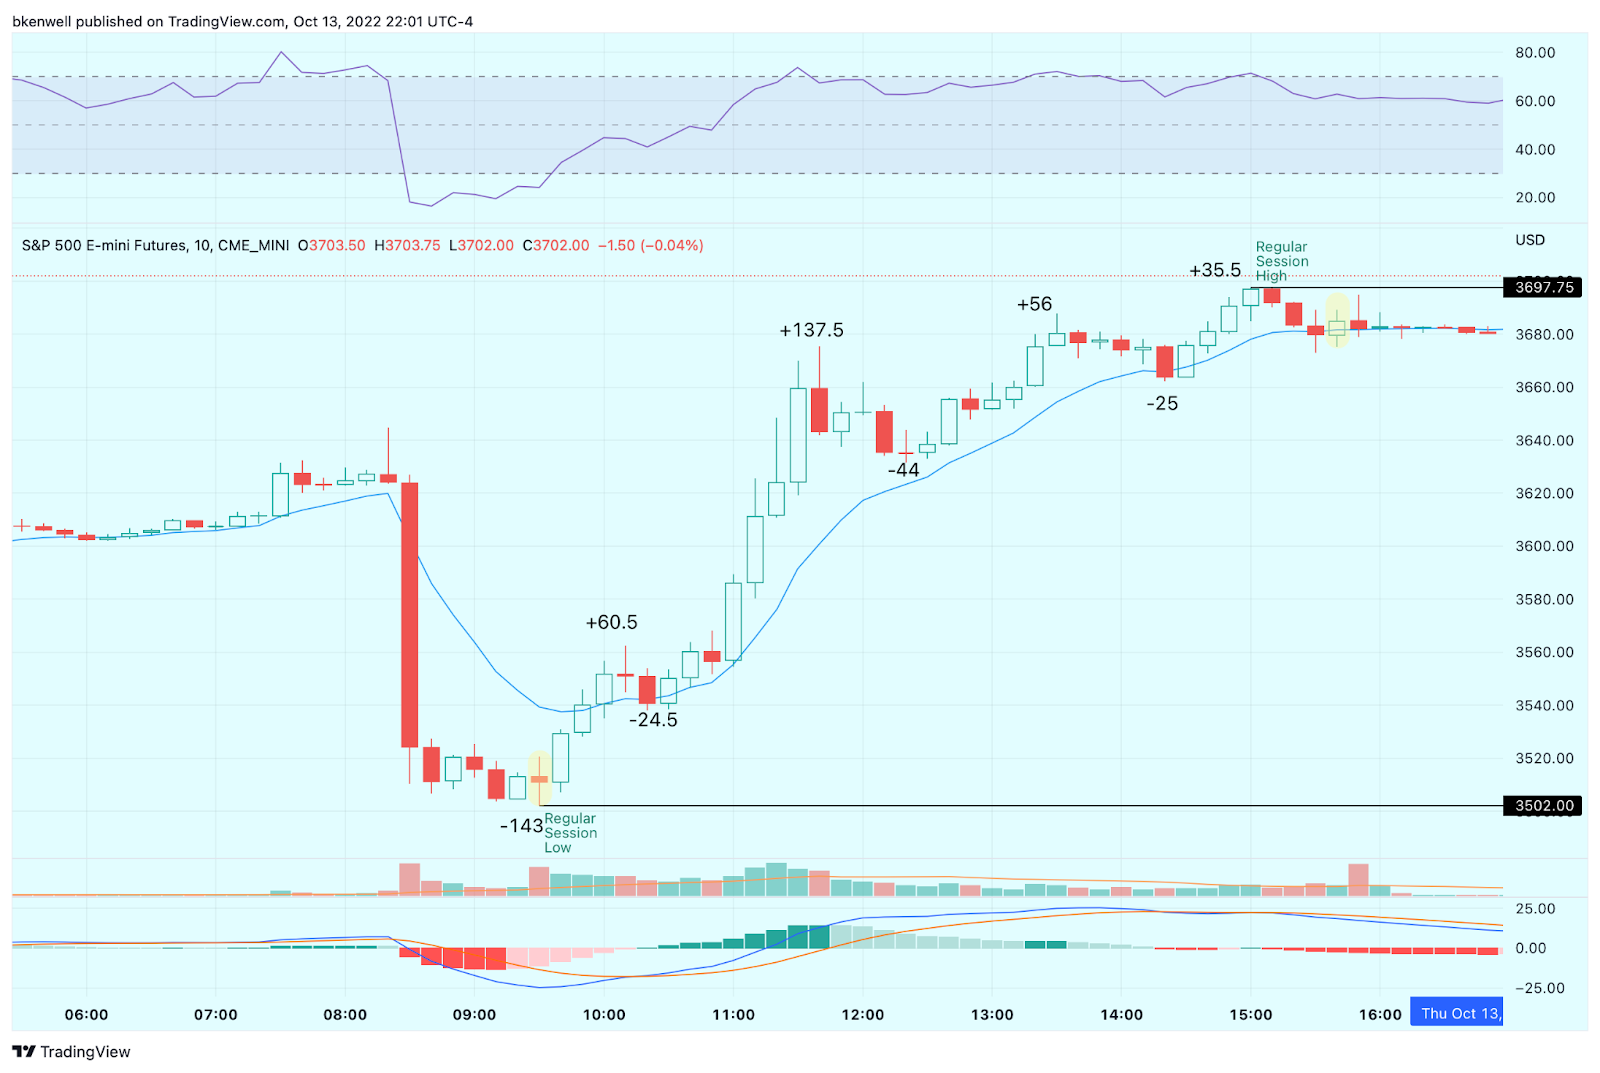
The ES came into the morning doing well, then tanked more than 140 points after the CPI reading came in hot. After that, it was a full-on reversal. Notice it bottomed into the opening minutes and quickly rallied 60 points.
Then it dipped 24.5 points into 10:30, before ripping off a 137.5-point rally. This day was absolutely nuts. It was a 95% downside day at the open that turned into an 80% upside day. Despite the massive upside move, the dips were still deep, as the ES pulled back 44 points just after noon.
From there, it rallied another 56 handles, dipped 25 points, and rallied 35.50 points into 3:00. The ES traded ~3685 at 3:50 after the MIM revealed $244 to buy. The ES settled at 3680.25 at the 5:00 futures close, up 93 points or 2.6% on the day and up ~180 points off the low or more than 5%.
In the end, it was one big bull reversal. In terms of the ES’s overall tone, it was robustly bullish — a freight train to the upside. In terms of the ES’s overall trade, volume was heavy at 3.2 million contracts — the third-highest volume day of 2022.
Technical Edge
- NYSE Breadth: 79.5% Upside Volume (but was 93% downside at open)
- Advance/Decline: 70% Advance (was 95% decline at the open)
- VIX: ~$32
Game Plan: S&P
Working from the top down with the S&P (Weekly, daily, intraday timeframes) with a trade on the ES and SPY/SPX at the bottom of each in bold.
Cheers.
S&P 500 — ES (Bigger Picture)

Here is the “bigger picture” look with the weekly chart, where the ES traded down and tagged the 50% retracement and the post-Covid breakout near 3500 after a five-wave “ABCDE” decline.
That was an excellent move, but despite how good it was, notice how we’re not exactly out of the woods just yet on the daily chart:

Notice yesterday’s hesitancy at the 10-day ema and the overnight rejection from the 21-day.
Thursday’s reversal was robust on heavy volume (the third most daily volume of the year!) and came at a key time and place. That said, the S&P needs to stay strong going into earnings if bulls want to mark this as the low.
On the 4H charts, notice how the ES has struggled with 7% to 8% rallies since the mid-August high. Will it finally break the trend or are we in for another knee-capping?

ES — The Trade

The ES has wobbled a bit in the overnight session. I’m approaching Friday morning in a very “I don’t have to trade” type of way given yesterday’s move.
However, if it trades down to the 3660 area again — the overnight low — then I would love to see a mild undercut of this level and tag of the rising 10-day ema, followed by a bounce. Ideally, it would come on or shortly after the open.
Whether that bounce is 10 points or 40 points — or if it bounces at all — we won’t know. But it’s the setup I am watching today.
On the upside, Let’s see if the ES can clear and hold above the overnight high near 3715. Above that puts a major prior support area in play between 3735 and 3755.
Quick Look at the S&P 500 (SPX/ SPY)

For those of you that prefer the SPX or SPY over the /ES, that’s just fine. I’ll do a quick look here as well. Look at all the support that came into play around $350 and I’m so glad to finally see this level tested.
Now we must see how it responds.
As good as yesterday was, we are still below all of the active trends and need to keep that in mind.

If the SPY pushes higher, it faces a key area in the $370 to $373 area. That’s due to the 21-day and prior support turned resistance.
So what am I watching?
The Trade — SPY / SPX

$364-ish was solid resistance in the morning for the SPY, then support in the afternoon. It lines up with the 10-ema on the 30-minute chart as well. The 30-minute is one of my favorite timeframes, FWIW.
If the SPY or SPX dips and doesn’t find support here, the 10-ema on the H1 chart comes into play in a very key support/resistance area from the last few days ($361.50 to $363).
If we get a dip to the $364-ish area/10-ema on the 30-minute chart, I’m likely a buyer of some same-day calls. I don’t like saying that, because I don’t want anyone following it and getting burned. The reality is, these same-day calls can GO TO ZERO. So size it like a Lotto trade and know the risk going into it, IF you decide to.
(I tend to keep a stop-loss of 50% to 60% on these trades, but again, I must emphasize the risk that comes with options if you do not trade them regularly). There is nothing wrong with common stock.
Go-To Watchlist
*Feel free to build your own trades off these relative strength leaders*
- Numbered are the ones I’m watching most closely.
- Bold are the trades with recent updates.
- Italics show means the trade is closed.
Notes:
- FSLR — Not great price action yesterday, but closed well. We’ve got one trim already. If you’re still in (or just got in), Thursday’s low is a good stop (unless you are still going with a B/E stop, then that’s fine too.
- I am trimming again in the low $130s if I see it down to a ½ position.
- XLE — Inside-and-up day played out magnificently.
- Anything above $82 is a reasonable area for a second trim to get down to ½ or even ⅓ a position. $87 to $87.50 could be next up as we go monthly-up
Relative strength leaders →
Top:
- LNG — nearing the breakout near $150
- MCK — Stopped earlier but still holding the breakout near $340
- CAH — Just Robust
- LPLA
- CCRN
- FLSR
- ALB
- VRTX
- CYTK
Economic Calendar

Comments are closed