How dependable of a low do we have?
Follow @MrTopStep and @BretKenwell on Twitter and please share if you find our work valuable.
Don’t Forget: The Long-term performance of the S&P 500, some longer-term setups, and 5 red flags that showed up before the 2022 bear market.
Our View
The negatives have been piling and you know the obvious: Mortgage rates are at 7.25%, two more rate hikes are on the way this year, inflation is still pushing higher despite a tightening Fed, and a recession is looming.
It’s all added up to the stock market’s worst performance since 1969. None of this is new news — even to the casual investor watching their 401k swirl down the drain.
Like it or not, the US is heading into a recession — it’s not a question of “if” but more realistically “when.” Economists are estimating sometime in the next 12 months, while more specific estimates are calling for Q2 2023.
I believe we are in the midst of a bear market rally and the question then becomes — if that’s the case — how far can the S&P go from here?
From Sunday’s Globex low to Tuesday’s 9:30 ET open, the ES futures were up 183 points. All of the buying power was used up and when the regular-hours session came along, the S&P couldn’t maintain momentum. A late-day bid saved the index, but it wasn’t without some concern.
One of the best trades in a bear market — especially after a big rally — is selling those gaps.
It’s 9:00 pm ET as I write this and the ES is up 32 points. I can’t deny the markets look higher, but I am not going to forget about all the dead-cat bounces we have seen this year.
Our Lean — Danny’s Take
Given how offside so many traders are and how poor sentiment is, it wouldn’t take much to ignite a massive bear-market rally. Throw in the corporate buybacks and it may only add fuel to the fire.
Did you know that same-day options expirations make up 45% of the volume now that SPX options expire daily? Further, 57% of options volume expire in two days or less. There are constant “lotto” players in the market.
I have always known that the options market is the tail that wags the dog, but the one-day options are definitely a big addition to the already volatile markets. Especially now that SPX options expire daily instead of Monday, Wednesday, and Friday.
I’m not going to start projecting how far the ES can rally, but I call BS to the Goldman Sachs story about $5B in buying every day until the end of the year. I don’t doubt there’s money to put to work, but that doesn’t mean the algos won’t sell right into it.
Our lean is, despite the bearish nature of this year’s market, we can’t deny the short-term trend. And while some of the bigger rallies can be sold, we will be looking to buy any 30 to 50-point pullbacks.
As the PitBull says: It’s an old song — run the sell stops and run the buy stops. In this case, the latter is plentiful on the upside.
Daily Recap

The ES traded all the way up to 3776 on Globex and opened Tuesday’s regular session at 3773. After the open, the ES rallied up to 3777.25, and then sold off down to 3732 at 10:40. After the low, the ES bounced up to the 3748 level and then dropped down to a new low at 3697.25 at 11:38, 80 points off the high.
The ES then rallied up to 3736.75 at 12:56, sold off down to a higher low at 3713.75 at 1:05, and then rallied up to 3746.50 at 1:56, up 33 points. After the push, the ES dropped down to 3703.25 after a headline hit saying Apple was cutting back iPhone production.
The ES traded back up to 3718.50 at 3:25 and the MIM showed ‘small to buy’ and then traded up to 3732.50 at 3:45. The ES traded up to 3735.50 as the 3:50 cash imbalance showed $750 million to buy and traded ~3745 on the 4:00 cash close before settling at 3758 on the 5:00 futures close, up 68.75 points or +1.68% on the day.
In the end, the ES sold off 80 points from its high and rallied 62 points off the low. In terms of the ES’s overall tone, it had to shake out the weak longs and then shake out the shorts. In terms of the ES’s overall trade, volume was on the high side at 2.7 million contracts traded.
Technical Edge
- NYSE Breadth: 84% Upside Volume
- Advance/Decline: 74% Advance
- VIX: ~$30.50
I am looking for some individual trades, but the rapidness of this rally combined with a lack of exceptional upside breadth AND an elevated VIX make this a tough environment to trust individual stocks. I am sorry that that is the case, but we can only trade what’s in front of us!
Until then it’s paramount to focus on the indices, sectors, bonds and the dollar.
Game Plan: S&P 500, Nasdaq, Bonds & The Dollar
General strength in the dollar and weakness in bonds remains a concern for stocks.
We pointed out this oddity in yesterday’s newsletter and, alongside the “tough to handle” 80-point gap-up, the S&P sold off right out of the gate before an afternoon bid shored up prices.
Admittedly, I wasn’t coming into the session shorting on tilt, but the setup was there to push the index lower. Looking at it now, it does continue to shake off a lot of bad news, like the CPI report and the recent news from Apple.
The banks reacted well to earnings and now NFLX is +14% in after-hours trading. So there are a few things for the bulls to hang their hats on.
Further, I’d rather come into the day under a bit of pressure than gapping up.
S&P 500 — ES

Above shows the daily on the left and the weekly on the right. For those looking at a “bigger picture” setup, keep these levels in mind.
If the bulls maintain upside momentum, 3800 to 3820 is the first zone to know. It’s resistance from early October and the declining 10-week moving average.
Above that opens the door to 3900 to 3925. That’s the 21-week and 50-day moving averages, 50% retracement, and a key pivot level.
On the downside, bulls need 3680 to 3700 to hold as support. Below puts 3640 or lower on tap.
Possible Trade: Watch yesterday’s low at ~3697. This comes into play in a key area and if we open above this level, I’m looking for a downside break of this level and a quick reclaim. If we get it, it could put a reversal in play, even if only for 10+ points.
Remember, all we need is one good trade a day!
S&P 500 — SPY

Yesterday’s “be weary” call played out nicely on the higher open, although the bulls stepped in and bid the SPY higher in the afternoon.
I’m willing (and would be happy) to be wrong, but to me I just don’t feel confident enough to call a “bottom.” That said, it doesn’t mean this can’t go higher.
For the SPY, keep a close eye on the $375 to $379 zone, as well as the 10-week moving average. Above this zone and $390 could be on tap in a hurry.
On the downside, $365 to $368 needs to hold as support for bulls to maintain control.

On the hourly chart of the SPY, let’s see which fails first: The 10-ema or the 200-SMA. Both may be reactionary on another test.
Nasdaq — NQ

On the plus side, the NQ is above active resistance, which has been the 21-day SMA.
However, it’s just a sneeze away from dipping back below the 200-week SMA. Further, it’s coming into a very strong prior support zone and the 10-week moving average.
Generally speaking, that has me somewhat cautious (and as you can tell by the chart above, this was written Tuesday evening and “caution” is being priced in this morning).
Tech especially needs more cooperation out of bonds and it’s not getting it.
On the downside, again keep an eye on yesterday’s low of ~11,081.
The Trade: An open above, break below, and reclaim of this level could give us a low-risk reversal trade. Obviously, if it breaks badly, we don’t want a huge risk level. I like sub-15 points on the NQ as my reversal risk.
Nasdaq — QQQ

The previous ~6% rallies quickly ran out of steam. Up 8.75% from the recent low, skeptics are starting to wonder if the QQQ is about to lose steam.
Set to gap lower now, keep a close eye on the June low near $269.25. If we trade near this level/near yesterday’s low, it could give us a cash flow long to work with.
Otherwise, though, I am being careful of a break-and-fade of this level, as it will mean we lose the 21-day and 10-day moving averages as well.
The $269 to $270 area is an active zone bulls must maintain if they want to keep control of momentum. On the upside, $280 to $283 is resistance.
Bonds — TLT

The TLT has been a trainwreck for months now, as it got below the 10-day ema and has stayed below it, with each rally to this area failing.
It made new lows yesterday despite the rally in stocks. Now it’s down 1%+ in pre-market trading and near yesterday’s low. If the lows hold and bonds rally, stocks can continue higher.
If not, equities will face a major test.
Dollar — UUP

Make or break time for the dollar.
Gapping higher on the day, the UUP will look to fill the gap at $30.31. If it fills it and continues higher, stocks will struggle.
If it fills and it’s a “job well done,” then the dollar may fade a bit and help boost equities.
Keep an eye on $30.30 and $30.
Over $30.30 is bullish for the dollar. Under $30 is bearish and could open the door down to the $29.50 to $29.75 area (50-day & 10-week ema).
Go-To Watchlist
*Feel free to build your own trades off these relative strength leaders*
- Numbered are the ones I’m watching most closely.
- Bold are the trades with recent updates.
- Italics show means the trade is closed.
Notes:
- XLE — Down to ⅓ to ½ now. $87 to $87.50 could be next up as we go monthly-up. B/E stop now. (Really nice action here despite dip in energy prices).
Relative strength leaders →
Top:
- LNG — nearing the breakout near $150
- MCK — Stopped earlier but still holding the breakout near $340
- CAH
- LPLA
- CCRN
- FSLR
- REGN
- ALB
- VRTX
- CYTK
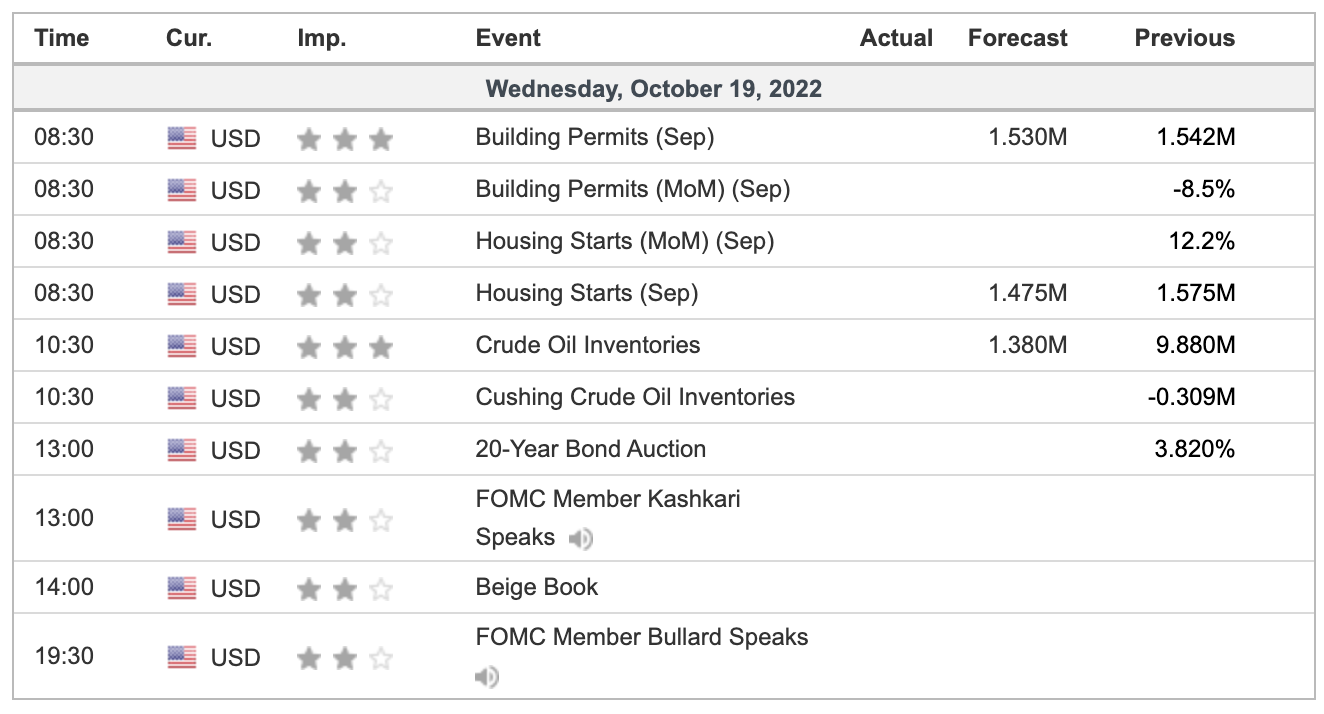
Economic Calendar
Comments are closed