Apple is the only mega-cap tech stock not tanking on earnings.
Follow @MrTopStep and @BretKenwell on Twitter and please share if you find our work valuable.
Don’t Forget: The Long-term performance of the S&P 500, some longer-term setups, and 5 red flags that showed up before the 2022 bear market.
Our View
Big tech is whiffing pretty hard right now. AMZN fell 20% at one point in after-hours trading, but the stock stemmed its bleeding and ended the after-hours session lower by “just” 12.7%. AAPL fell 6% or so at one point, but finished higher by 0.4%.
We’ll see how they handle the 9:30 open — it will probably be a make-or-break session for the Nasdaq, as it teeters on support.
Big Tech was 0-for-5 heading into Apple’s print (which is usually released around 4:30 pm ET). That’s as TSLA, GOOGL, MSFT, META, and AMZN all disappointed investors. Apple appeared to do the same before it bounced after the conference call.
However, despite the weakness in Big Tech, the stock market is seemingly shrugging its shoulders. Maybe it’s month-end buying that’s masking the pain, but even the bears have to admit, the action is impressive.
The S&P is holding up okay, but the Nasdaq looks vulnerable. As for bonds, well, consider this:
“US Treasuries annualizing 23% loss YTD, worst since 1788 & 2nd straight annual loss; last time 2 straight years of UST losses…1958-59, last time >5% UST loss followed by -ve return…1861; last time 3 straight years of US government bond Treasuries…never; 250 years of history say US Treasury returns up in 2023.”
Our Lean — Danny’s Take
The only thing I can say is, everyone has been trying to be long and with a few exceptions of a few rips, all the rallies have failed. Everyone has kept trying to buy the ES all week and it’s now down ~100 points from this week’s high.
Is today the day that bulls regain full control? Maybe, but I doubt it — unless AAPL ramps and AMZN reverses higher.
One good takeaway is this, from a friend of mine:
“For Friday, the 3888.00 speed-line can contain buying through November activity, and below which 3680.00 is likely by the end of next week, 3451.00 within 2-3 weeks. On the other hand, a settlement today above 3888.00 would indicate a good annual low, 4347.50 then considered a realistic 2-3 month upside objective. Downside Friday, 3763.50 can contain session weakness, while breaking/opening below 3763.50 allows 3680.00 intraday, able to contain selling through next week and the point to settle below for yielding 3451.00 within over the same time horizon, possibly yielding 3350.75 long-term support by the end of November.”
Our Lean: We’re approaching month-end, bonds are falling and the dollar is rallying. I think we can get an opening rally, but it’s a rally I’m looking to sell. 3820 was acting as support, then failed late yesterday. See how the ES handles this level (and more broadly, the 3815 to 3825 zone). If it’s resistance, 3775 remains in play, followed by Thursday’s low at ~3757.
Above 3827 and ~3850 is in play.
Daily Recap

I generally do not make a lot of comments in the ES recap — just the rips and dips and prices — but I want to reiterate that “these are not our father’s markets or charts,” nor will they ever be. The sheer number of handles or points the ES traded after the day session opens is astonishing. There is no 3820.25 bid, offered at 3820.50, and nor is there a 3830.50 bid, offered at 3831.50, everything is multi-point clips and done so in a flash. If you are wrong at the level you are buying or selling at, you can be out 20 or 30 points in just a few minutes if you’re not careful. Even the PitBull said, “this is too much!”
The ES traded 3850.75 on the 9:30 ET futures open, rallied a bit, and then sold off down to 3825.50, then rallied all the way up to 3870.75, and then puked down to a new daily low at 3821.50.
From there, it rallied 27 points up to 3848.25 at 1:22 and sold off down to a new low at 3820.75 at 2:12. The ES finally took out the 3820 level and hit stops down to a new low at 3815.50 at 3:11. Then it rallied up to the 3833.50 level at 3:33, up 18 handles, before trading ~3825 at 3:50 as the #MIM cash imbalance showed $877 million to buy and then sold off down to 3813.25 on the 4:00 cash close.
It tanked on AMZN’s reports but rebounded as AMZN steadied and AAPL reported at 4:30. The ES settled at 3791.50 on the 5:00 futures close, down 49.5 points or -1.29% on the day.
In the end, the tech earnings have blown up the rally. In terms of the ES’s overall tone, with the exception of the early rally, every rally was sold. In terms of the day’s overall trade, volume was modest at 2.14 million contracts.
Technical Edge
- NYSE Breadth: 52% Upside Volume
- Advance/Decline: 55% Advance
- VIX: ~$27.50
Two things:
- Continue to keep an eye on the US Dollar and bonds. The former has a potential long setup and the latter is nearing resistance (again). Now if bonds continue to push higher and the dollar fails to hold support, the S&P can have more fuel to the upside.
- Please look at the relative strength list below, as energy and healthcare names continue to propagate at new multi-month or 52-week highs. They are showing the most strength right now and remain the best stocks to build setups off of, IMO.
S&P 500 — ES

A bit of a mixed bag right now as the ES continues to put in a series of higher lows and is holding trend support via the 10-day ema.
That said, keep an eye on 3815 to 3825 — that’s the 50% to 61.8% retracement zone and includes the key 3820 pivot.
Above that opens the door to the 50-day moving average near 3850.
If ~3820 is resistance, the Globex low remains in play near 3775. Below 3775 and yesterday’s after-hours low of 3757 is on the table.
S&P 500 — SPY

Right now, we are getting a pretty clean rejection from the 50-day moving average. If we get a continued pullback, it’s still a pretty healthy setup depending on where and if support shows up.
- The first area I’m watching is $375. That’s the 50% retracement of the recent range and the 10-day ema.
- Second area is the 50% retrace of the range from yesterday’s high to the 52-week low. It comes into play near the 21-day — around $368.
So simply put, I want to see if ~$375 holds as support. If not, I’ll be watching ~$368.
Those short from yesterday can use a break-even stop and have hopefully scaled out of some.
Nasdaq — NQ

10,890 to 10,935 has been critical support.
Longs need to defend this level. A break is bearish unless reclaimed.
On the upside, longs want to reclaim 11,225 to 11,275 (which is Thursday’s close, along with the 10-day and 21-day moving averages).
Nasdaq — QQQ
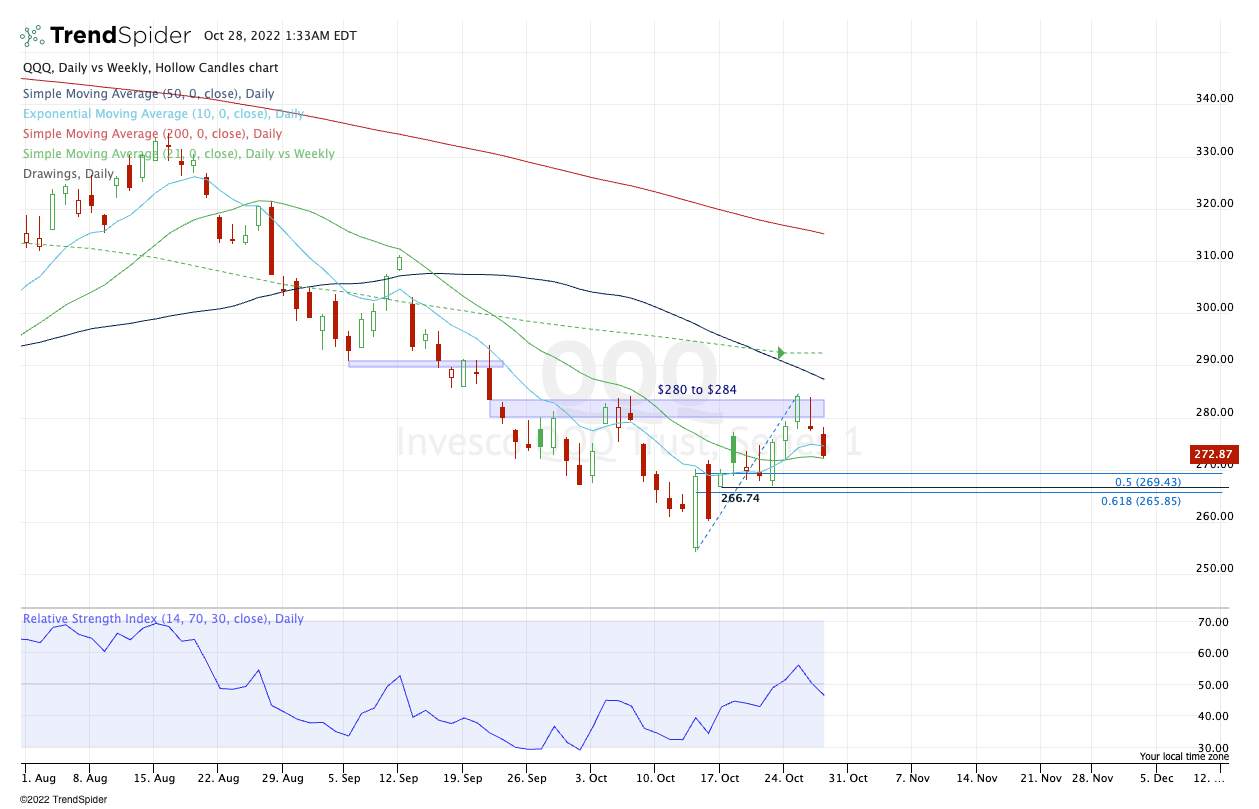
Keep a close eye on $266 to $269. This zone was key support last week. If the pressures of Big Tech breaks this area, then $260 or lower could be in play.
Oil — CL

We haven’t talked about oil in a while, but it’s been trading much better lately and we’ve noticed that with our nice win in the XLE.
Remember, oil can be tracked in the futures via /CL and /QM or via an ETF like USO.
On the chart above, notice how CL put in a higher high (the purple circles) and a higher low (the green circles). This is constructive price action.
Now I’m wondering if we get a dip into the $86.50 area, where we would get a test of the 10-day, 21-day and 50-day moving averages. From there, a move back into the $89 to $90 region would warrant a trim, followed by $93 to $94.
Now this instrument is no joke and should not be traded by a novice. The risk could be fairly tight, especially if the $86.50s hold as support. Or it could be incredibly loose, like watching for a break of $81. Size accordingly or stay out.
Go-To Watchlist
*Feel free to build your own trades off these relative strength leaders*
- Numbered are the ones I’m watching most closely.
- Bold are the trades with recent updates.
- Italics show means the trade is closed.
Open Positions
- XLE — Took the last rung of the latter into the $90+ zone. Trade closed unless you want to leave a runner.
- GIS — Would love to trim on any new a — even if just ¼.
- UUP — Pretty defined risk now with a two-day low of $29.48. Can use $29.40 as a stop if you want to play it tight.
- Conservative bulls can trim at $29.80 (the first gap-fill) or wait for ~$30 to trim. Up to you.
Relative strength leaders →
Top Picks (these have been Robust lately):
- LNG
- MCK
- CAH
- CI
- CCRN
- GIS — Weekly-up
- LPLA
- REGN
- ENPH — it’s back on the list.
- VRTX
- UNH
- MRK, AMGN
- XLE — XOM, CVX, COP, BP, EOG, PXD
- TJX
- NOC
Economic Calendar

Comments are closed