Our View
The next big shoe to drop will be the housing market. I remember back in late 2007, a friend of mine that owned a mortgage and appraisal company told me, “there was no way all the people taking out loans would survive.” By September 2008, the average U.S. housing prices had declined by over 20% from their mid-2006 peak. This major decline in house prices meant that many borrowers had zero or mostly negative equity in their homes.
My friend’s company went out of business, but he rebuilt it in 2012 and had 180 employees coming into 2020. Now he is scrambling to survive again as higher mortgage rates and overpriced homes become less attainable. For a long time I thought Florida and some other parts of the country may survive better in a downturn, but now I think it may be better to hold as much cash as you can.
What changed my mind? Last week when I saw 5 homes for sale on a small block of just 10 homes. As several of the big lenders start the process of cutting staff, the burning question is the same as everything else right now: How bad is this going to get?

Our Lean
For the last week, just about everyone I know thinks the stock market is going to rally. For me this is much more simple:
If it does rally, I’m selling it.
If you look at the past two weeks, there were almost daily reversals — the bulls are trying. If the buyers could get 3 or 4 consecutive up days, I would say the bulls have something going. Maybe some month-end buying will come, but that’s not until next Tuesday.
The Stock Trader’s Almanac Wednesday and Thursday stats are a tad better, but volume is often diminished and trading uninspired. Thursday posts the best numbers across the board, led by the Russell, up 16 of the last 22 occasions with an average gain of 0.41%, followed by the Nasdaq, up 14 of 22 with an average gain of 0.15%.
Trading really quiets down on Friday, as it’s a “getaway day” ahead of the three-day weekend.
Our lean: Volume is going to drop and when that happens it should favor the upside. You can sell the early rallies and buy the 30- to 50-point pullbacks or just be patient and buy the pullbacks. If the ES gets above 4000 and holds, I think we see 4040 to 4060 and above there 4100 to 4120 as an extreme. On the downside, watch the 3930 to 3915 zone, then 3890 and 3875.
We already saw a drop in volume yesterday. I expect it to decrease going into the end of the week. Be smart, trade less and pick your spots better. It looks like we could be on track for the first up-week in 8 weeks.
Daily Recap
The ES traded opened Wednesday’s regular session at 3925.25. It down-ticked to 3921.50 and rallied 35 points up to 3956 at 9:45 then dipped almost 20 points down to ~3838 at 10:06.
After the low, the ES rallied 41 points up to 3977.50 at 10:40 and then gave up those gains — and a bit more — going into 12:30. The ES shot up 20 points to 3968 just after the Fed Minutes were released at 2:00 and dropped 40 points down to 3928.50 — all within less than 10 minutes.
It kickstarted something big though, with the ES rallying ~70 points to 3997.75 at 3:10, before fading 18.50 points to 3979 at 3:50. The cash imbalance showed $1.6 billion to sell and the ES initially fell 12 points, but then rebounded and closed where it started 10 minutes before that: at 3979. It settled at 3970 on the 5:00 futures close, up 29.5 points or +0.80% on the day.
In the end, what did the Fed actually have to say that we didn’t already know? In terms of the ES’s overall tone, it acted firm but not overly. In terms of the ES’s overall trade, volume was low at 1.69 million contracts traded.
- Daily Range: 84.25 points
- H: 3997.75
- L: 3913.50
Technical Edge
Technical Edge —
- NYSE Breadth: 83.3% Upside Volume (!)
- NASDAQ Breadth: 79% Upside Volume
- VIX: ~$28
We are not getting the sharp V-bottom response and I don’t think we will. We have been conditioned to those responses over the years when the Fed was accommodative. Now it’s hawkish, so this is more likely to be a traditional low, IMO.
The S&P has had every reason to sell off over the last few days (poor data, etc.) and it hasn’t. It’s down 7 weeks in a row trying to avoid an eighth. Remember how that has played out over time.
Game Plan — S&P (ES and SPY), Nasdaq (NQ and QQQ), Bonds, Dollar
Despite the elevated VIX, a handful of non-energy stocks are showing some nice setups. DLTR is the latest to rip higher off our list of relative strength stocks. Be sure to check it out!
S&P 500 — ES
You all are so well-versed in the ES levels you could probably write this part yourself.
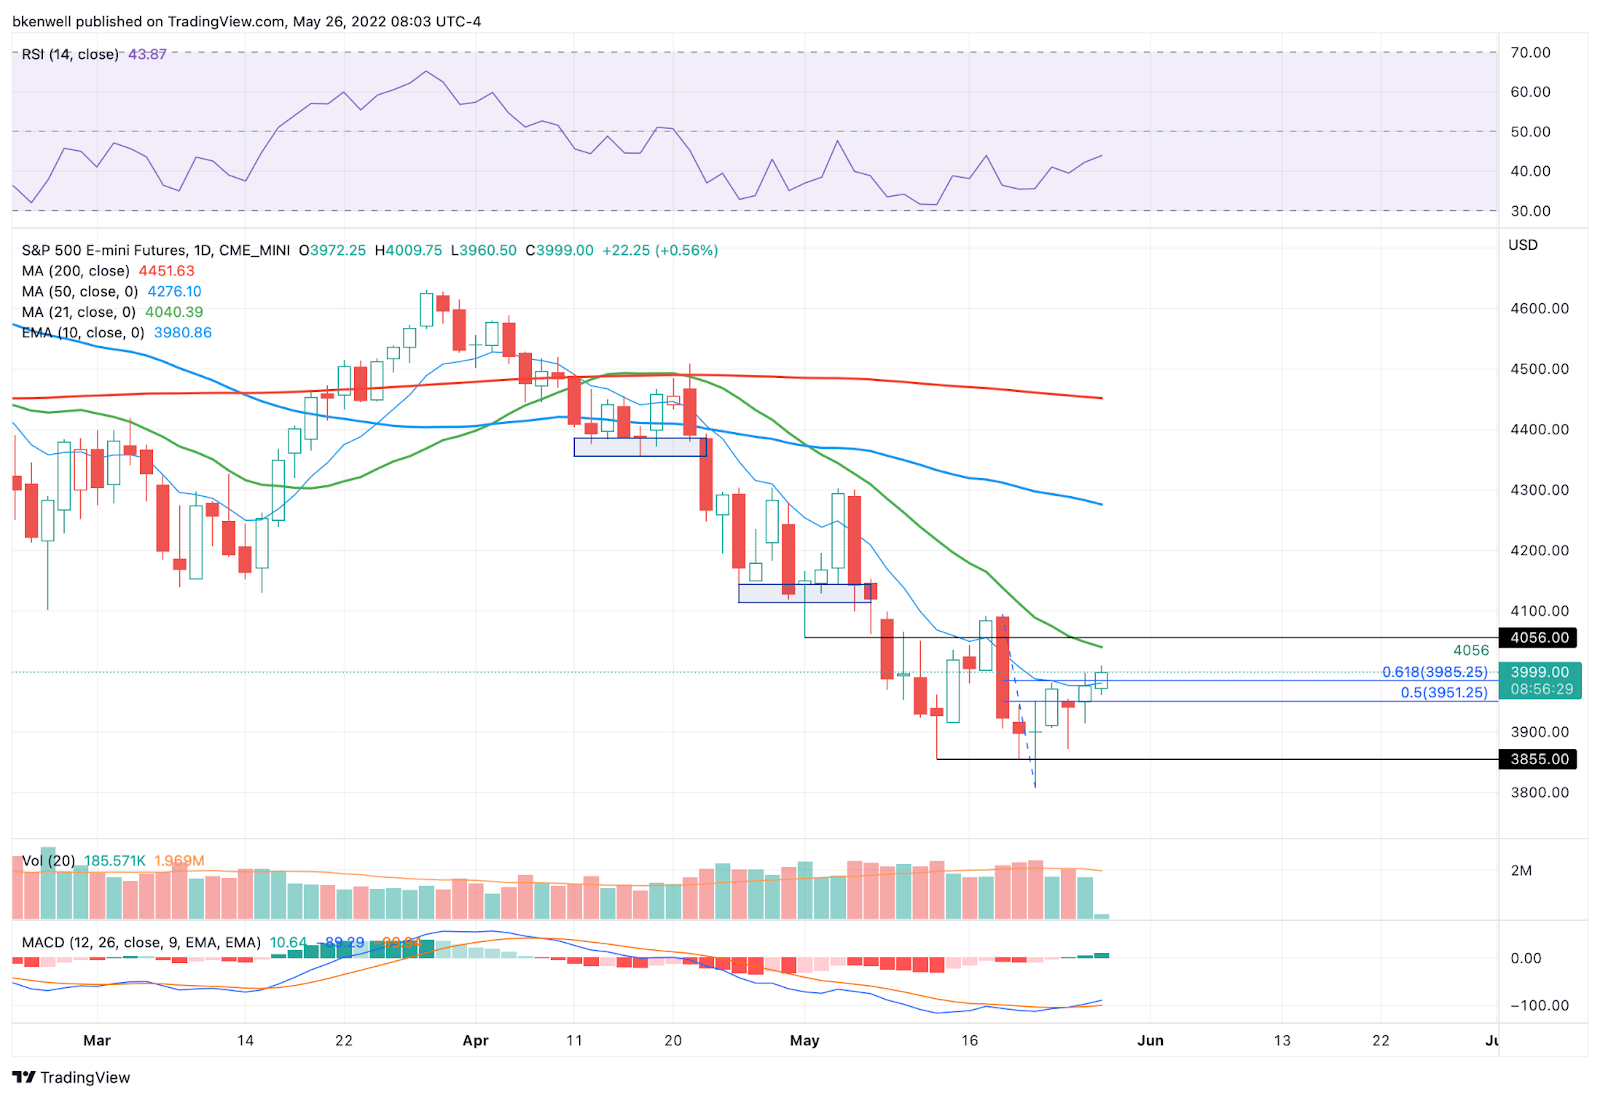
Now clearing 4,000 during Globex, holding above this level — and thus the 61.8% and yesterday’s high — is vital for the bulls. It puts 4056 and the 21-day moving average in play. Above that gives us last week’s high at 4095.
On the downside, I’d love to hold the key 3950 area as support if we can’t hold 4000 or 3985. Below 3950 puts 3815 in play — yesterday’s low.
What the bulls don’t want is to puke up all of its gains a day after the Fed, like it did earlier this month.
SPY

Again, it’s pretty simple: Clear and hold above Wednesday’s high and the $400 level gets us to the key $405 level and the 21-day. Above that puts last week’s high near $408.50 in play.
On the downside, a drop back below $397.25 could put the SPY on a slippery slope. Below $394.50 and Wednesday’s low is back in play.
Nasdaq — QQQ

The Qs really need a close above the 10-day. Above $296.50 opens the door to $300, then $305.
Tech is a more-stretched rubber band vs. the SPY or S&P, but it’s also the laggard. Just something to keep in mind.
If we take out yesterday’s low, the 2022 low is vulnerable.
MRK

MRK is off the Relative Strength List posted separately yesterday. Aggressive buyers can look to buy the dip if we see $92.50 today. Risk: $90.75
Wheat — ZW
Still waiting on yesterday’s setup. Could form an inside day today. Let’s see.
Go-To Watchlist
*Feel free to build your own trades off these relative strength leaders*
Numbered are the ones I’m watching most closely. Bold are the trades with recent updates. Italics show means the trade is closed.
We have been spanking the very select individual trades we have taken. For that, I’m super grateful! It shows that discipline wins out in a tough tape.
- XOM — this target hit “Above $92+ and feel free to trim as much as you want.”→ B/E stop on the remainder of the position ($89). $96 to $97 is a big extension area if it can really get going.
- XLE — Aggressive bulls can still look for $87 to $88. I will look to trim into this morning’s gap-up action into $86.50+
- DXY / UUP — 103.50 to 104 would be the ideal first trim area. For UUP, that’s $27.50 to $28. For UP, conservative bulls may be waiting for a gap-fill at $27.09 and a tag of the 50-day before getting long.
- ZB (bonds) — Weekly-up in play → Looking to trim 143+ on 50% of the position or more.
Relative strength leaders (List is cleaned up and shorter!) →
- XLE — Above $79.75 and bulls can stay long this name.
- AR
- DLTR
- CTVA
- VRTX
- AMGN
- MRK
- MCK
- JNJ
- BMY
Economic Calendar

As we all know, there’s no crystal ball when it comes to trading stocks, options, or futures. But the Market Imbalance Meter may be as close as it comes. Knowing how the “Big Money” is placing its bets can give our trading room a big wave to ride — or a warning sign to stay out of the water. Come check it out now, risk-free for 30 days.
Disclaimer: Charts and analysis are for discussion and education purposes only. I am not a financial advisor, do not give financial advice and am not recommending the buying or selling of any security.
Remember: Not all setups will trigger. Not all setups will be profitable. Not all setups should be taken. These are simply the setups that I have put together for years on my own and what I watch as part of my own “game plan” coming into each day. Good luck!
As we all know, there’s no crystal ball when it comes to trading stocks, options, or futures. But the Market Imbalance Meter may be as close as it comes. Knowing how the “Big Money” is placing its bets can give our trading room a big wave to ride — or a warning sign to stay out of the water. Come check it out now, risk-free for 30 days.
Comments are closed