Stocks Try for 9th Straight Weekly Gain
Volumes should remain light
Follow @MrTopStep on Twitter and please share if you find our work valuable!
Our View
Home sales ticked up from 13-year lows in November after five consecutive months of declines. Core prices, which exclude volatile food and energy costs, rose just 1.9% on a six-month annualized basis. Mortgage Bankers Association predicted mortgage rates could fall to 6.1% by the end of 2024, and 5.5% by the end of 2025.
Bitcoin is up more than 160% this year and the S&P 500 is almost up 25% in 2023. While not out of the woods yet, the Fed seems to have done a good job.
But do you think the coast is clear?
While I am happy about the prospects, I don’t think this is a one-and-done deal. The dollar index fell on Tuesday and the euro hit a four-month high and is on track to post its worst performance since 2020. We still have all the geopolitical problems too — China, Russia, North Korea, Iran, the Red Sea situation, and Gaza.
Bottom Line: What I can say is we are closing out the year with some solid economic footing and stock market returns and I expect more of the same at the beginning of the new year.
Our Lean
The S&P is now in its ninth week of gains — will it close out the week that way? I think so, but there could be some selling tied to the last trading day of 2024 (this Friday) and it’s also the last Friday options expiration of the year.
Our Lean: I don’t think we see much of a pick-up in trade and volume until Friday. Keep buying the pullbacks. We could very well see 4850 today.
For those of you who like HandelStats levels, here they are:
-
Upside: Trade and hourly close above settlement targets 4841.24. Hourly close above there targets 1 sd at 4853.46, hourly close above there targets 1 sd weekly at 4861.55. Hourly close above there targets 2 sd at 4880.92. Hourly close above there targets 3 sd at 4908.37.
-
Downside: Trade and hourly close below 4825.50 targets 4818.38, then 4811.25. Hourly close below there targets -1 sd at 4798.54. Trade below there targets 4794, then 4790. HOURLY close below there targets 4777.62, then 4774.25, then -2 sd at 4771.08. Trade and hourly close below there targets 4765, then 4763.25, hourly close below there targets 4755.51, then -3 sd at 4743.63.
MiM and Daily Recap
ES Recap
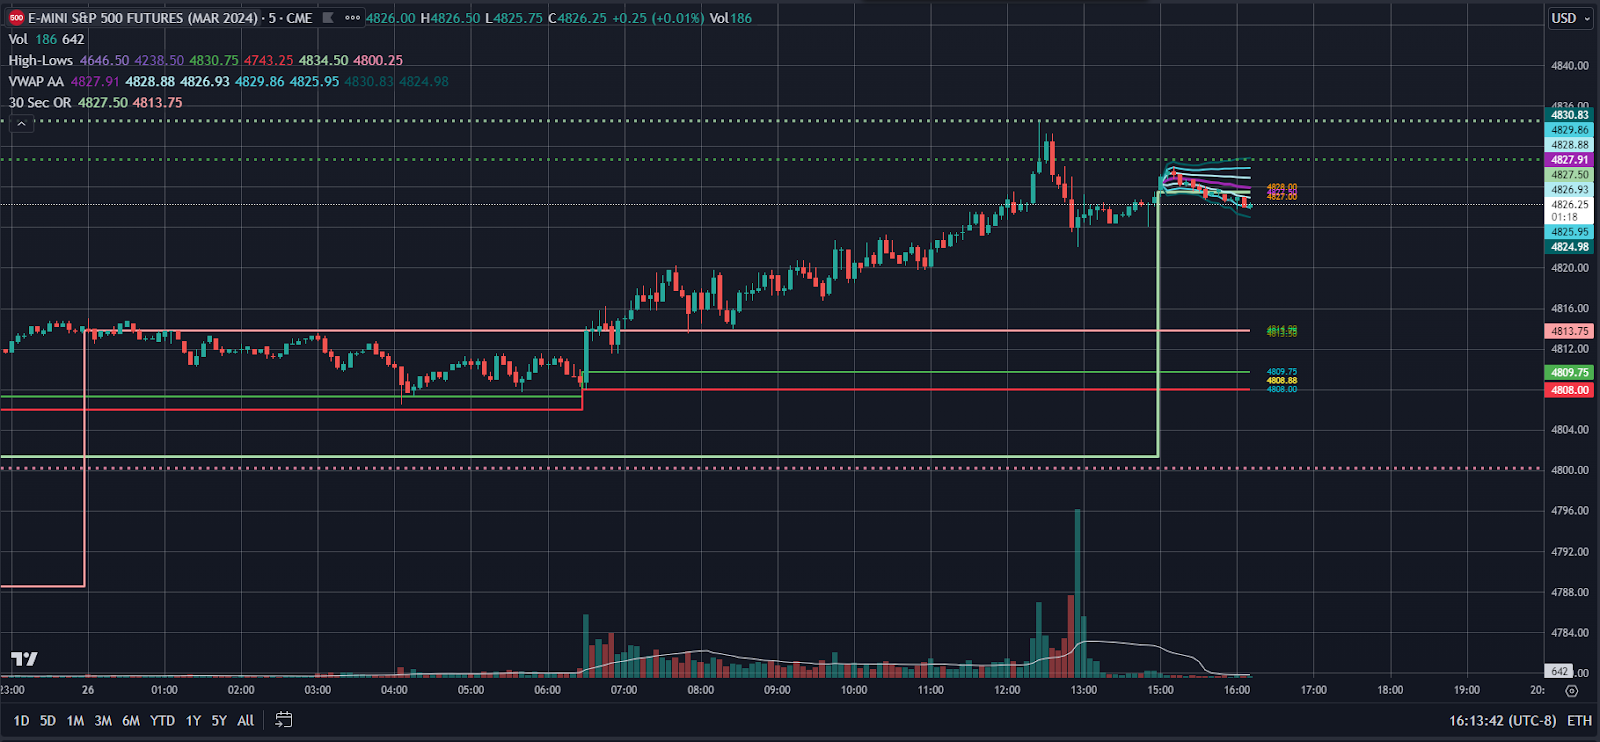
The ES rallied up to 4815.00 on Globex 4808.75. After the open, the ES traded 4808.00 and rallied up to 4819.50 at 10:27 and then made 6 new highs up to 4834.50 at 3:28 as the early NYSE imbalances showed $534 million to sell.
After the high, the ES pulled back to the 4827.50 level at 3:46 and traded 4829.50 as the final 3:50 cash imbalance showed $2.9 billion to sell. From there, the ES traded down to 4822.00 and traded 4826.50 on the 4:00 cash close. After 4:00, the ES traded in a small range and settled at 4827.00, up 21.75 points or +0.45% on the day. It’s up 24.36% YTD and touched its highest intraday level since Jan. 2022, while the Nasdaq is up 44%, its best year since 2003.
In the end, the holiday markets were all about thin to win. In terms of the ES’s overall tone, it was firm all day. In terms of the ES’s overall trade volume was low: 108k traded on Globex and 519k on the day session for a total of 627k, the lowest holiday volume as far back as I can remember.
Technical Edge
-
NYSE Breadth: 78% Upside Volume
-
Nasdaq Breadth: 86% Upside Volume (!)
-
Advance/Decline: 74% Advance
-
VIX: ~13
ES
Levels from HandelStats.com
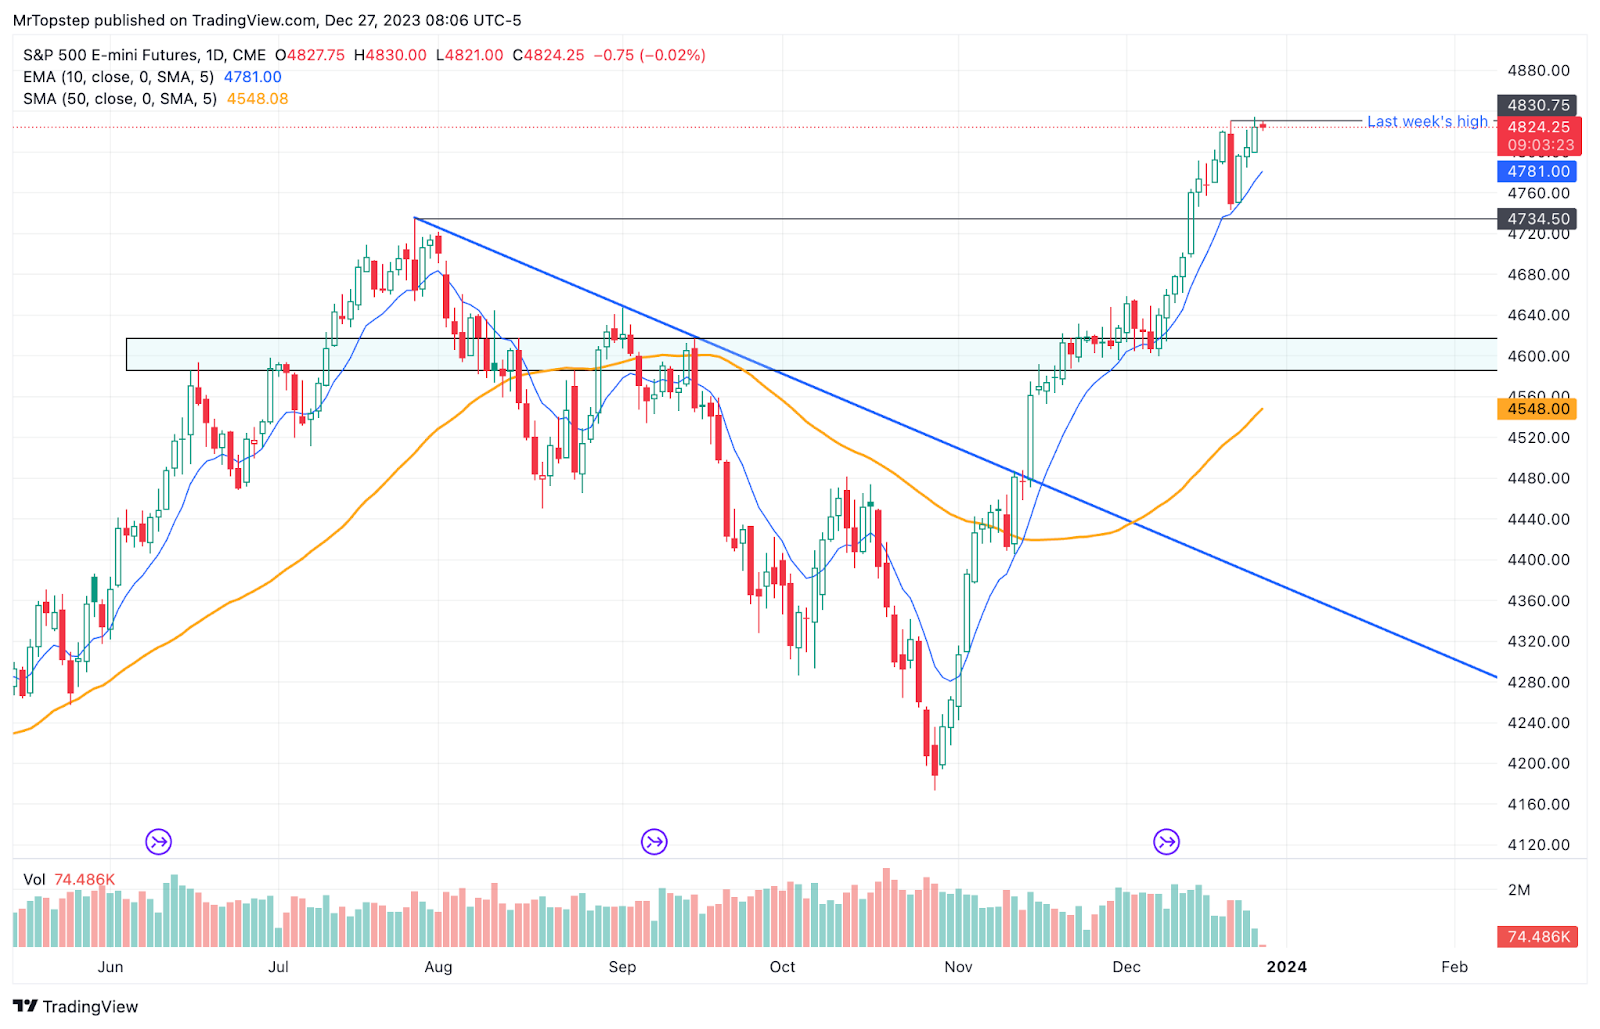
ES Daily
-
Upside: Trade and hourly close above settlement targets 4841.24. Hourly close above there targets 1 sd at 4853.46, hourly close above there targets 1 sd weekly at 4861.55. Hourly close above there targets 2 sd at 4880.92. Hourly close above there targets 3 sd at 4908.37.
-
Downside: Trade and hourly close below 4825.50 targets 4818.38, then 4811.25. Hourly close below there targets -1 sd at 4798.54. Trade below there targets 4794, then 4790. HOURLY close below there targets 4777.62, then 4774.25, then -2 sd at 4771.08. Trade and hourly close below there targets 4765, then 4763.25, hourly close below there targets 4755.51, then -3 sd at 4743.63.
NQ
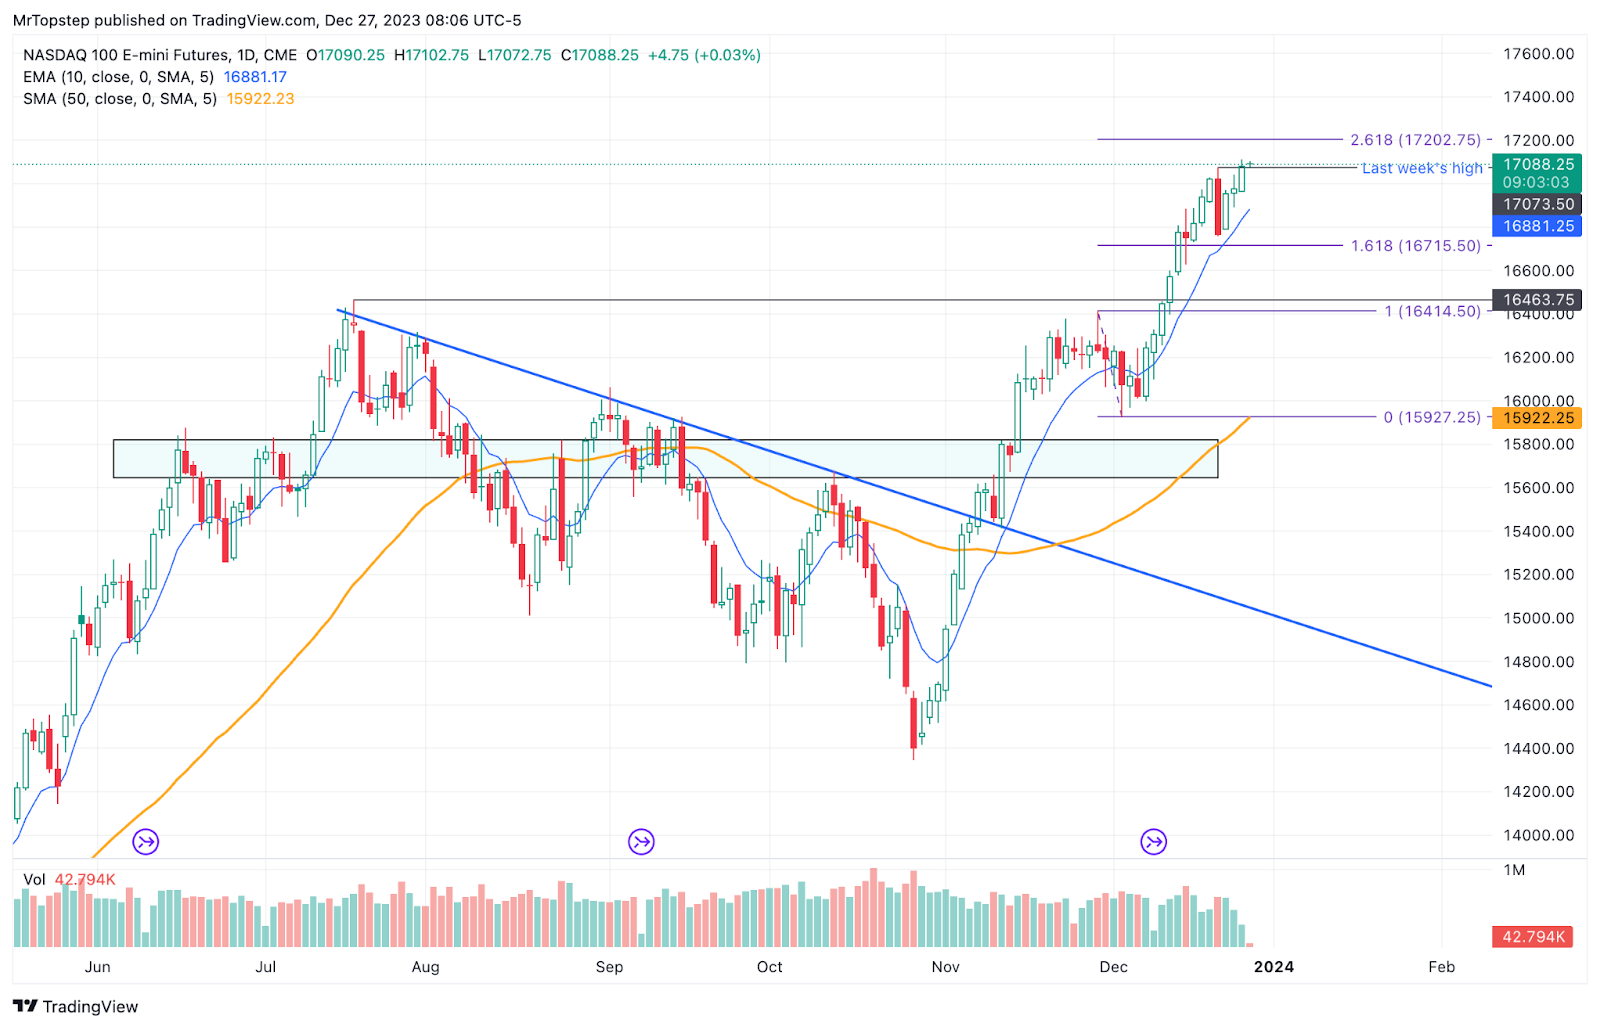
NQ Daily
-
Upside: Trade and hourly close above settlement at 17086 targets 1 sd at 17234.37. Hourly close above there targets 17269.75, then 1 sd weekly at 17302.80 and 17304.75. Trade and hourly close above there targets 2 sd at 17382.74. Hourly close above there targets 17525.35* (has been MAJOR TARGET) and then 3 sd at 17531.10.
-
Downside: Trade and hourly close below settlement 17086 targets 17052.12, then 17015.25. Trade and hourly close below there targets 16946.25 and -1 sd at 16937.63. Hourly close below there targets 16913, then 16901.75, then 16883, then 16875.50. Hourly close below there targets 16838.25. Hourly close below there targets 16803.25, then -2 sd at 16789.26. hourly close below there targets 16740.50, then 16682, then -3 sd at 16640.90.
Guest Post
Enjoy this excerpt from my friend Jeff Hirsch at Stock Trader’s Almanac.
On the last trading day of the year, the NASDAQ has been down in 17 of the last 23 years. And it’s the weakest performing day, on average, of the Santa Claus Rally as noted on page 118 of the Stock Trader’s Almanac 2024.
Last-minute tax-loss selling, old sayings such as “year ends make great exits,” a desire to start with a clean slate, who knows exactly the answer, but the last trading day of the year has turned bearish over the last twenty-three years.
Since 2000, NASDAQ and Russell 2000 have the worst records. On the last trading day of the year, NASDAQ has been down in 17 of the last 23 years after having been up twenty-nine years in a row from 1971 to 1999.
DJIA and S&P 500 also exhibit a bearish bias over the last 36 years. Russell 2000’s record very closely resembles NASDAQ, gains every year from 1979 to 1999 and only six advances since.
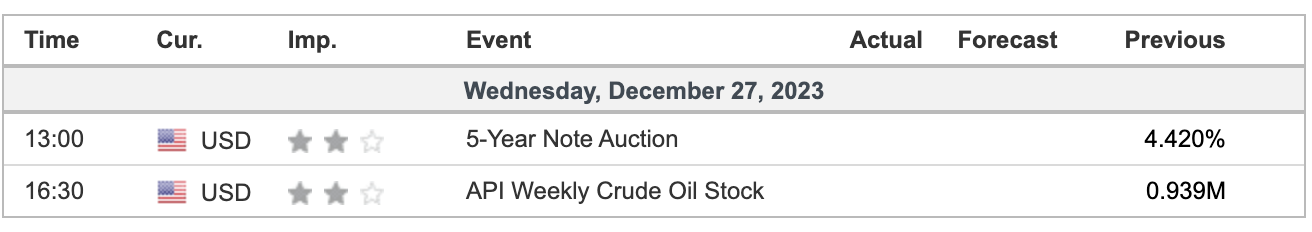
Economic Calendar
Disclaimer: Charts and analysis are for discussion and education purposes only. I am not a financial advisor, do not give financial advice and am not recommending the buying or selling of any security.
Remember: Not all setups will trigger. Not all setups will be profitable. Not all setups should be taken. These are simply the setups that I have put together for years on my own and what I watch as part of my own “game plan” coming into each day. Good luck!
Update your email preferences or unsubscribe here
© 2023 The Opening Print
228 Park Ave S, #29976, New York, New York 10003, United States
Comments are closed