Looking to Buy the Dip
Higher prices beget higher price targets
Hello Fellow Trader,
Don’t miss out on our upcoming dynamic Live Q&A session featuring two leading experts in the field (Danny Riley and Handelstats). Here’s a glimpse of what awaits you:
Get an Exclusive Look: Gain a behind-the-scenes view of the daily tools wielded by experts to navigate the market successfully.
Explore Quantitative Analysis: Dive into the world of quantitative analysis and discover how it empowers you to make informed and strategic trading decisions.
Gain a Competitive Edge: Start the new year with a competitive edge by acquiring strategic insights and valuable knowledge from our experts.
But that’s not all! We’ll be conducting a comprehensive analysis of market cycles and statistics from the past year, utilizing our quantitative approach. This isn’t just a reflection on the trends of the previous year—join us as we leverage this data to provide forward-looking insights. We’re excited to apply a data-driven perspective to help you navigate the intricacies of the market and explore strategic opportunities for the upcoming year.
Save the date for Saturday, December 23, 2023, and register now to secure your spot for this insightful webinar.
Please register for S&P 500 Quantitative End of Year Review + Stock Market Outlook for 2024 on Dec 23, 2023 11:00 AM EST at:
After registering, you will receive a confirmation email containing information about joining the webinar.
We look forward to having you join us for an engaging and informative session!
Our View
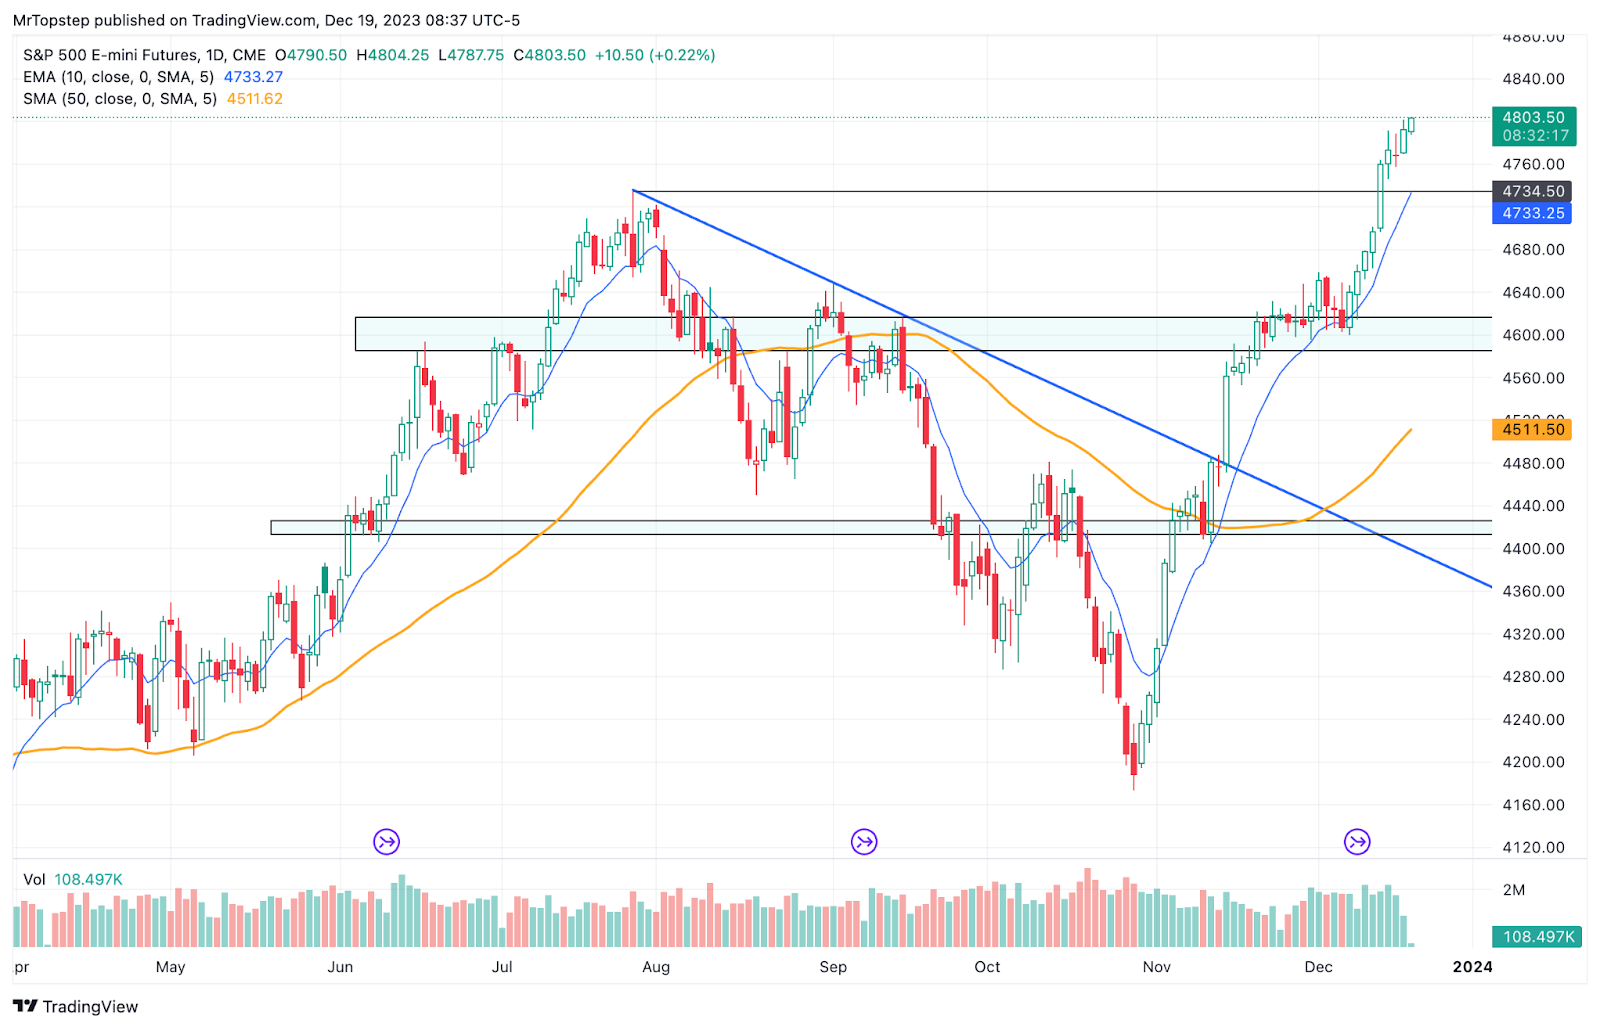
Goldman Sachs raised its S&P 500 year-end 2024 price target to 5100, representing 8% upside from current levels. This outcome aligns with the scenario we outlined last week, where lower inflation and dovish Fed policy allow real yields to fall.
The new year-end 2024 target reflects a P/E greater than 19x — compared with Goldman’s prior target of 4700, which forecasts a multiple of 18x. The firm’s 3-month and 6-month targets are 4800 and 4900. From Goldman:
The bevy of encouraging economic data releases this week support our upwardly revised equity market outlook. The CPI and PPI reports this week both signaled that inflation is nearing the Fed’s target. Our economists expect that core PCE inflation will register just 3.1% year/year in November. In fact, by some measures the trend is already at or near 2%. Above-consensus retail sales growth further evidenced economic resilience, while lower-than-expected jobless claims affirmed that the labor market remains healthy.
Equities were already pricing positive economic activity but now reflect an even more robust outlook. The performance of cyclical vs. defensive stocks has moved from pricing GDP growth of 1.5% to above 3% during the last seven weeks. Our stronger view of the equity market also dovetails with our colleagues’ upgrades to the US GDP growth and interest rate outlooks.
Following the Fed’s dovish signaling, our economists now expect the FOMC will cut the policy rate sooner and faster than they previously anticipated. Their revised funds rate forecast assumes consecutive 25 bp cuts in March, May, and June followed by quarterly cuts that will place the policy rate at 4.0%-4.25% at year-end 2024. Futures prices currently imply a total of six cuts to 3.75%-4.0% by the end of next year.
Our interest rate strategists also revised their forecast to reflect the Fed pivot. They now expect the 10-year Treasury yield will fall to 3.75% in 1H 2024 (previously 4.65%) before rising to 4.0% at the end of next year (previously 4.55%), only 10 bps above the current level of 3.9%. The move in real yields has been particularly dramatic and strongly influences equity valuations. In October, the real rate equaled 2.5% but it has since plummeted to 1.7%. The yield gap between real rates and earnings yield now equals 350 bps. We forecast it will remain roughly at this level at year-end 2024.
We see upside risk to our above-consensus S&P 500 earnings estimate of 5% year/year growth in 2024. Our top-down EPS estimate of $237 compares with the median strategist estimate of $230. Financial conditions have loosened substantially.
For what it’s worth, I pushed my end-of-year price up to 4750, and then up to 4850 and there are a lot of positive seasonalities in January.
Our Lean
With the exception of a few 50-point ranges, most ranges have been 20 to 30 points — like yesterday. I think it’s a buy-the-pullbacks market right into the end of the year.
I don’t know what else to say and I don’t want to fill these pages with useless fodder. We’re getting into year end and volumes should start to drop. I’m looking to buy any 20 to 40-point pullbacks.
For those of you who like HandelStats levels, here they are:
-
Upside: Trade and hourly close above 4803, targets 1 sd at 4814.92, then 4819.21 (it’s going there with an hourly close above 4803). Trade and hourly close above there targets 1 sd weekly at 4826.53. Hourly close above there targets 4835.96, hourly close above there targets 2 sd at 4840.59.
-
Downside: Trade and hourly close below 4803 targets 4798.25, then 4793.50. Trade and hourly close below 4793.50 targets settlement 4789.25 , then 4787.50. Hourly close below there targets 4780, hourly close below there targets 4775.75. Hourly close below there targets 4766.88, then -1 sd at 4763.58. Hourly close below there targets 4755.51, hourly close below there targets 4742.25, then -2 sd at 4737.91.
MiM and Daily Recap
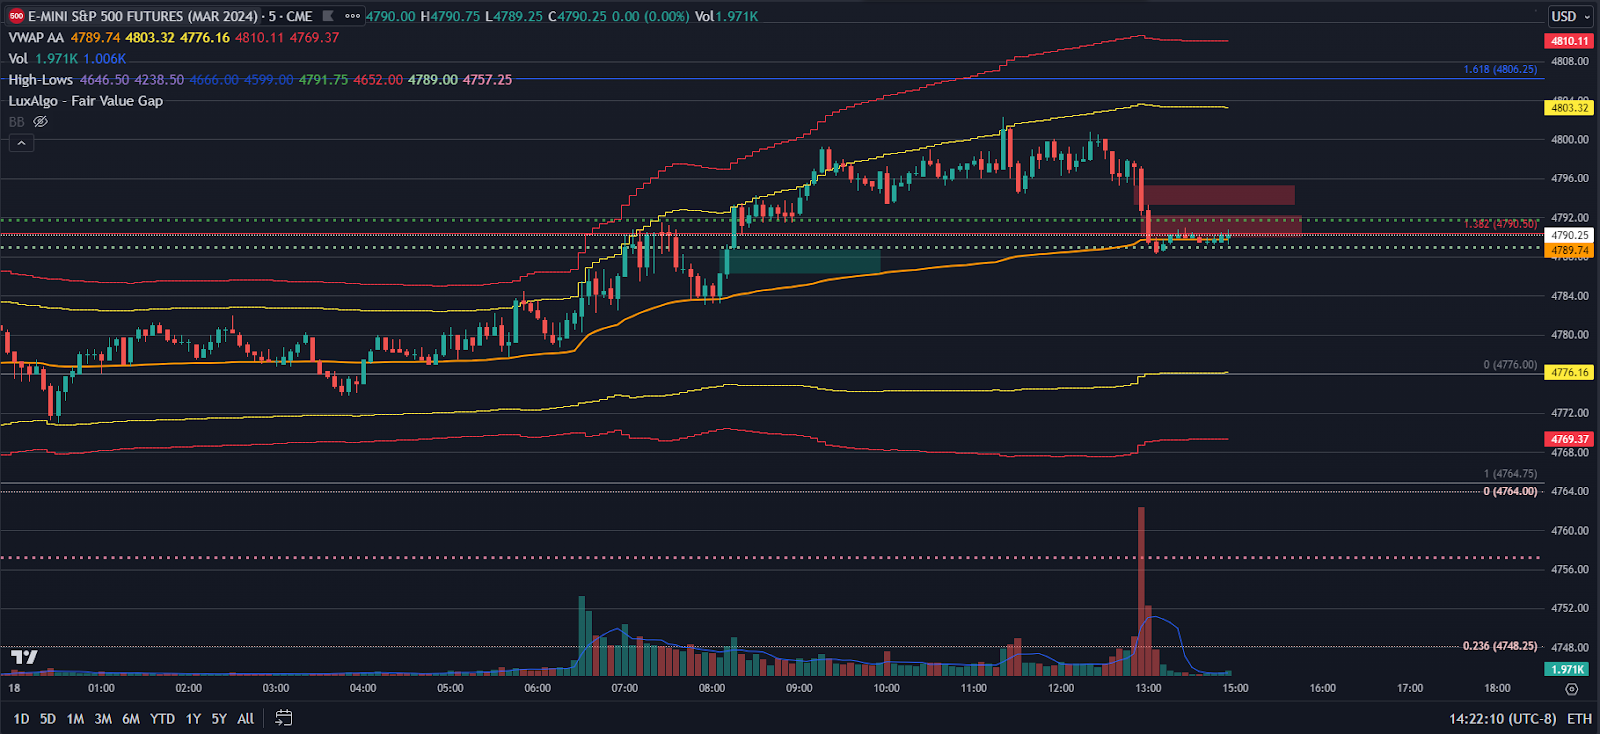
ES Recap
The ES traded up to 4784.50 and opened Monday’s regular session at 4782.00. After the open, the ES stutter-stepped up to 4791.50 at 10:33, pulled back just under the VWAP 4783.00 at 11:09, and then rallied up to 4799.25 at 12:38. After the high, the ES pulled back to the 4793.25 level, back-and-filled and traded up to a new high at 4802.25 at 3:27.
From there, the ES pulled back to the 4794.50 level, and traded 4708.00 as the 3:50 cash imbalance showed $558 million to sell and trade 4798.00 on the 4:00 cash close. After the close, the ES sold off down to 4788.25 at 4:20 and settled at 4790.25 on the 5:00 futures close, up 20.75 points or 0.40% on the day.
In the end, it was a quiet day. In terms of the ES’s overall tone, it was firm. In terms of the ES’s overall trade volume was low, with 1.078 million traded contracts trading.
Technical Edge
-
NYSE Breadth: 54% Upside Volume
-
Nasdaq Breadth: 44% Upside Volume
-
Advance/Decline: 50% Advance
-
VIX: ~12.50
ES
Levels from HandelStats.com
ES Daily
-
Upside: Trade and hourly close above 4803, targets 1 sd at 4814.92, then 4819.21 (it’s going there with an hourly close above 4803). Trade and hourly close above there targets 1 sd weekly at 4826.53. Hourly close above there targets 4835.96, hourly close above there targets 2 sd at 4840.59.
-
Downside: Trade and hourly close below 4803 targets 4798.25, then 4793.50. Trade and hourly close below 4793.50 targets settlement 4789.25 , then 4787.50. Hourly close below there targets 4780, hourly close below there targets 4775.75. Hourly close below there targets 4766.88, then -1 sd at 4763.58. Hourly close below there targets 4755.51, hourly close below there targets 4742.25, then -2 sd at 4737.91.
NQ
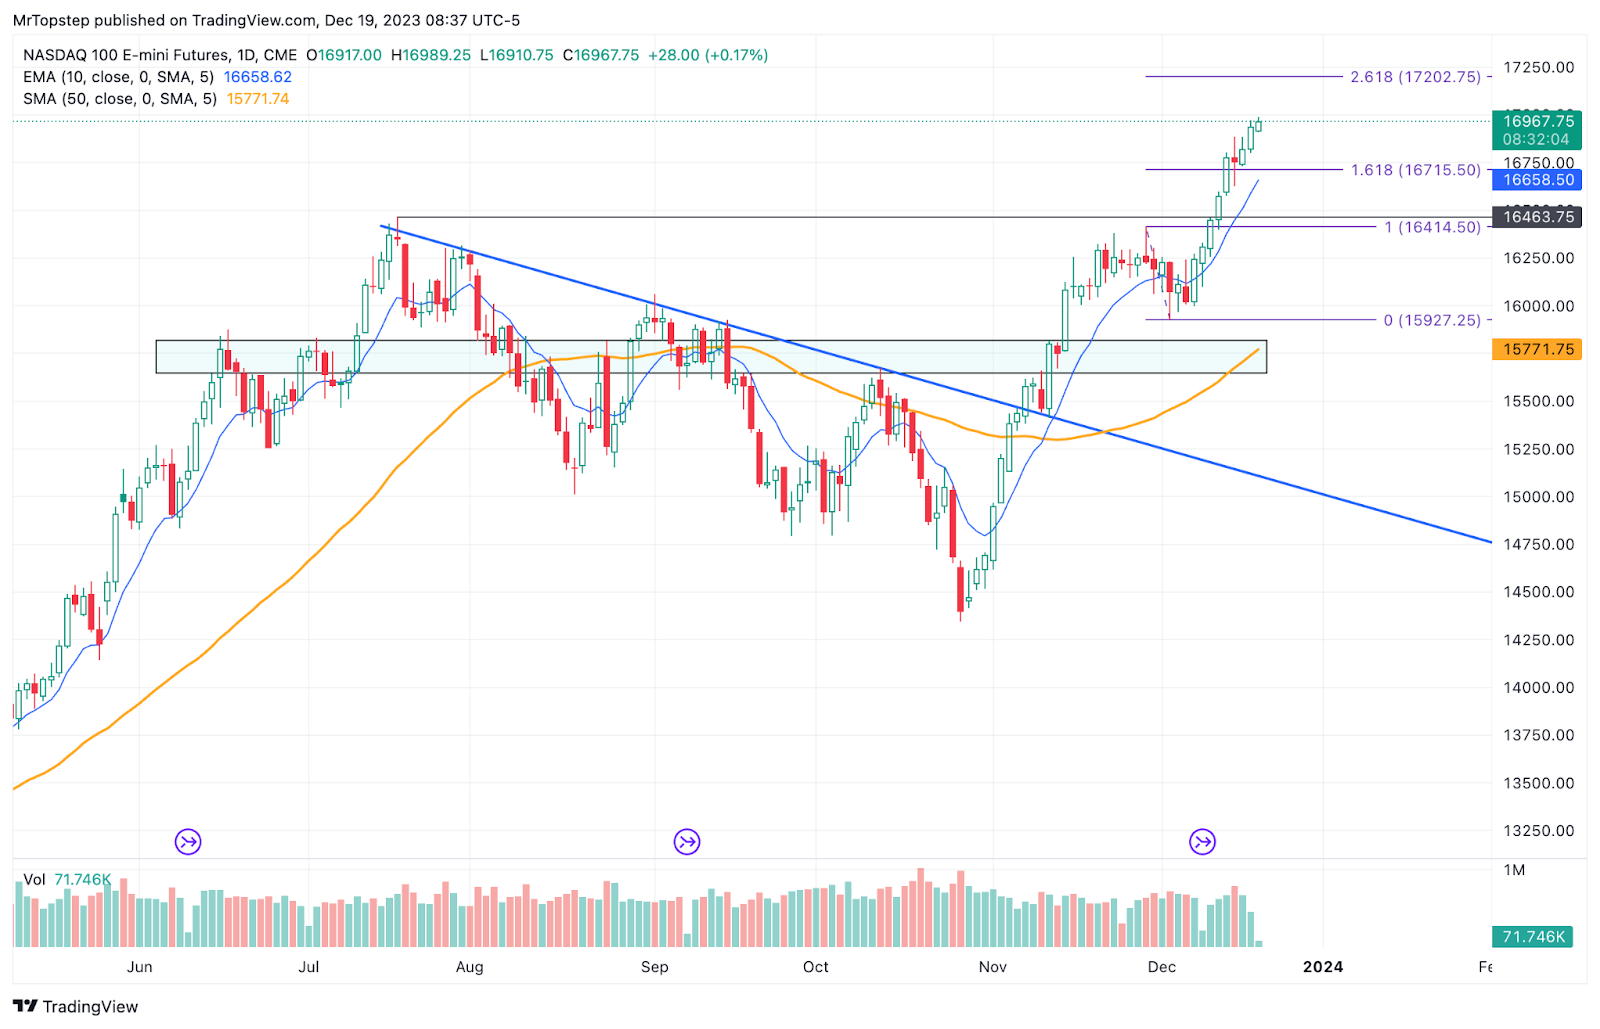
NQ Daily
-
Upside: Trade and hourly close above 16971.50 targets 1 sd at 17059.84, hourly close above there targets 1 sd at weekly 17136. Hourly close above there targets 2 sd at 17202.93. Hourly close above there targets 17269.75, then 17304.75.
-
Downside: Trade and hourly close below 16971.50 targets 16949.88, then 16928.25, then settlement at 16916.75. trade below there targets 16890.38 and 16884.75. Trade and hourly close below there targets 16796.75. Hourly close below there targets 16777.75 then -1 sd at 16773.66. Hourly close below there targets 16740.50, hourly close below there targets 16682. Hourly close below there targets -2 sd at 16630.57.
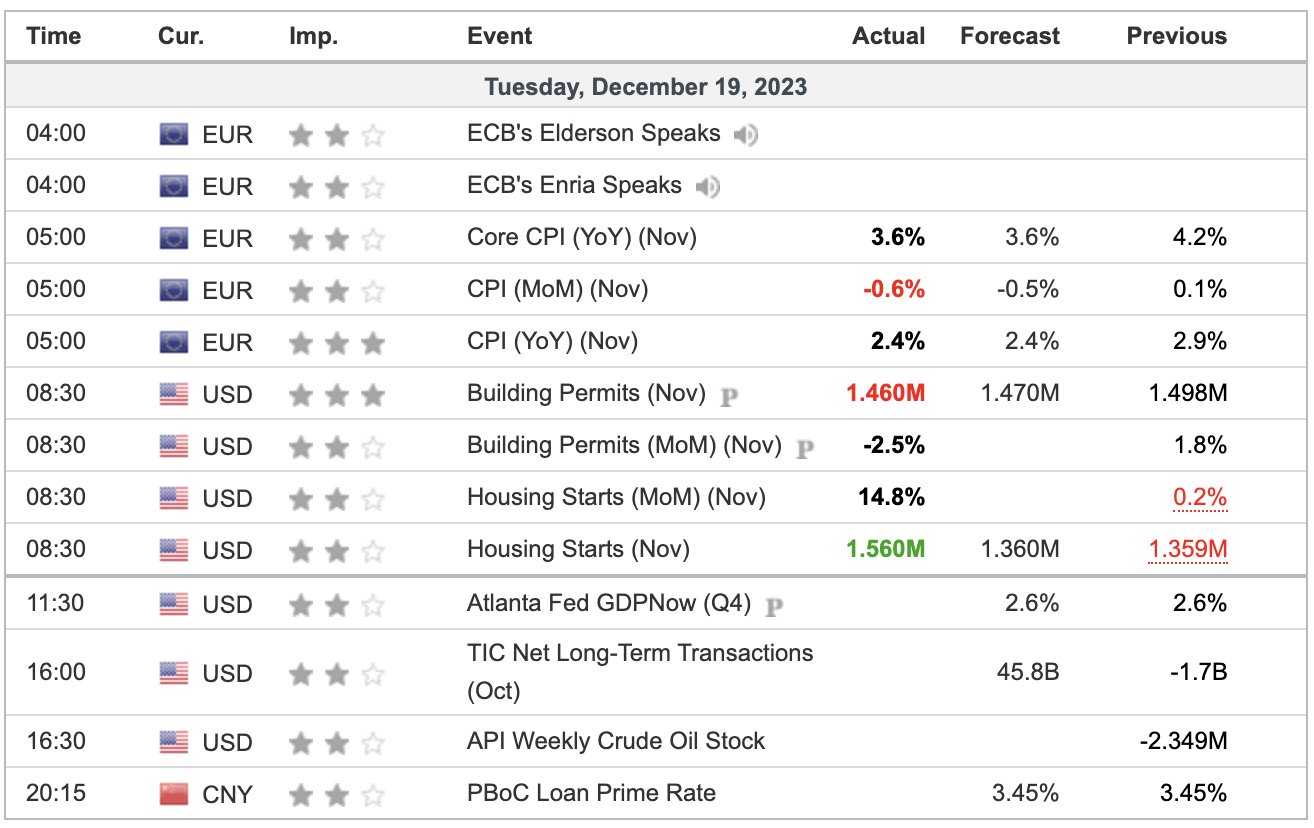
Economic Calendar
Disclaimer: Charts and analysis are for discussion and education purposes only. I am not a financial advisor, do not give financial advice and am not recommending the buying or selling of any security.
Remember: Not all setups will trigger. Not all setups will be profitable. Not all setups should be taken. These are simply the setups that I have put together for years on my own and what I watch as part of my own “game plan” coming into each day. Good luck!
Update your email preferences or unsubscribe here
© 2023 The Opening Print
228 Park Ave S, #29976, New York, New York 10003, United States
Comments are closed