Following the Fund Flows
5-week win streak snapped
Hey! There’s a really informative webinar coming up on February 23rd from SpotGamma called “Vanna – Feel The Force (IT’S A TRAP!!!)”
To register for the webinar, please visit this link. I think it will be very helpful and give some good insight into how options impact the market.
Our View
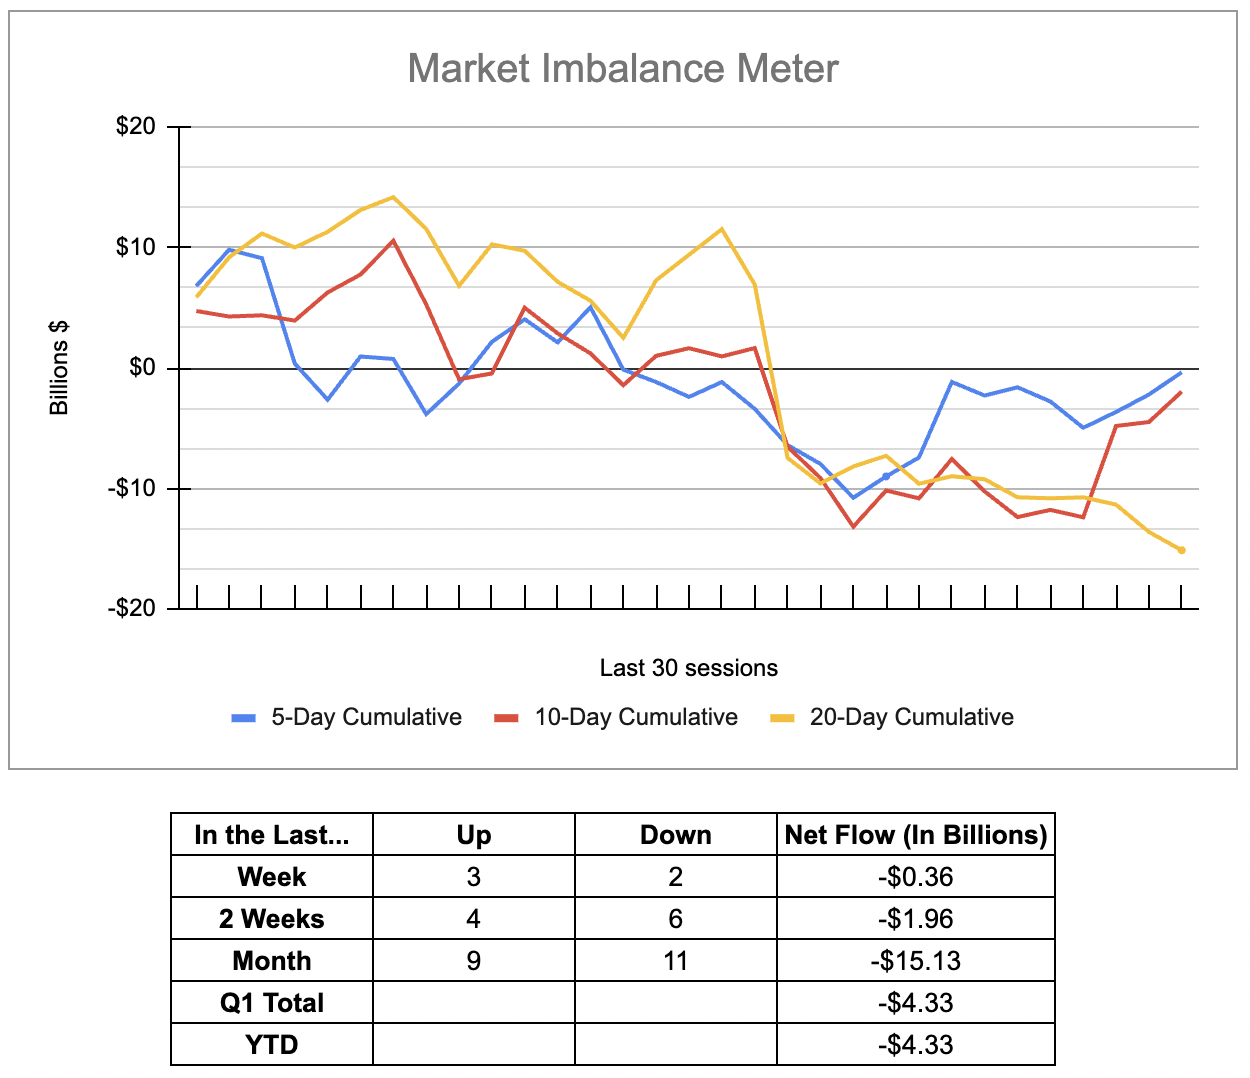
One of the things I have always followed is money flows, which we see every day on the MrTopStep Imbalance Meter.
Whenever there is a prolonged decline, I pay close attention to the NYSE 3:50 ET order imbalance (which I provided to all my desk customers). I’ll admit that it’s not always a market-moving event, but there are a lot of times the ES moves sharply before and after, so I don’t think it’s something that should be overlooked, especially if you have the historical data.
In this newsletter, we keep track of the imbalance in total billions. But it’s not just about trading the close, it’s about tracking international flows. Obviously, we already know billions moved out of stocks two years ago and moved into bonds, but after a 24% rise in the S&P 500, its important to keep following the money.
Over the week of February 14th, investors pumped a net $9.12 billion into global equity funds, marking their largest weekly net purchase since Dec. 27, 2023. The largest part of the inflows went into US funds. Does that support the markets going higher? I think so in a longer view, but after Friday’s weak close, we could see some more selling.
Our Lean
The week ahead has only 4 notable economic releases, 6 Fed governors speaking and the Fed Minutes for the January meeting. Oh yeah, and NVDA reports earnings.
The short holiday week is slightly negative statistically. The day after Presidents Day has the Nasdaq down 18 of the last 29 occasions, but up 7 of the last 11. The week after the February expiration typically has the Dow down.
Our Lean is to sell the rallies, but I can’t rule out buying a lower open. I will also be paying close attention to ES’s volume, which should be low.
Lastly, I called BS on the Fed lowering rates 6 times in 2024 early in the year and said they won’t lower in the first quarter. Now the debate has shifted to whether the Fed will begin cutting rates in June and push the issue later into the summer, if not the fall. Everything is data dependent and right now that data is not in line with lowering rates.
Trading range for today: 4982 – 5028
Below: 4982 – 4974 – 4967 – 4960 – 4945 – 4936 – 4920 – 4890 – 4872 – 4860
Above 5028: 5034 – 5048 – 5060
MiM and Daily Recap
ES Recap
The ES rallied up to 5059.25 on Globex, but pulled back as the yield on the 10-year note rose to 4.3% and the January wholesale prices rose more than expected, another sign of persistent inflation. The ES opened FRydays regular session at 5043.00, rallied up to 5045.25, sold off down to 5033.00 at 9:37, rallied a few points and sold off to 5012.75. From there, the ES traded back up to the 5030.75 level, dipped back the 5022.50 area at 10:23, back-and-filled until 10:24, and then rallied up to a 5037.25 double top at 10:55.
After the high, the ES pulled back to 5032.25, rallied up to 5047.50 at 11:33, dropped to the 5042.00 level and then made another new high at 5049.75 at 11:38 and another new high at 5050.25 at 11:41, and then slowly drifted lower before getting hit by a sell program that pushed the futures down 5033.00 at 1:13. From there, the ES rallied up to a 5044.50 double top, traded down to 5041.25 at 1:35 and then blasted up to another new high at 5054.50 at 2:23 and then dropped down to 5024.75 at 2:48. After the low, the ES did a narrow back-and-fill for the next 47 minutes and then sold off down to 5015.00 at 3:49 as the 3:50 imbalance imbalance showed $73 million to sell and traded 5020.00 on the 4:00 cash close.
After 4:00, the ES traded down to 5013.00, down 36 points or down 0.71% on the day and its first down week in the last 5. The NQ settled at 17,720.75, down 233.25 points or -1.30%.
In the end, FRYday never ceases to amaze. They are always filled with big drops and pops. In terms of the ES’s overall tone, I continue to believe that there are 3 parts to the trading day: What happens on Globex, what happens after the 9:30 ET open, and what happens in the last hour. In terms of the ES’s overall trade, volume was steady at 1.459 million contracts traded.
Holiday Abbreviated Session
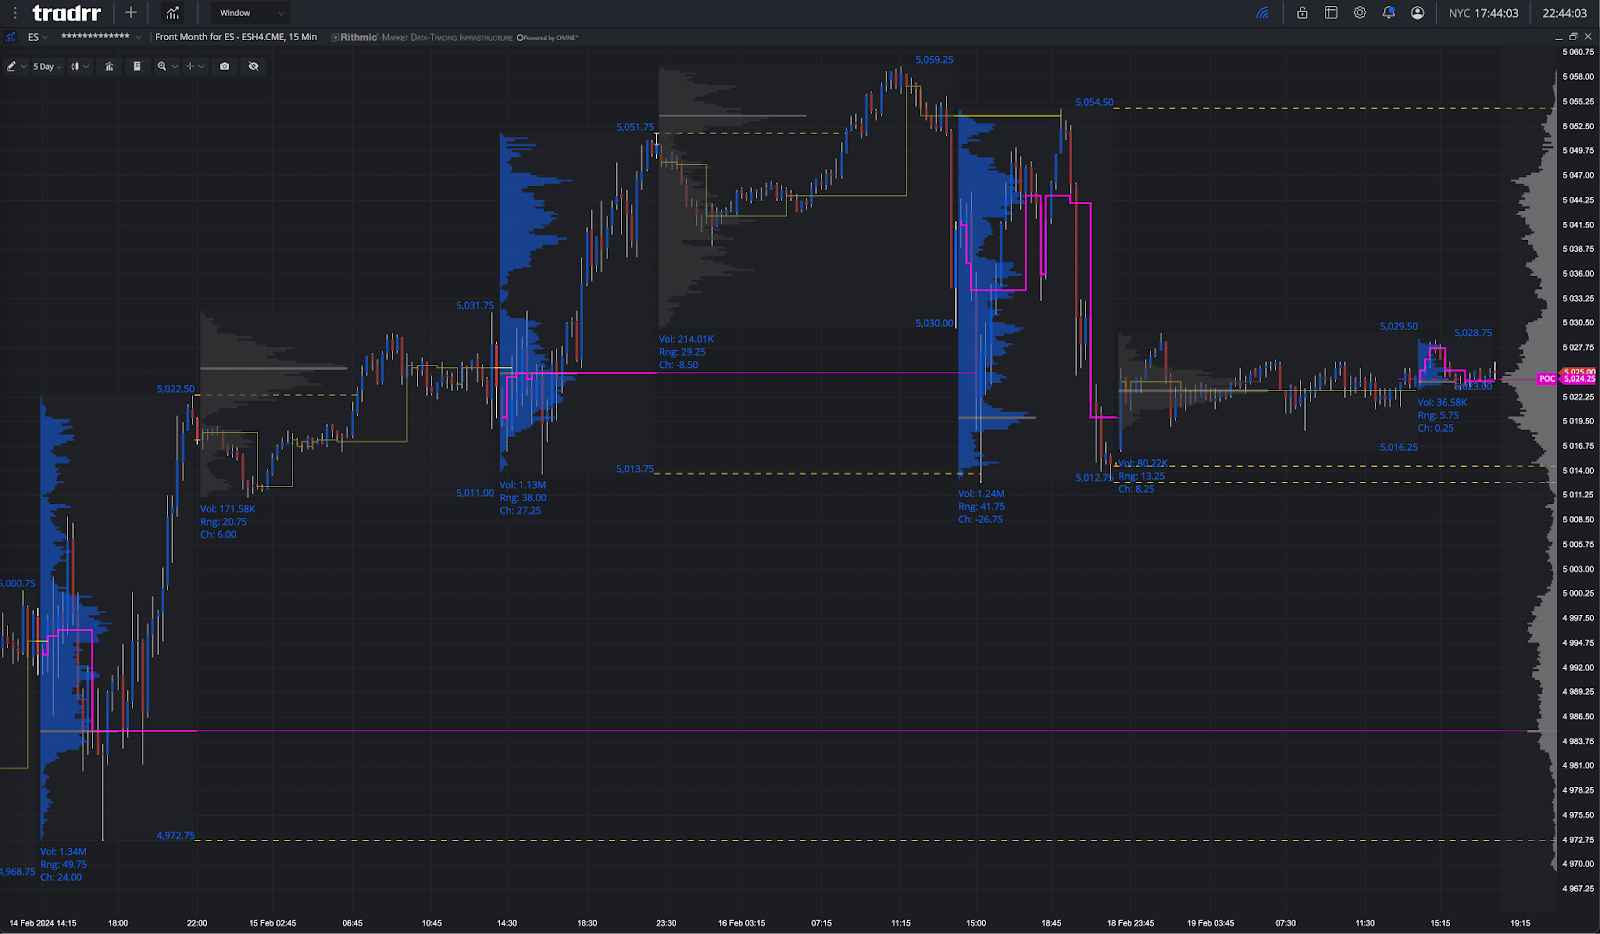
The ES made a low on Globex, traded up to 5028.50, and closed at 5024.50 with a total of 119k contracts traded and opened Monday nights Globex session at 5024.50
For more info on accessing the MIM, please visit here.
Technical Edge
-
NYSE Breadth: 39% Upside Volume
-
Nasdaq Breadth: 41% Upside Volume
-
Advance/Decline: 33% Advance
-
VIX: ~14.25
ES
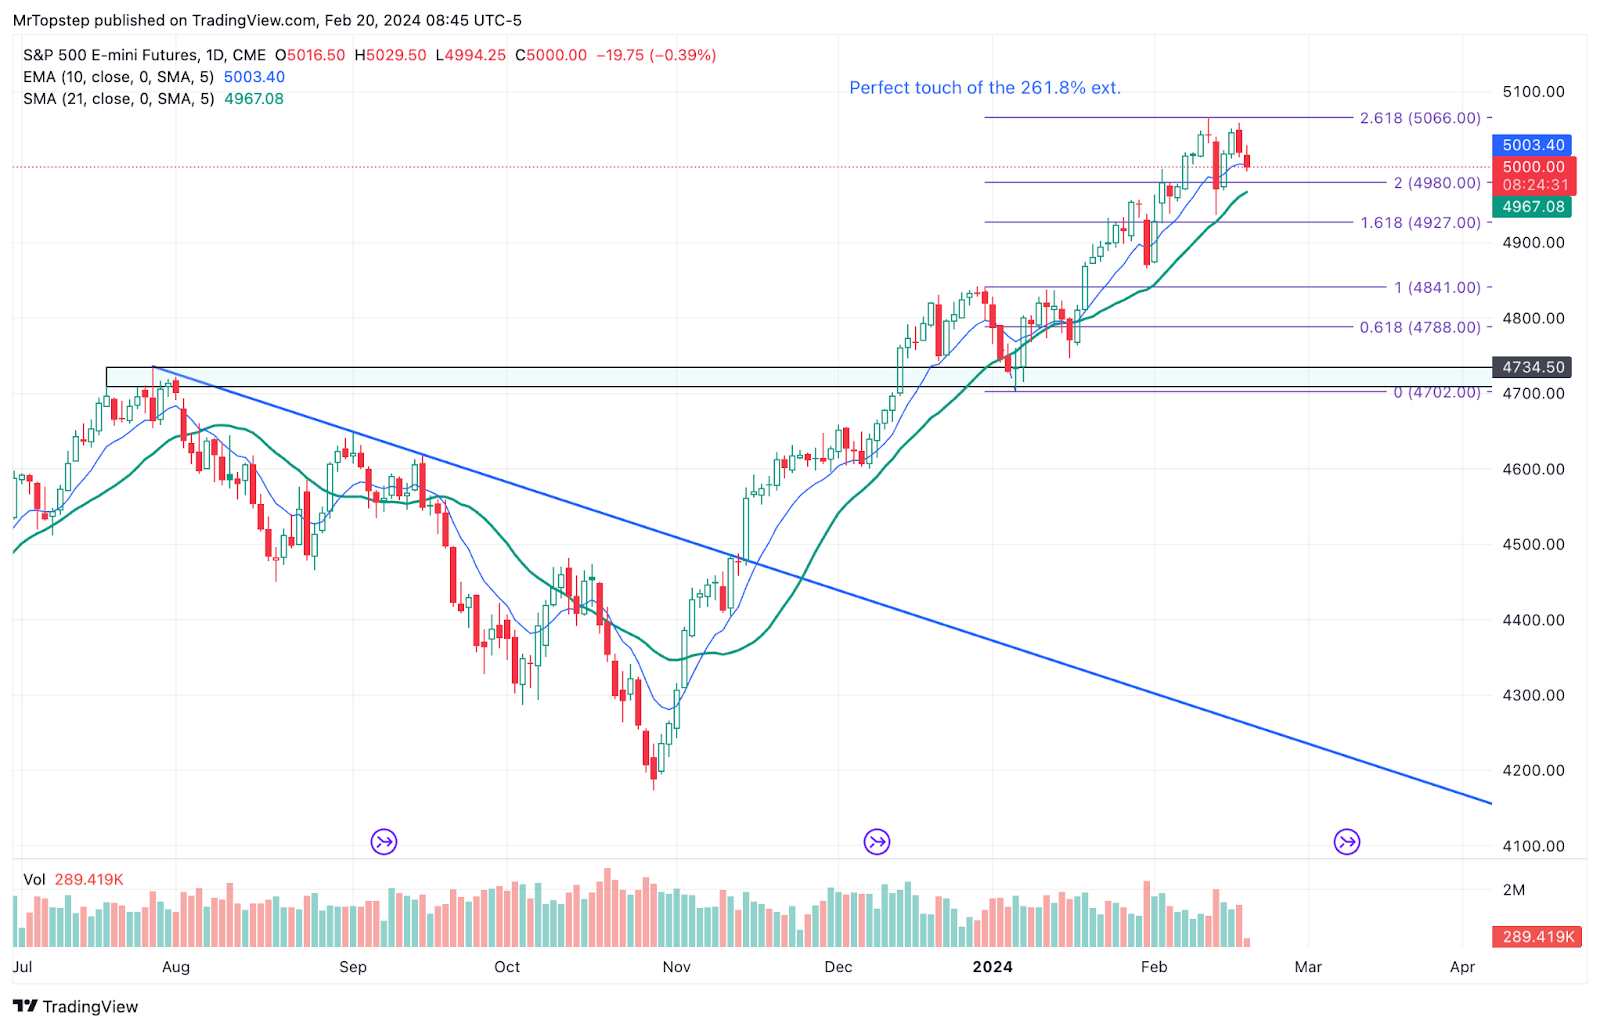
ES Daily
Guest Post 1 — Niels from Tradrr
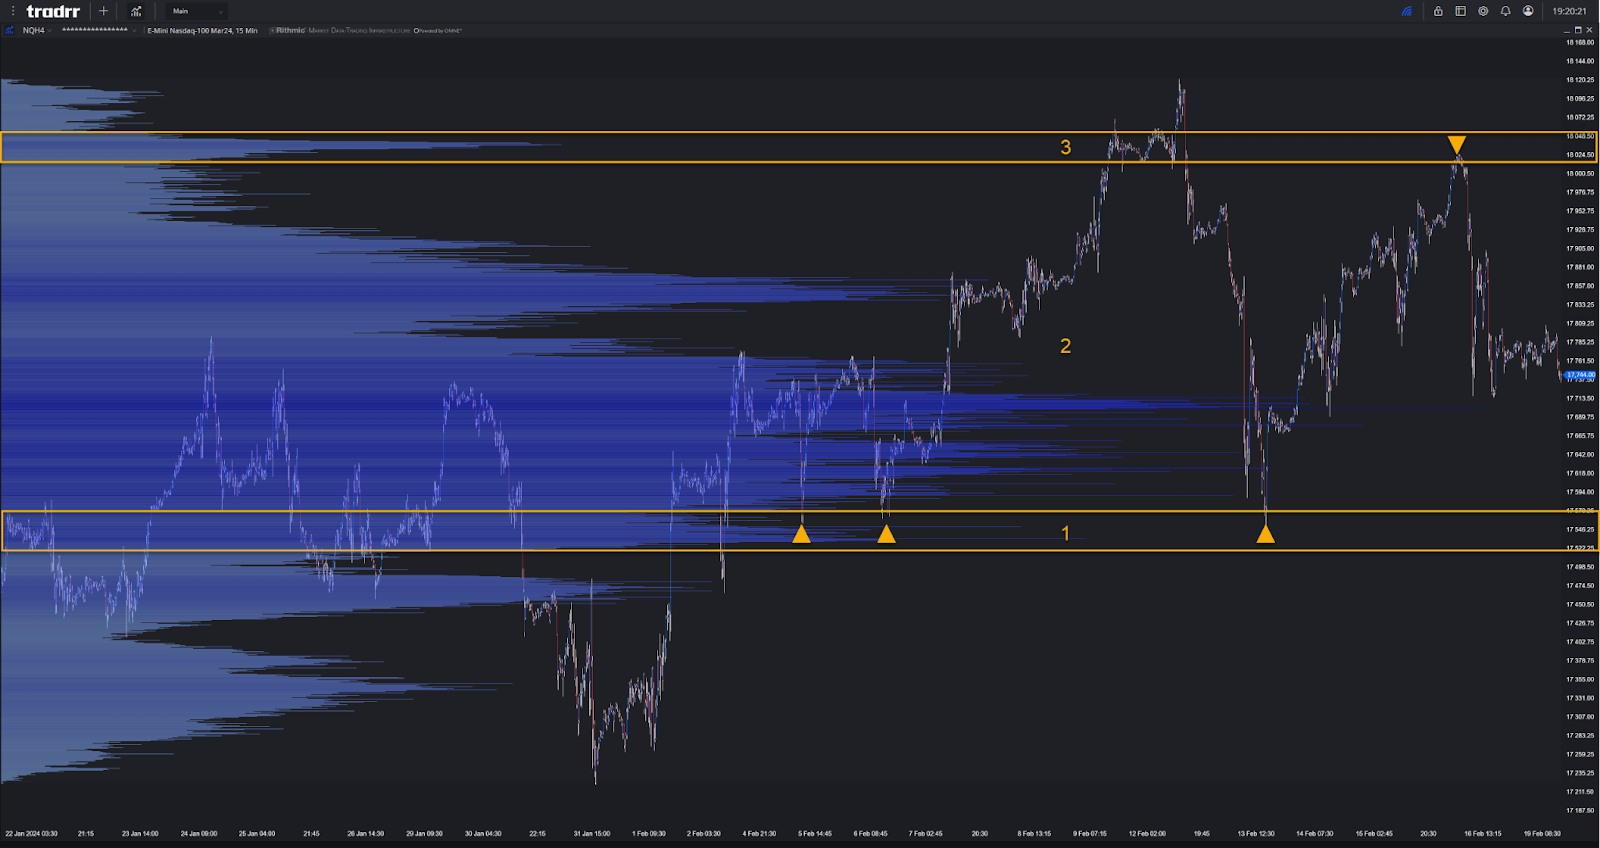
Coming into Today off a 3-day weekend resting near the middle of the profile range with a debatably balanced D shaped profile for a rolling 1 month period. Not much news scheduled for Tuesday and a FOMC minutes scheduled for Wednesday but the real mover hat should aid to build intent for a break of this profile would be after the close of Wednesday when we have slotted Nvidia to speak on their Q4 earnings.
1 and 3 – Mark technical events gleamed from the candles and a bit more worry placed near those fairly identical lows in section 1 that if/when broken opens us up to the swing lows that rounded out January into this current month. Should a statement be muted from NVDA to where no impact is placed we continue on balancing as we await for something with a bit more oomph.
Guest Post 2 — Rich from HandelStats
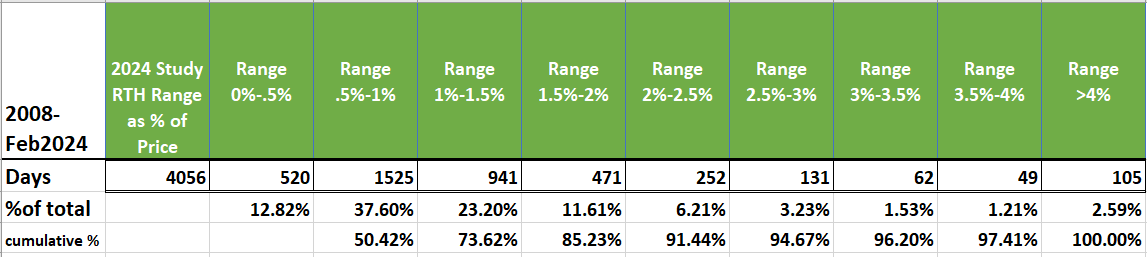
Statistical Analysis of RTH Daily Range Sizes (2008 – February 2024)**
Objective:
To analyze the frequency and cumulative distribution of daily range sizes, calculated as the percentage difference between the high and low prices during the regular trading hours (RTH), relative to the prior day’s settlement price.
Methodology:
Daily range sizes were categorized into nine distinct ranges, starting from 0% up to greater than 4%. Each range size was observed for its occurrence over the study period.
Results:
– Most Frequent Range Sizes:
– The 0.5% to 1% range size had the highest occurrence, representing 37.60% of the total days.
– The 1% to 1.5% range size followed with 23.20%.
– Least Frequent Range Sizes:
– The range size greater than 4% was the least frequent, accounting for 2.59% of the total days.
– The 3.5% to 4% range size was slightly more common, occurring 1.21% of the time.
– Cumulative Distribution:
– The cumulative percentage showed that 50.42% of the days had a range size of up to 0.5%.
– About 73.62% of the days had a range size of up to 1%.
– The data indicate that 97.41% of the days had a range size of up to 3.5%.
– Every range size category accounted for 100% of the days, cumulatively.
Conclusion:
The regular trading hours typically exhibit a range size of less than 1.5%, which encompasses over 73.62% of the trading days. Larger fluctuations above 2% are significantly less common, illustrating a market with a tendency towards smaller daily price movements during the observed period.
Comments are closed