Rallies Aren’t Done for Gold, Dow
‘Thin to win’ at play amid low volumes
Follow @MrTopStep on Twitter and please share if you find our work valuable!
Every week, MrTopStep invites traders to an “Own the Close” contest where the closest guesstimate where the SPX will settle on Friday’s 4:00 cash close.
The winners get a free week’s access to the MrTopStep Chat and trading tools. Enter your guess now!
Our View
Tell me I am wrong, but gold looks like it’s going to $2,400 and the Dow (YM) is going to 40,000.
While I didn’t get everything I was looking for on Friday, I did exit my ES position at the 5250 area, but that doesn’t mean I think the rally is over. Despite the mixed trade and low volumes, the first-quarter earnings season is turning out better than many Wall Street forecasters had expected.
According to data compiled by Birinyi Associates, S&P 500 companies that have reported first-quarter results as of Monday have disclosed buying back $181.2 billion of their shares during the period, which is up 16% from last year at the same period last year.
Goldman Sachs analysts project that total S&P 500 repurchases will reach $925 billion this year and $1.075 trillion in 2025, which would mark annual growth rates of 13% and 16%, respectively. I think that’s driving the markets higher.
This week is packed with 13 Fed speakers — including 3 today and Fed Chair Powell speaking tomorrow — 14 economic releases, and earnings. Wednesday will include both the CPI release and the Retail Sales report, due up at 8:30 a.m. ET.
In particular, the CPI report will definitely test the validity of the recent rally. The April 10th CPI release sent 10-year Treasury yields surging 18 basis points, the biggest one-day move caused by the CPI data since 2002. I think you have to be on the lookout for a hot CPI number this week.
Our Lean
I’m keeping it simple to start the week.
With volumes so low — more on that below — I think “thin to win” can remain in play. I can’t rule out selling an early rally, but it looks like markets can continue to drift higher from here.
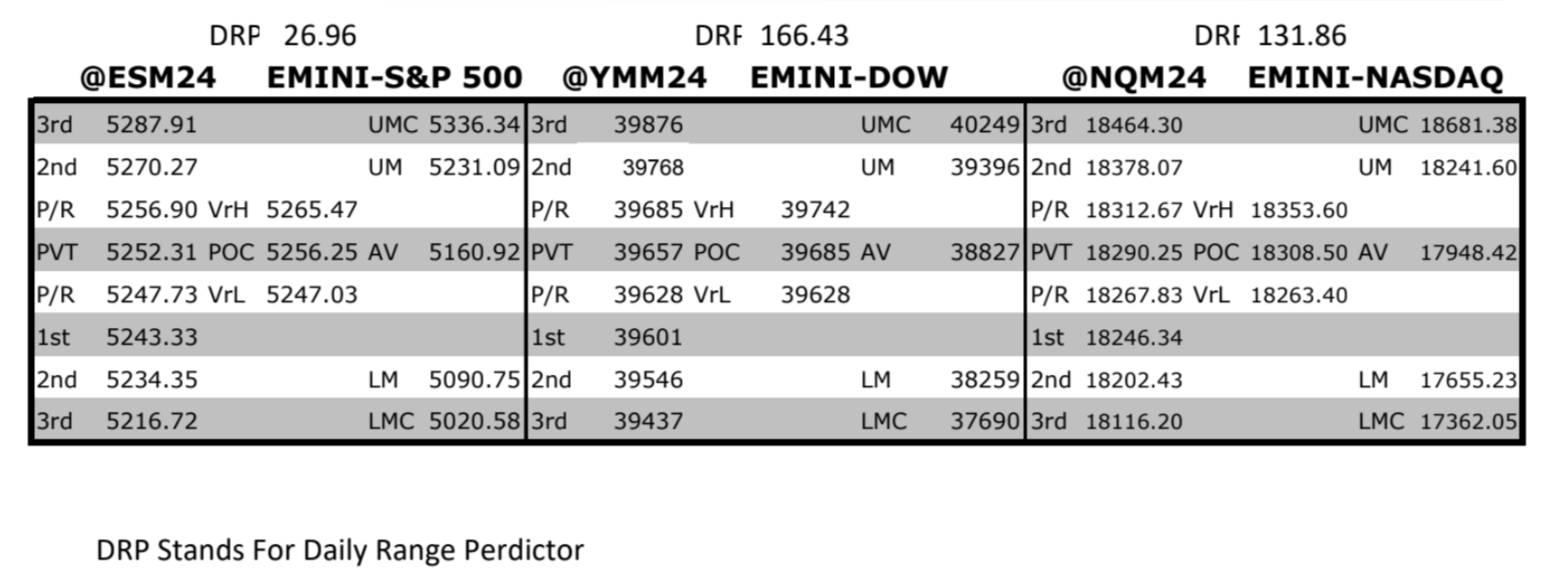
MrTopStep Levels:
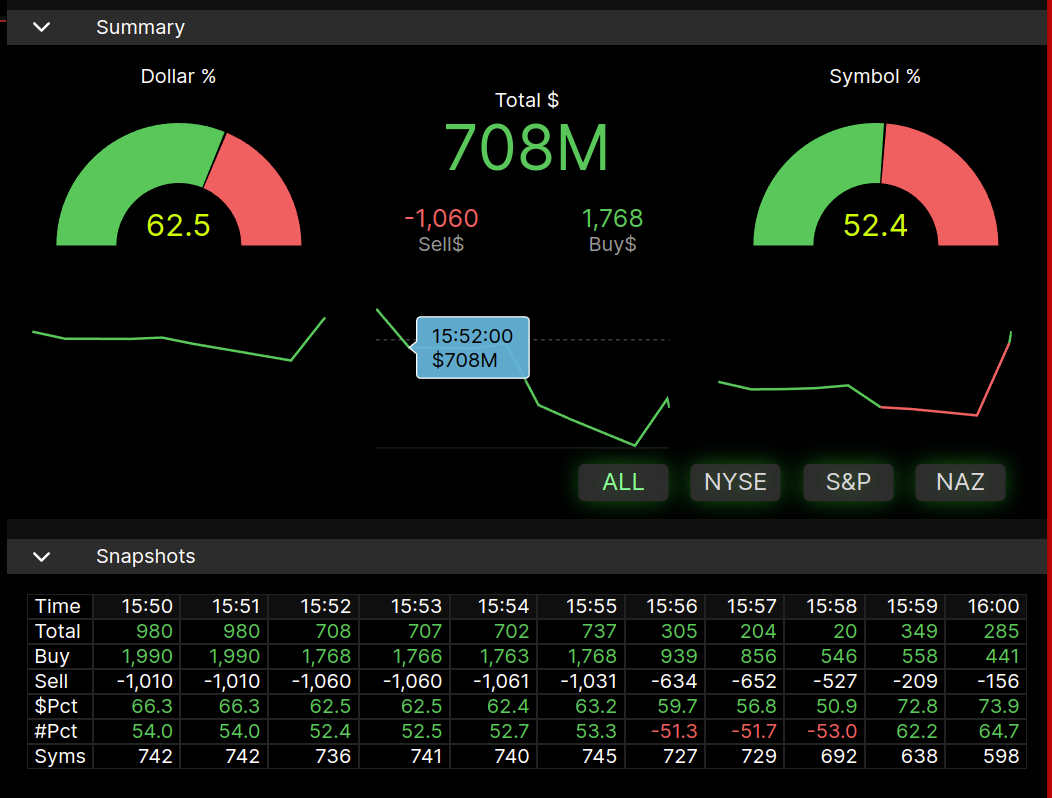
MiM and Daily Recap
ES Recap
The ES traded up 5260.75 on Globex and opened Friday’s regular session at 5255.50. After the open, the ES traded 5250.75, traded up to 5264, sold off down to a 5242.25 double bottom and 10:37, rallied up to 5251 at 10:45 and then sold off down to the low of the day at 5232.75 at 11:46. After the low, the ES slowly rallied up to 5244.75 at 12:59, pulled back to a higher low at 5236 at 1:50 and slowly rallied up to 5249.00 at 3:44.
The ES traded 5246.50 as the 3:50 cash imbalance showed $700 million to buy, traded up to 5250.75 and traded 5245.25 on the 4:00 cash close. After 4:00, the ES sold off down to 5240.75 and settled at 5141.50, up 2.5 points or +0.05%, the NQ settled at 18,239.25, up 24.74 points or +0.14%. Crude oil settled at $78.20, down -1.34%, the yield on the 10-year Treasury added more than 5 basis points to trade at 4.5%, and gold settled at $2,366.90, up 26.60 or +1.14% on the day.
In the end, most of the days’ buying power was used on the gap-up open and subsequent rally. In terms of the ES’s overall tone, it spent the majority of the day trading under the VWP. In terms of the ES’s overall trade, it remains historically low for this time of the year: Only 161k traded on Globex and 900k traded on the day session for a total of 1.061 million contracts traded.
ES Volume Drop
On April 15, the ES’s total volume was 2.226 million. I went back all the way to May 12th of last year and could not find any stretch of lower volume. I’m not sure why, but my charts have shown at least 3 sessions under 1 million contracts. From Yahoo Finance:
-
May 1 1.955 mil
-
May 2 1.573 mil
-
May 3 1.604 mil
-
May 6 1.019 mil
-
May 7 1.106 mil
-
May 8 1.013 mil
-
May 9 1.095 mil
-
May 10 1.094 mil
Technical Edge
-
NYSE Breadth: 72% Upside Volume
-
Nasdaq Breadth: 62% Upside Volume
-
Advance/Decline: 70% Advance
-
VIX: ~13.25
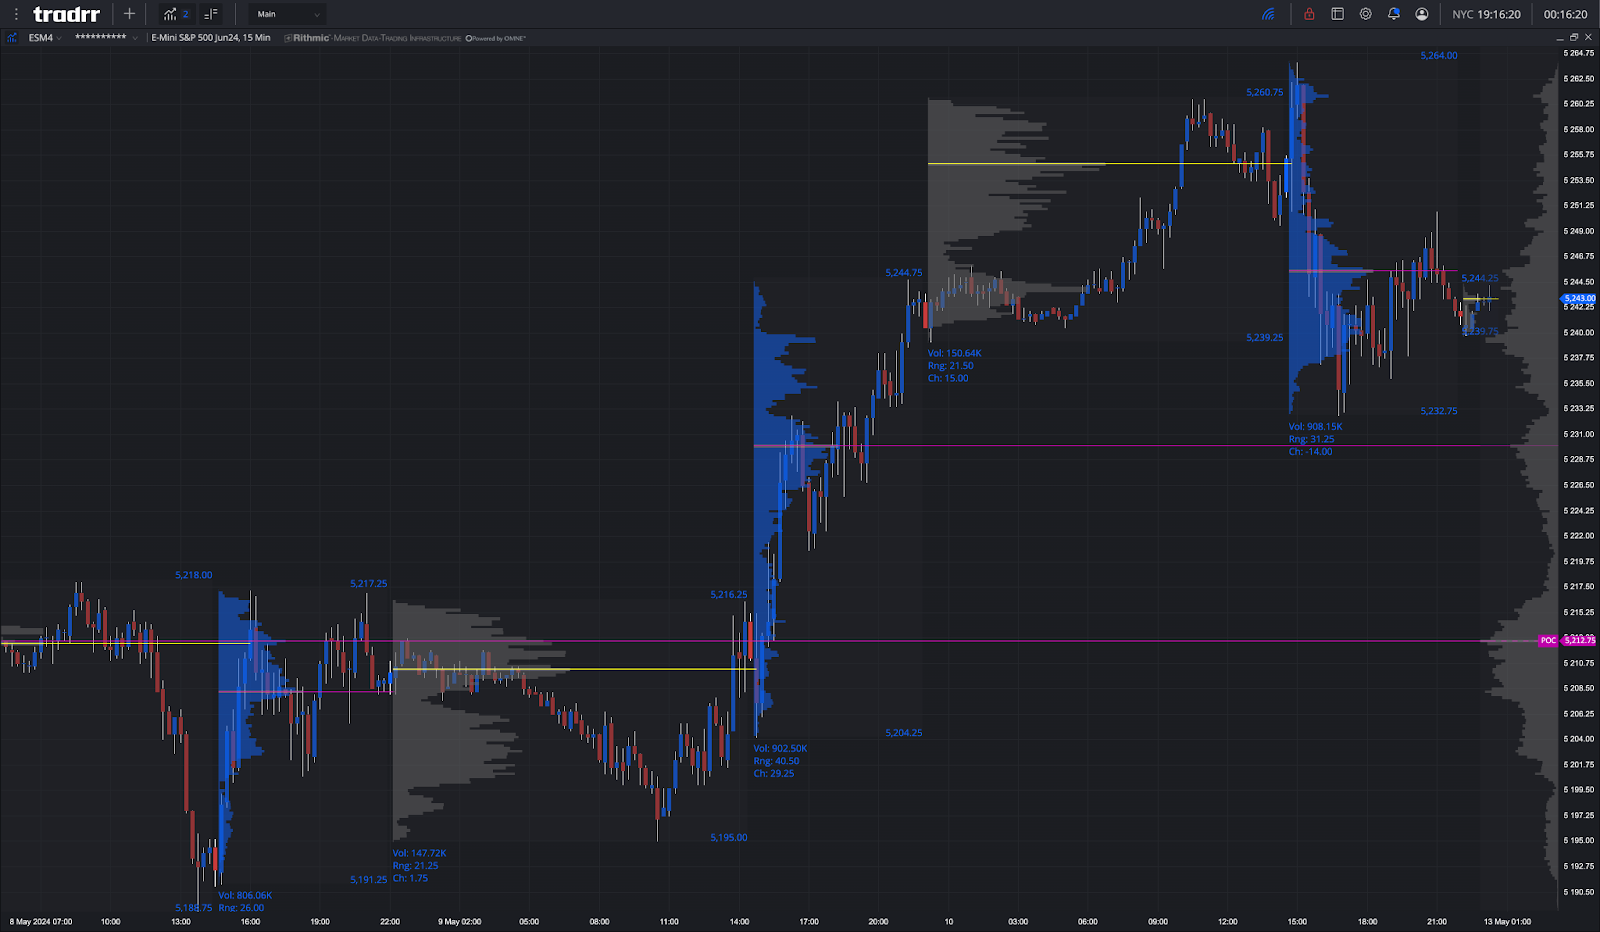
ES

ES Daily
NQ

NQ Daily
Economic Calendar
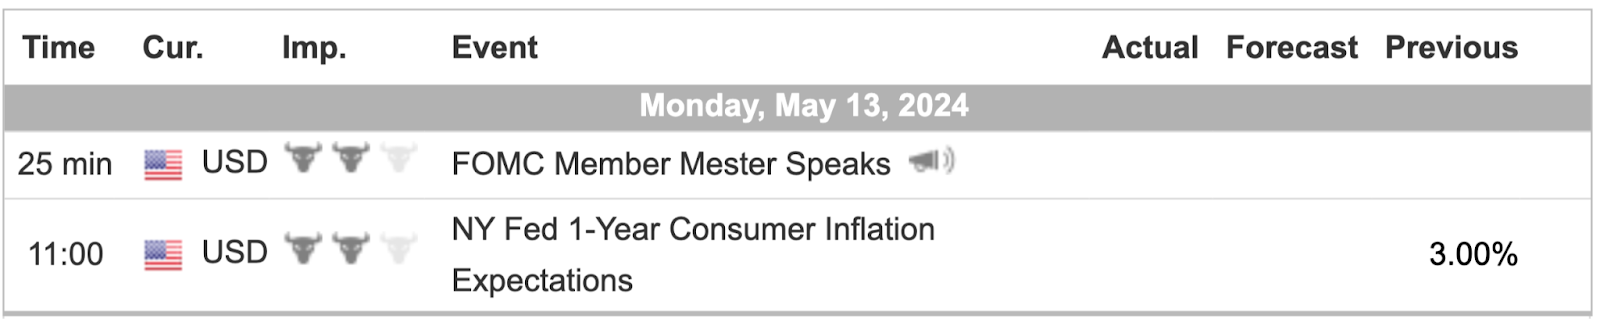
For a more complete Economic Calendar see: https://mrtopstep.com/economic-calendar/
Comments are closed