“Thin to Win” Continues to Work for the Bulls
CPI should drive volume higher
A quick announcement:
Starting tonight at 8 pm ET, we are running a new YouTube series!
Danny Riley and Rich Miller will discuss CPI and other quant stats for the week.
You can follow Mr Top Step on YouTube, visit the link above to set a reminder to notify you, or just visit the link above at 8 pm ET. Either way, I hope to see you there. It should be a good one!
Our View
The YM finally broke its eight day winning streak, its longest of the year and longest since December. While the ES and NQ closed fractionally higher, all 3 indexes are up 3.6% in May.
Overall, 93% of the companies in the S&P 500 have reported results for Q1 earnings. Of these companies, 78% have reported EPS above estimates, which is above the 5-year average of 77% and above the 10-year average of 74%. As the earnings season comes to a close, there are still some big-name reports this week — including Home Depot and Alibaba on Tuesday, Cisco Systems on Wednesday and Walmart on Thursday.
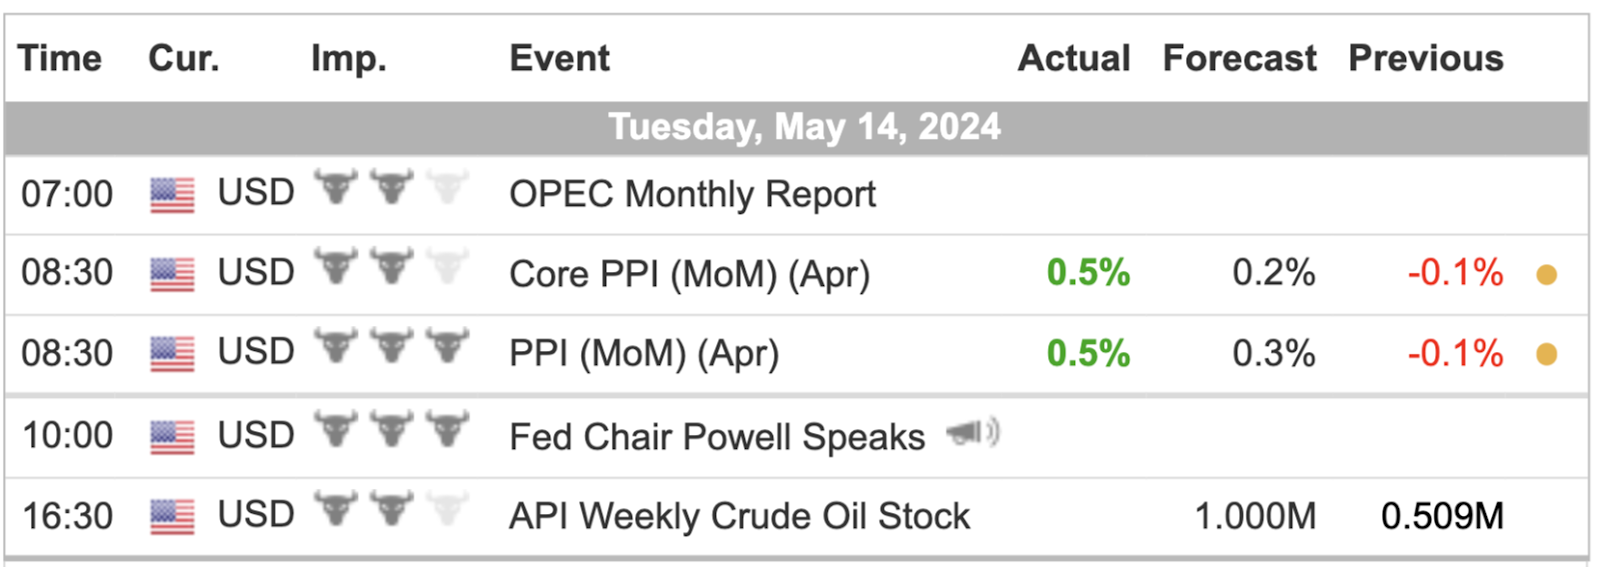
Today’s lone economic report is the Producer Price Index, and Jerome Powell is speaking at the Annual General Meeting of the Foreign Bankers’ Association in Amsterdam at 10:00 a.m. ET.
Our Lean
When I wrote yesterday’s OP, I didn’t know the ES and NQ were going to gap higher and sell off. That said, I did say I wouldn’t “rule out selling an early rally” and that’s what I did. I figured it was going to be slow and range-bound — and it was, with anemic volume.
Maybe we see a pick up in trade today compared to yesterday’s miserable 891k contracts traded. Despite closing up 0.26% yesterday, the NQ struggled to hold the rallies, which definitely affected the ES’s ability to rally. My gut instinct says we should see another day of failed rallies, but if the ES gaps lower, I would look to buy the open or the early weakness and sell the rallies.
I want to share a post from my good friend Jeff Hirsch from Stock Trader’s Almanac.
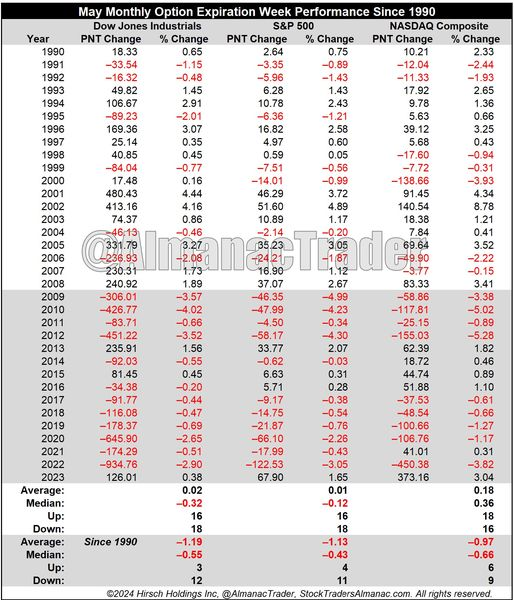
“Since 1990 May’s monthly OpEx week has a slight bearish bias with DJIA and S&P 500 down 18 and up 16. More recently, DJIA has suffered declines in 12 of the last 15, monthly expiration weeks. S&P 500 has one additional weekly gain since 2009, down 11 of the last 15. NASDAQ has declined in 9 of the last 15.”
To get more of Jeff’s content, but sure to visit the link above.
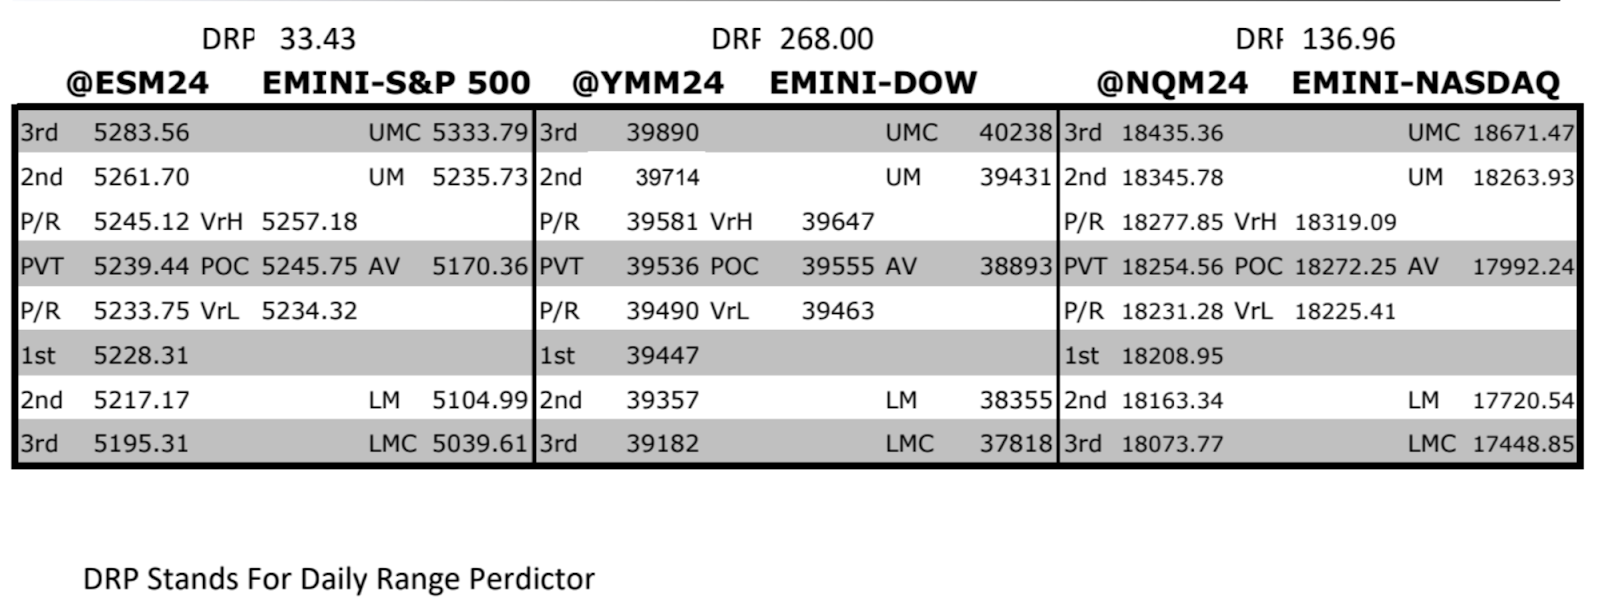
MrTopStep Levels:
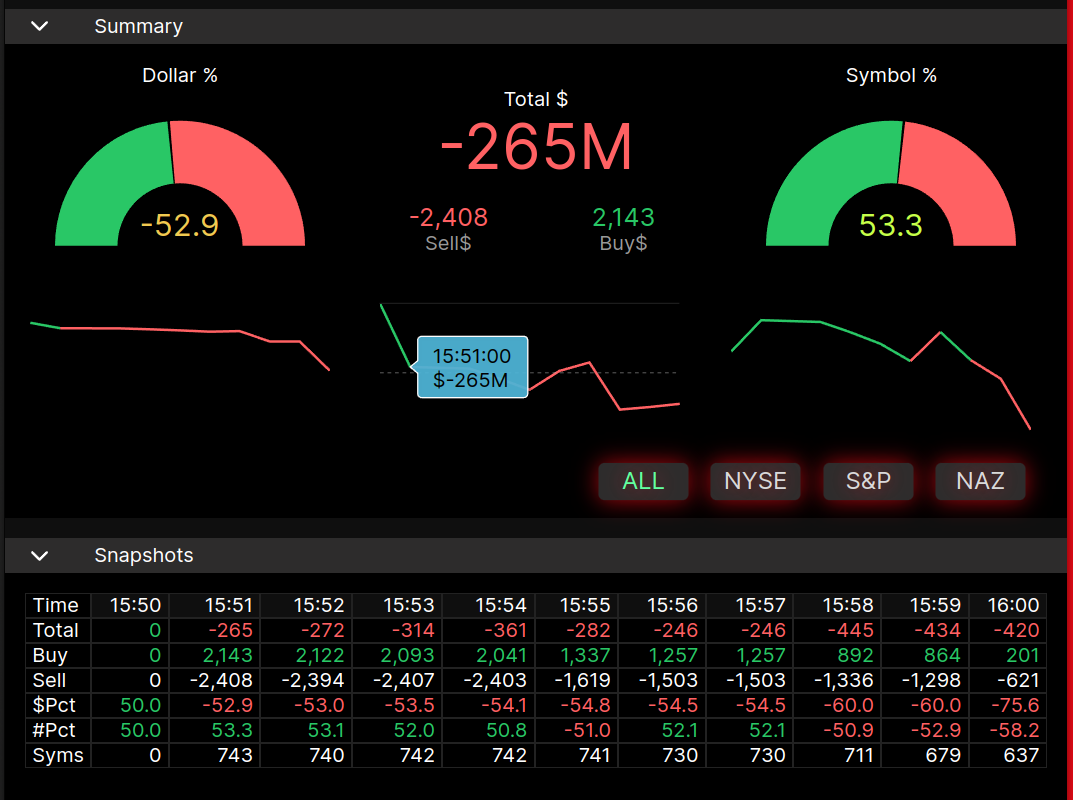
MiM and Daily Recap
ES recap
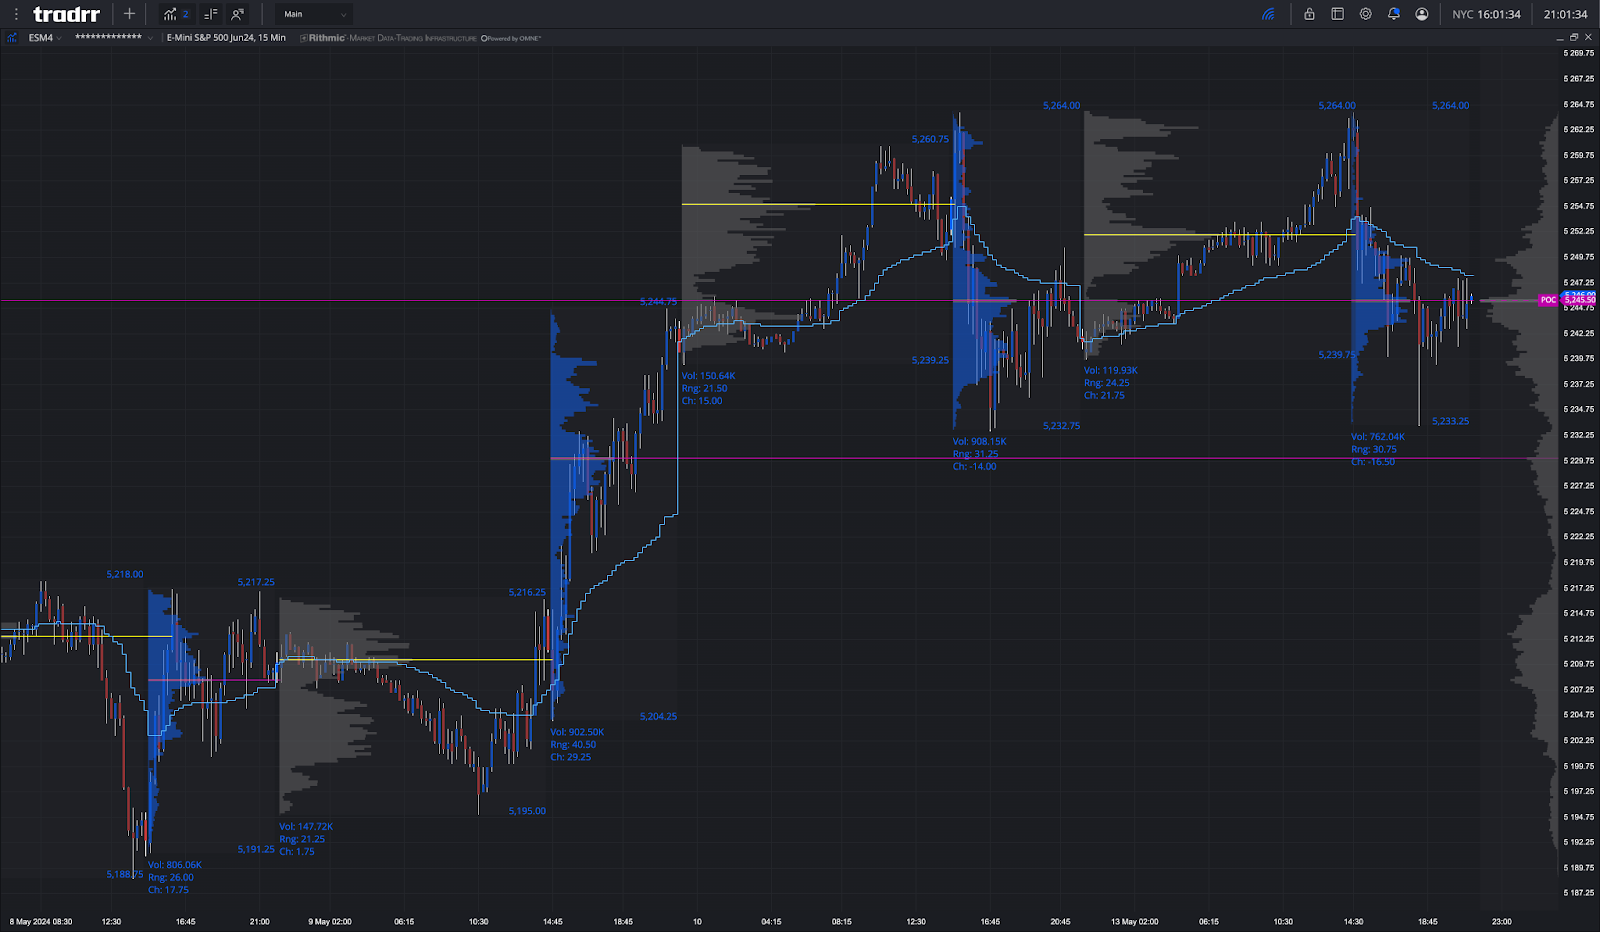
The ES rallied up to 5261.00 on Globex and opened Monday’s regular session at 5262.00. After the open, the ES traded up to 5264.00 and then sold off down to the VWAP at 5254.00. It rallied up to a lower high at 5257.00 and then dropped down to 5247.25 at 9:48. It rallied back up to 5254.75 at 10:30 and then sold off down to 5233.25 at 1:10. As you can see by the recap, the ES is still moving in very narrow, low-volume ranges.
After the low, the ES rallied back up to 5245.25 at 1:35, pulled back to another higher low at 5239.25 at 2:08 and over the next hour and 10 minutes, it slow-walked up the VWAP at 5247.75 at 3:22 as the NQ up-ticked. After the push, the ES pulled back to the 5241.00 level and rallied back up to a lower high by 1 tick and the VWAP at 5247.25 at 3:47 and traded 5244.00 as the 3:50 cash imbalance showed $670 million to sell and traded 5245.75 on the 4:00 cash close. After 4:00 the ES traded 5247.75, pulled back to 5341.75 and settled at 5243.00, up 1.75 points or +0.03%, the NQ settled at 18,286.00, up 46.75 points or +0.26%. Gold futures fell more than 1% and Treasury yields slipped, settling at 4.479%.
In the end, if there is one thing that is apparent, it’s that the public is not trading. In terms of the ES’s overall tone, the best thing I can say is it is holding the higher end of its current trading range. In terms of the ES’s overall trade, volume was extremely low: Only 130k traded on Globex and 761k traded on the day session for a total of 891k contracts traded.
I am going to go back and check all the volumes for the last two years, but I told the PitBull that the streak of low volume is the lowest in a full year — but I think it’s a lot longer. I am sure this is set to change today, but if not, Wednesday’s CPI release definitely will reset the clock.
-
May 1 — 1.955 mil
-
May 2 — 1.573 mil
-
May 3 — 1.604 mil
-
May 6 — 1.019 mil
-
May 7 — 1.106 mil
-
May 8 — 1.013 mil
-
May 9 — 1.095 mil
-
May 10 — 1.094 mil
-
May 13 — 891k
Technical Edge
-
NYSE Breadth: 69% Upside Volume
-
Nasdaq Breadth: 74% Upside Volume
-
Advance/Decline: 51% Advance
-
VIX: ~13.75
Guest Post — Niels from Tradrr
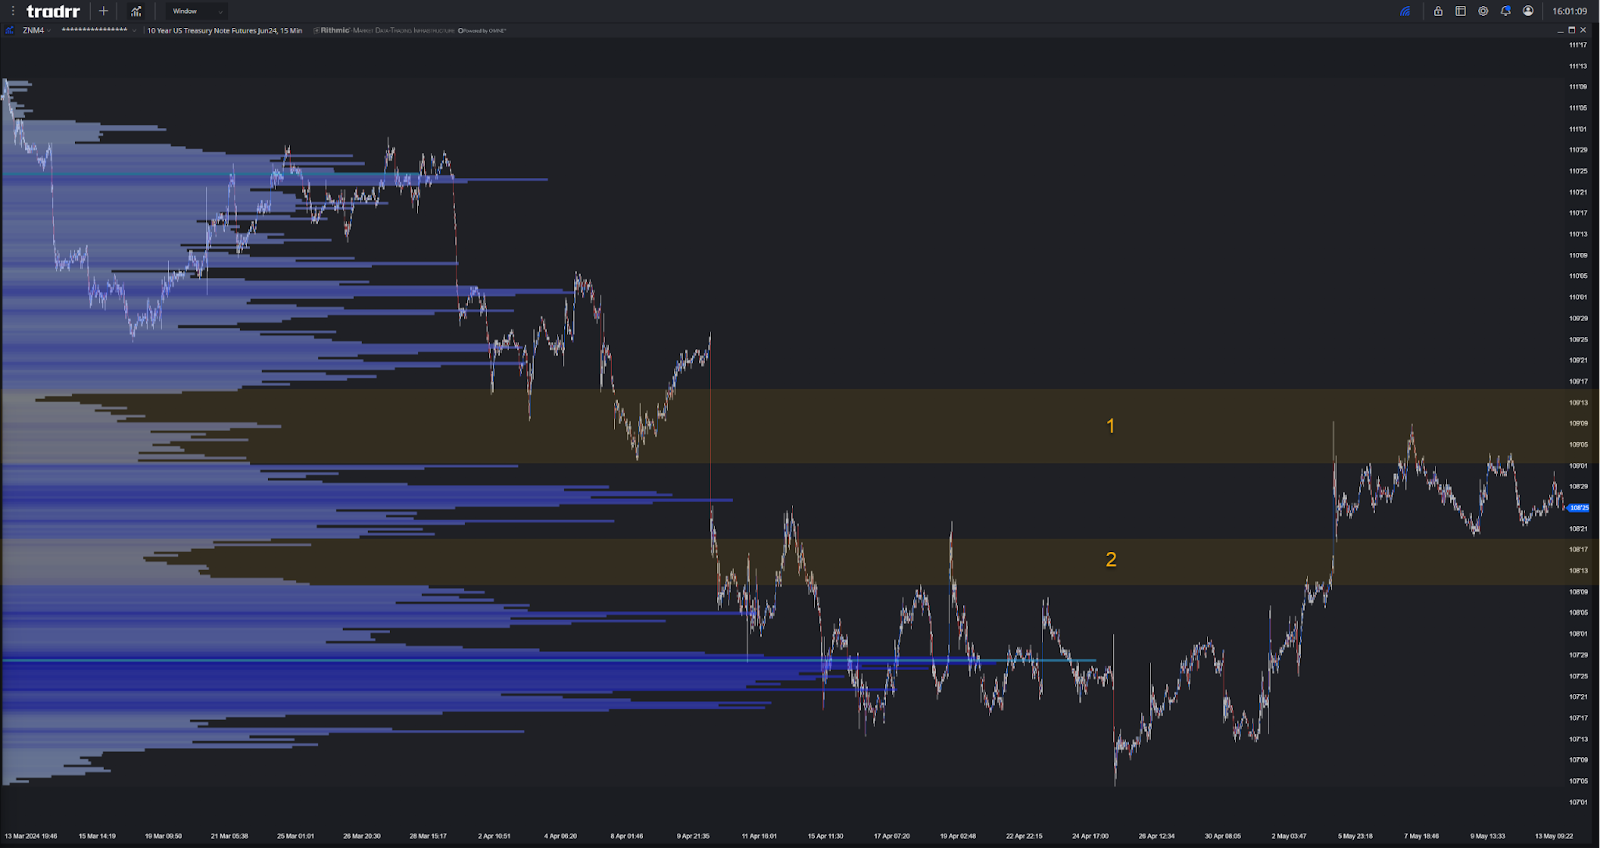
The majority of 2024 have pointed for the Fed to take a more hawkish stance left the market open to a surprise as Powell stated it unlikely for the next policy rate to be a hike and that the current rate environment needs more time to work itself out whilst keeping rate cuts seemingly on the table. The latest meeting has placed the 10 year notes in a potential bottoming state giving the month of May an opportunity to fill back in the Low volume nodes left behind the 2 months prior.
Coming into this month’s PPI and CPI reports will let us gauge how participants consider breaking the volume node formed protecting the lows from Powell’s statements and pause to collect more information in regards to how inflation indicators are placing potential yields.
Do we gain HOT numbers and push ZN lower like the 2 months prior or do we balance out both nodes for some more defined comments from the Fed. Best to wait for the breaks and retest of Nodes keeping risk on the other ends to aid in bias for the intraday sessions this week.
For more info from Tradrr, please find it here.
Economic Calendar
For a more complete Economic Calendar see: https://mrtopstep.com/economic-calendar/
Comments are closed