Breaking Down Friday’s Late-Day Surge
Follow @MrTopStep on Twitter and please share if you find our work valuable!
Every week, MrTopStep invites traders to an “Own the Close” contest where the closest guesstimate where the SPX will settle on Friday’s 4:00 cash close.
The winners get a free week’s access to the MrTopStep Chat and trading tools. Enter your guess now!
Our View
I admit to having a rough time writing and trading the ES over the last few weeks and it doesn’t make me happy. While I didn’t catch the down move, I also didn’t get bearish after it sold off — which would have been the ultimate mistake. Going into Friday’s number, no one was talking about the options expiration and for good reason because the 0DTE options have not produced much volatility lately.
Due to the quieter, low volume expirations over the last few months, all that changed Friday when the markets exploded higher into the close. Last November, 0DTE were the hottest thing going — even Goldman Saches complained about them as they extended to the exchange-traded fund market in 2023.
Now the 0DTE in the commodity markets, gold, silver, oil, natural gas and long-term Treasuries. What we know is when the markets are moving, 0DTE is involved. I said in the MrTopStep room late when the ES shot up, gamma was clearly part of the move and you could see it in the S&P futures volume.
This week there are 16 economic releases and zero Fed speak with the big number of the week coming on Friday with the monthly jobs report.
Our Lean
According to the Stock Trader’s Almanac, the first trading day of June has the Dow up 28 of the last 38 occasions. Additionally, June ends the Nasdaq’s best eight months. The summer rally in most years is the weakest rally of all four seasons. The week after the June Triple Witching has the Dow down 26 of the last 32. The S&P is up 12, down 9 with an average loss of 0.80% ranks eleventh. Summer doldrums begin late in June.
That all said, June is better in election years.
I live and die for the stats that work, especially when there are extreme overbought or oversold conditions and I do think the ES was oversold. However, Friday was also part of an end-of-the-month rebalance and loads of short option gamma to buy.
But let’s back up.
The ES rallied 101.50 points, with 60 points of that rip in 30 minutes. Neither the NQ or the ES acted that great and that’s what the public gets to think. The ES was down 4 of the last 6, but that wasn’t because every large trading desk held billions of dollars in ETFs on the close — we can call this the “cause,” but it’s the “effect” part of the equation we all want to know.
I have been following price action in the S&P futures for over 35 years and I don’t care what anyone says, the ES goes first, meaning the boys with the better theater seats buy futures too. Once buying started and the ES started to jump, the short-call sellers and put buyers go from closing out the books for a gain to an all out scrabble. All the clearing firm margin departments start scrambling too, monitoring large short positions for possible liquidation of a large margin call. As the cash rolls in, major algorithmic and high frequency programs light up like the Fourth of July and set off thousands of buy-stops and buy programs.
This is what I call part of the “new world trading order,” where there are no rules and you can’t tell me that there wasn’t a lot of front-running. When you have several desks all executing the same order they end up racing each other.
Our Lean
I don’t doubt there will be future let downs, but I think we are going higher. You can sell the gap ups/early rallies and buy the pullbacks or just be patient and buy the pullbacks. The 50% retracement of FRYdays rally is at 5256. I would be surprised if we go there, but based on Friday’s price action, nothing can be ruled out.
MrTopStep Levels:
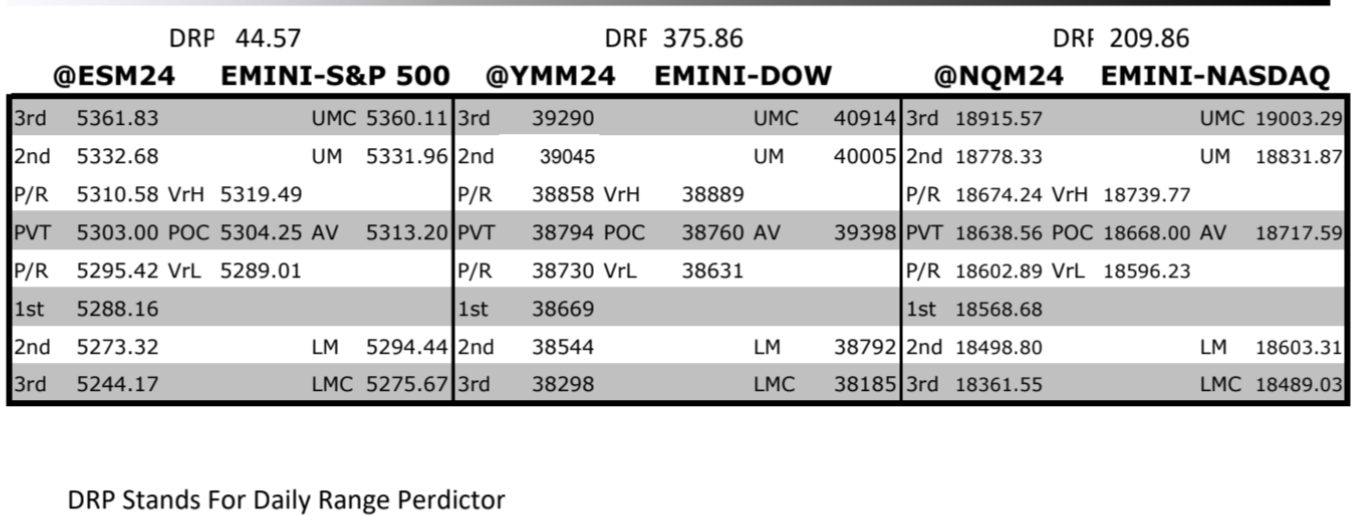
MiM and Daily Recap
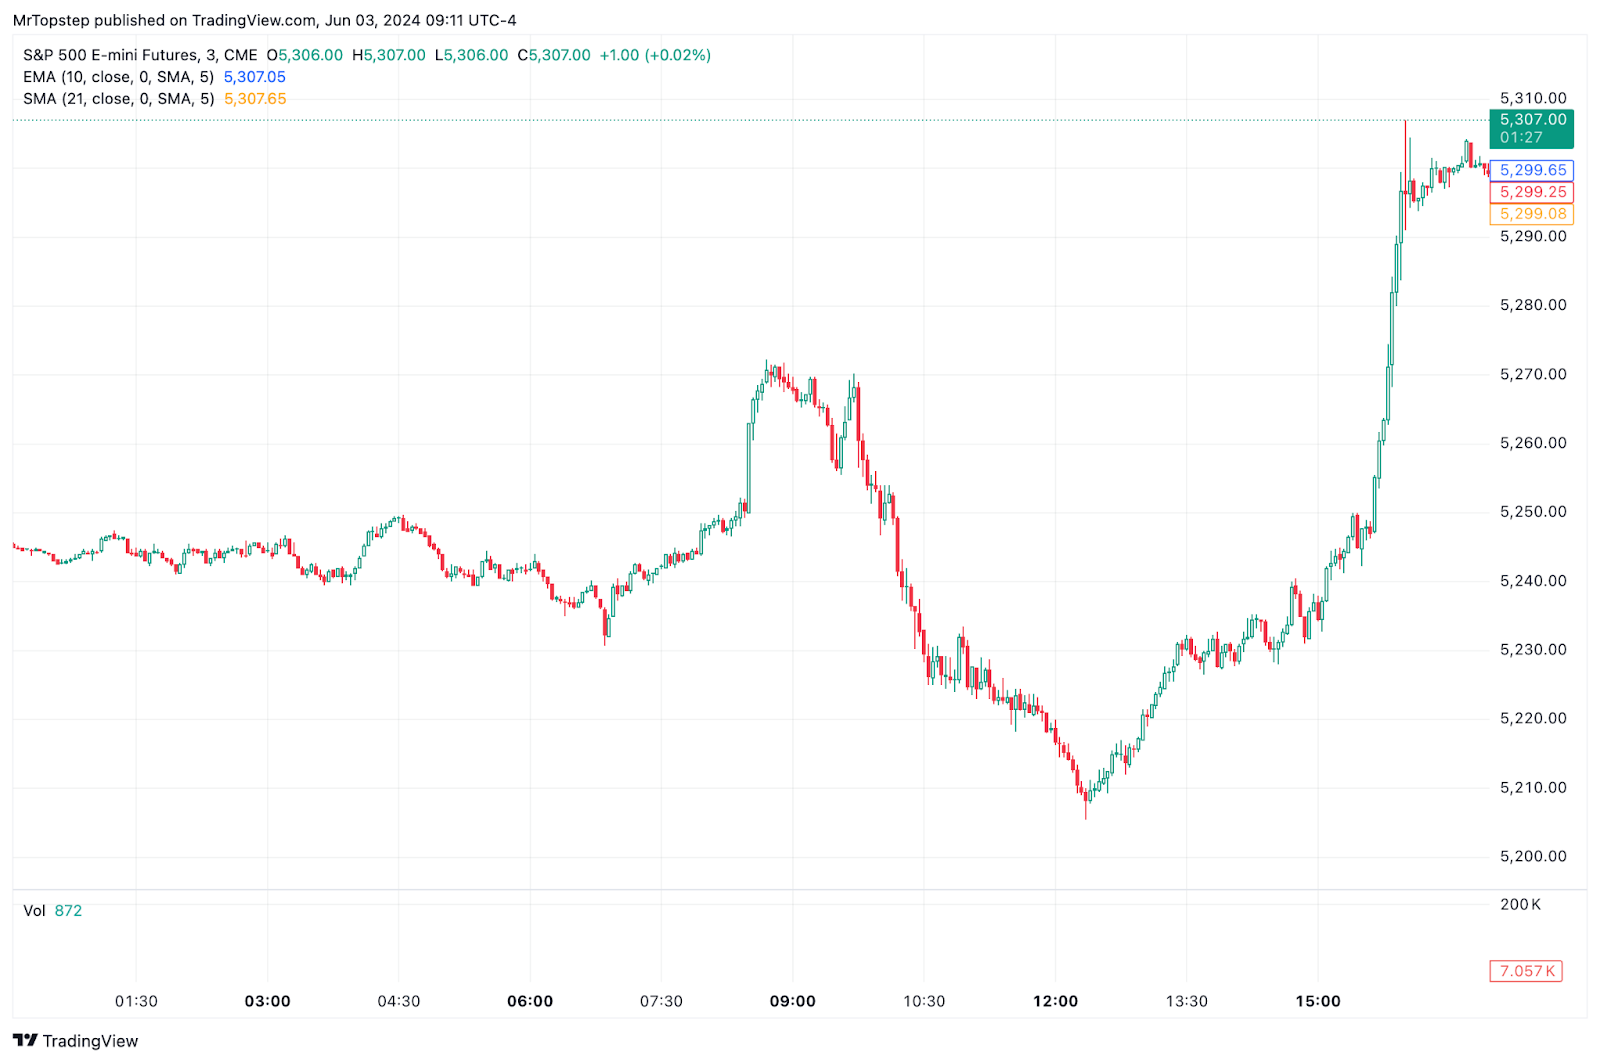
The ES traded up to 5249.50 at 5:00 am, traded back down to 5230.75 at 7:00 am, traded up to 5248.50 at 8:00 am and shot up to 5272.25 after the 8:30 release of the PCE price index. Excluding food and energy, costs increased 0.2% in April and 2.8% from a year ago and the ES opened Friday’s regular session at 5257.75.
After the open, the ES traded 5261.75, pulled back to the 5257.25, rallied up to the high of the day at 5270.25, bounced back up to a lower high at 5269.00 and then made a series of higher lows all the way down to 5205.50 at 12:30. For the next 2.5 hours, the ES did a slow upside back-and-fill and printed 5240.50 at 3:00, did a small down-tick, traded up to 5249.50 at 3:30 and then the fun began with the late day options gamma.
The next bar pushed the ES up to 5261.25 and traded 5269.00 as the 3:50 imbalance showed $5.7 billion to buy and traded up to 5299.50 at 3:59 and traded 5294.50 on the 4:00 cash close. After the 4:00 cash close, the ES ran up to 5307.00 and pulled back to 5292.26 at 4:15.
From its 12:45 low of the day at 5205.50 to its 5307.00 high, the ES rallied 101.50 points, but from its 3:30 5241.75 low to 5299.50 at 4:00, the ES rallied 57.75 in 30 minutes and to its 5307.00 print at 4:15 the ES 65.25 points. The ES settled at 5299.25, up 46.25 points or +0.88%, the NQ settled at 18,570.75, down 35.75 points or -0.19%, the YM (Dow futures) settled at 38,825, up 594 points or +1.55%, and the RTY (Russell futures) settled at 2,080.20, up 19.20 points or +0.83%.
The yield on the 10-year note ended at 4.512%, down from 4.55% on Thursday and the year-to-date high of 4.706% hit in late April. Gold settled at 2,347.70, down 18.8 or -0.79%, crude oil settled at 77.18, down 0.73 or -0.94%, and Bitcoin settled at 68,030, -1,315 or -1.90% on the day. Everything was moving.
In the end, it was a big gap-up, a big selloff and a mammoth late-day rally. In terms of the ES’s overall tone, whatever was going on the last 5 sessions got wiped out. In terms of the ES’s overall trade, volume was the largest since April 19th at 2.357 million, with 340k traded on Globex and 1.96 million traded on the day session.
Technical Edge
-
NYSE Breadth: 67% Upside Volume
-
Nasdaq Breadth: 55% Upside Volume
-
Advance/Decline: 78% Advance
-
VIX: ~13
ES

ES Daily. Levels in “Our Lean”
NQ

NQ Daily. Levels in “Our Lean”
Economic Calendar
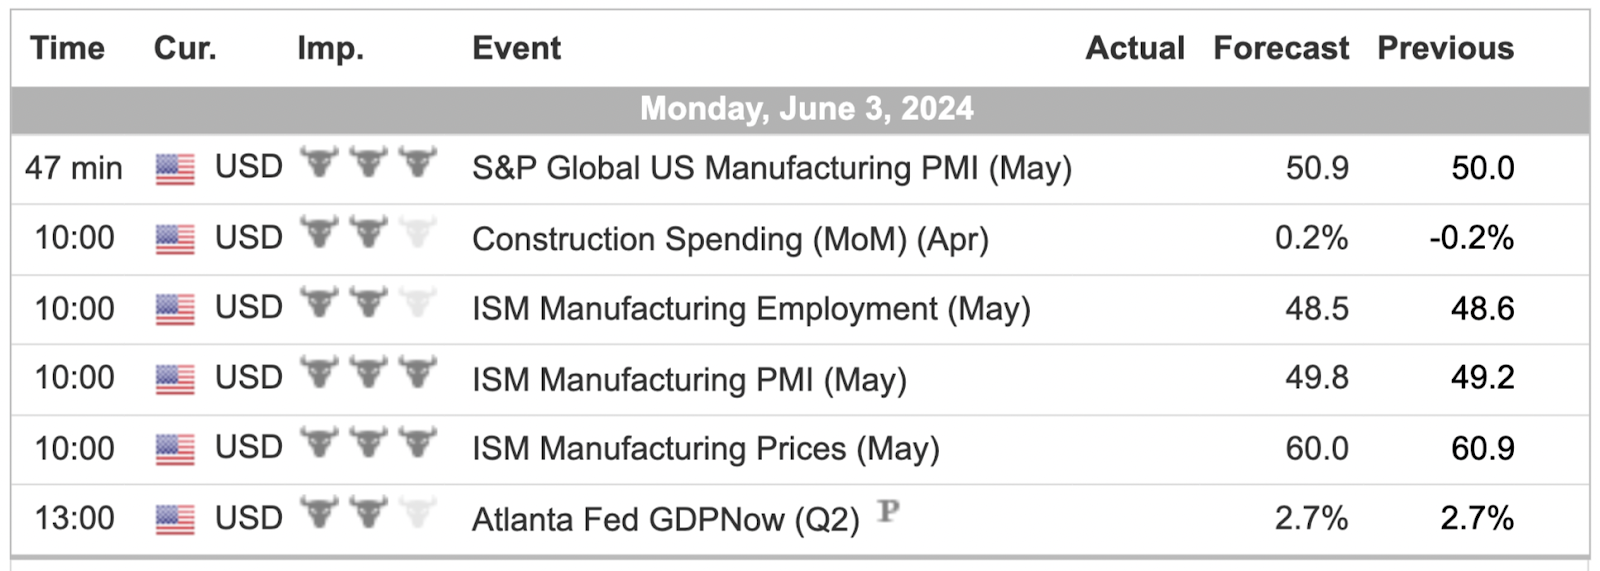
For a more complete Economic Calendar see: https://mrtopstep.com/economic-calendar/
Comments are closed