The Bull-Trade Is Tiring, But Still Working
The upside still has momentum
Follow @MrTopStep on Twitter and please share if you find our work valuable!
Every week, MrTopStep invites traders to an “Own the Close” contest where the closest guesstimate where the SPX will settle on Friday’s 4:00 cash close.
The winners get a free week’s access to the MrTopStep Chat and trading tools. Enter your guess now!
Our View
Retail sales increased at a slower pace in May and production at US factories increased more than expected in May. This my friends is the world we live in. Where everything is evolving and nothing stays the same. Despite some parts of the economy doing well, I think interest rates and geopolitical problems remain front and center.
I still think we see higher prices, but I will say one thing: there were times when the ES and NQ acted tired. Not that they didn’t go down — they did — but there was not much ‘snap’ in the snapback department…it was more like a low-volume grind.
And guess what? The summer trade hasn’t even kicked into gear yet.
Speaking of summer, a recent survey suggested that nearly 82% of Americans plan to travel this summer, which could be more than 212 million adults throughout the season. This number is down from summer 2023, with 3% fewer people intending to travel at least once this summer as of April 22, 2024. I can’t wait to see what that looks like.
Our Lean
Ideally, I want to buy a lower open or the first drop after a gap-down open. If the ES gaps higher, I want to sell the open or the first rally above the gap-up and buy the drop. I want to look for a place to get long, keeping in mind Friday should be a down day.
A guy I like to follow is Sam Stovall, chief investment strategist of CFRA Research. Stovall recently said the S&P is in for a 5% drop, and warned that the market could see its first “crack on the ice” in the tech sector.
He finished off by saying “It’s only been tech that’s been outperforming the market. I sort of feel this is a jumbo jet that’s flying on one engine, and you wonder how long it will stay aloft,” I think it’s fair to say most people feel this way.
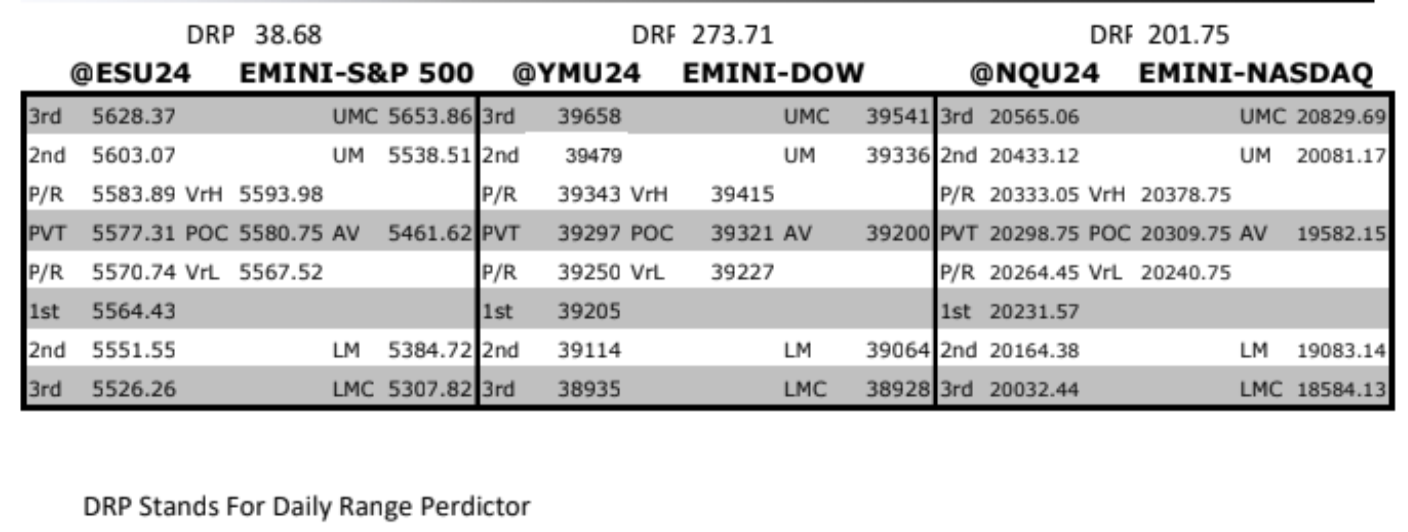
MrTopStep Levels:
MiM and Daily Recap
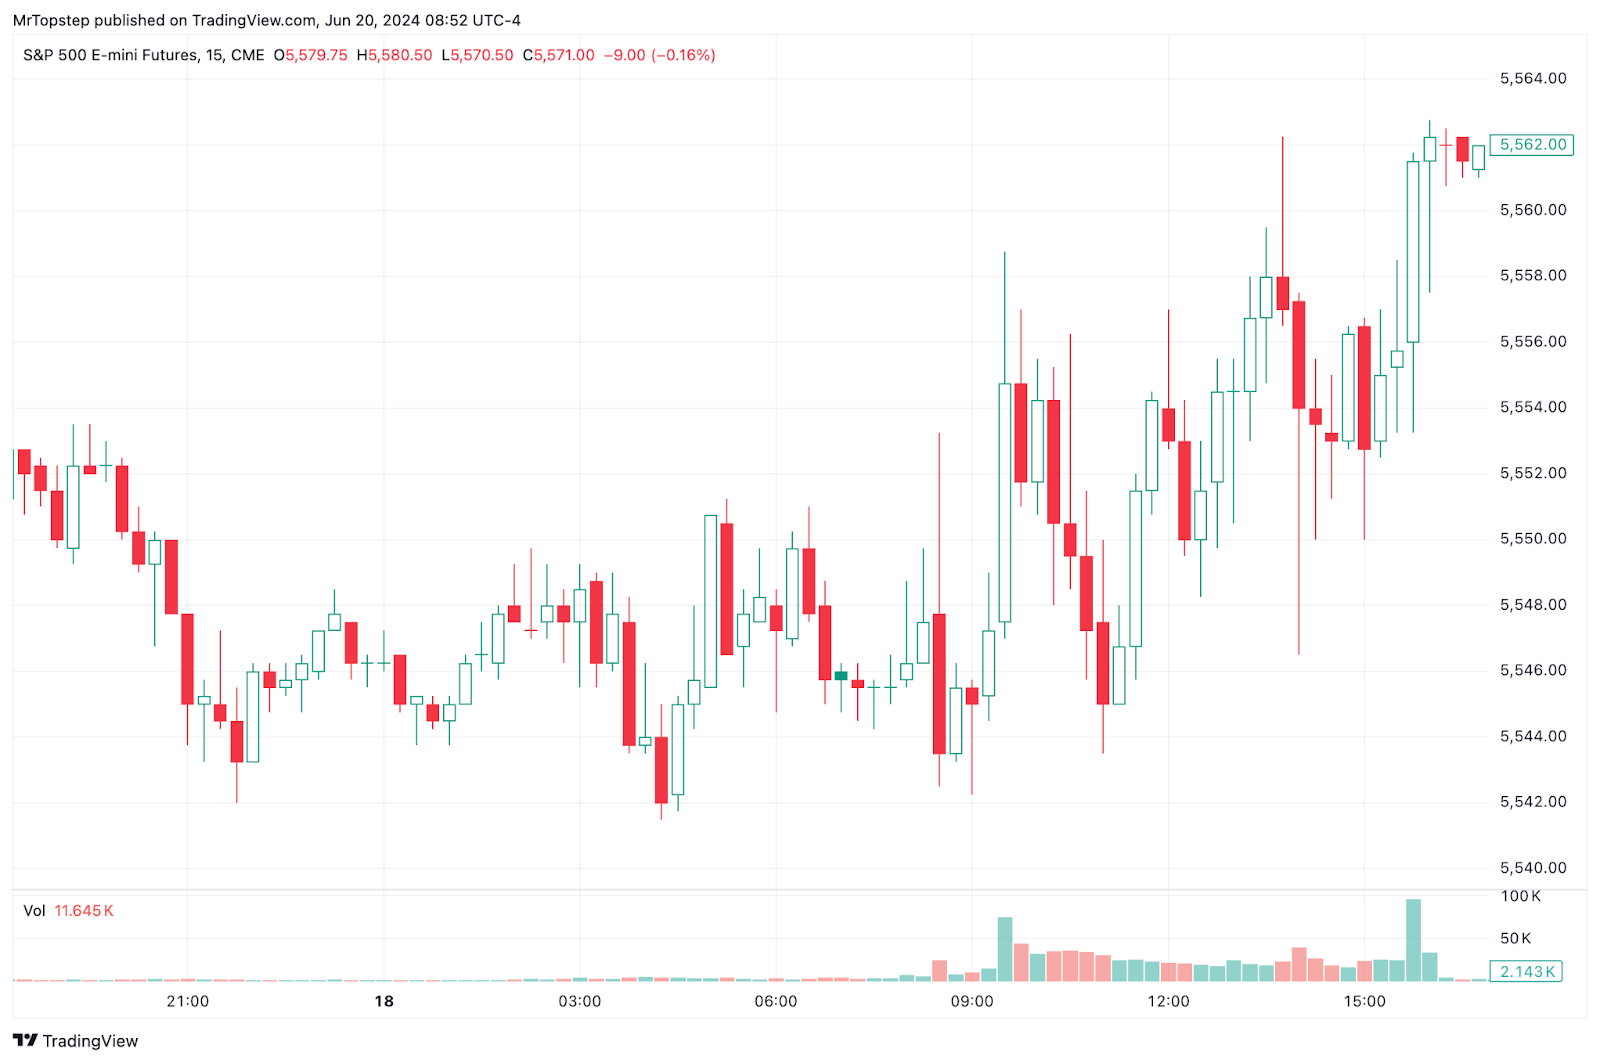
ES Recap – 15 min
The ES traded down to 5441.50 and opened Tuesday’s regular session at 5447.50. After the open, the ES traded 5546.75, quickly rallied up to 5558.75 and then sold off down to 5548.00 at 10:30. From there, it rallied back up to 5555.50 at 10:40 and then sold off down to a new low at 5443.50 at 11:15. After the low, the ES rallied up to 5557.00 at 12:10, sold off down to 5548.25 at 12:35 and then rallied up to 5555.50 at 1:00.
After the push, the ES sold back down to 5550.50 and then rallied up to 5558.00 at 1:25 after the 20-Yr note auction came out with an A+ rating. After a small pullback, the ES rallied up to a new high at 5562.25 at 1:55 and then puked down to 5446.50 at 2:05, rallied back up to 5557.25 and then traded 5550.50. From there, it traded back up to 5556.75 at 3:05, traded down to a 5550.50 double bottom, rallied up to 5558.25 at 3:38 and traded 5554.00 as the 3:50 cash imbalance showed $650 million to sell, traded 5561.50 at 3:57 and traded 5561.50 on the 4:00 cash close. After 4:00, the ES chopped in a narrow range and settled at 5959.75, up 13.5 points, while the NQ settled at 20,196.25.
I am going to keep this short and sweet…In the end, it was choppy and filled with rotations. In terms of the ES’s overall tone, it acted firm. In terms of the ES’s overall trade, most of the concentration was in the spreads: 788k traded in the ESM and 1.558 million traded in the ESU. Crude oil rose to $81.00, gold fell to $2,342.70, and Bitcoin gained back some ground to $65,650, up 0.91% on the day.
Wednesday’s trade was uneventful. The total Globex range was a low at 5559.75 and a high at 5567.00, 7.25 points, the day session day session low was 5560.00 and the high was 5566.50, with a 6.5 point range and closed at 5561.75, -0.25 points on a total volume of 131k.
Technical Edge
-
NYSE Breadth: 57% Upside Volume
-
Nasdaq Breadth: 56% Upside Volume
-
Advance/Decline: 56% Advance
-
VIX: ~12.50
Guest Post — Dan at GTC Traders
Shorting All-Time Highs?
It has been incredible to witness this rally in risk. Congratulations are in order to anyone that grabbed this recent leg higher.
Last week, we had stated that we were looking at buying at 5200 if we had a mean-reversion to that structure…As we know now, that mean-reversion never came, and we moved higher still
So what now? We are actually looking to layer in a short. But when?
Typically? We look for a ‘break’ in the momentum that is carrying the market to new highs. To be clear, we do not believe in ‘the best’ indicator, and we’re not even fans of technical analysis to be truthful. We do believe in using a technical overlay (different matter) to highlight potential opportunities.
Break in Momentum
Until we find a break in this upwards momentum? There is no reason to attempt to short this market. Our longer-term Core positions (we keep a basket of 18 longer term yielding instruments) have no hedge at the moment either. So we have been allowing these Core positions to run higher as the market runs higher.
We at least need to find a ‘chip or a crack’ in the armor of the bulls. If we do not spot this ‘chip or crack’? Simply allow our longer-term holds to move higher still.
What are we looking for?
As stated, while we do not believe in Technical “Analysis” to predict the future? We do look at well respected technical overlays that the market has respected for over a generation.
VWAP. Pivots. Structures.
These are tools and overlays that have been used, and respected by markets for generations.
In the case of the E-mini?
We particularly use the Weekly Central Pivot as a type of ‘brake’ and tell, regarding longer-terms trends. And to be honest, we really don’t use the other pivots. To keep things simple? That is the only overlay we use. As long as we continue to trade above the Weekly Central Pivot, that we highlight in pink? We view the trend as intact.
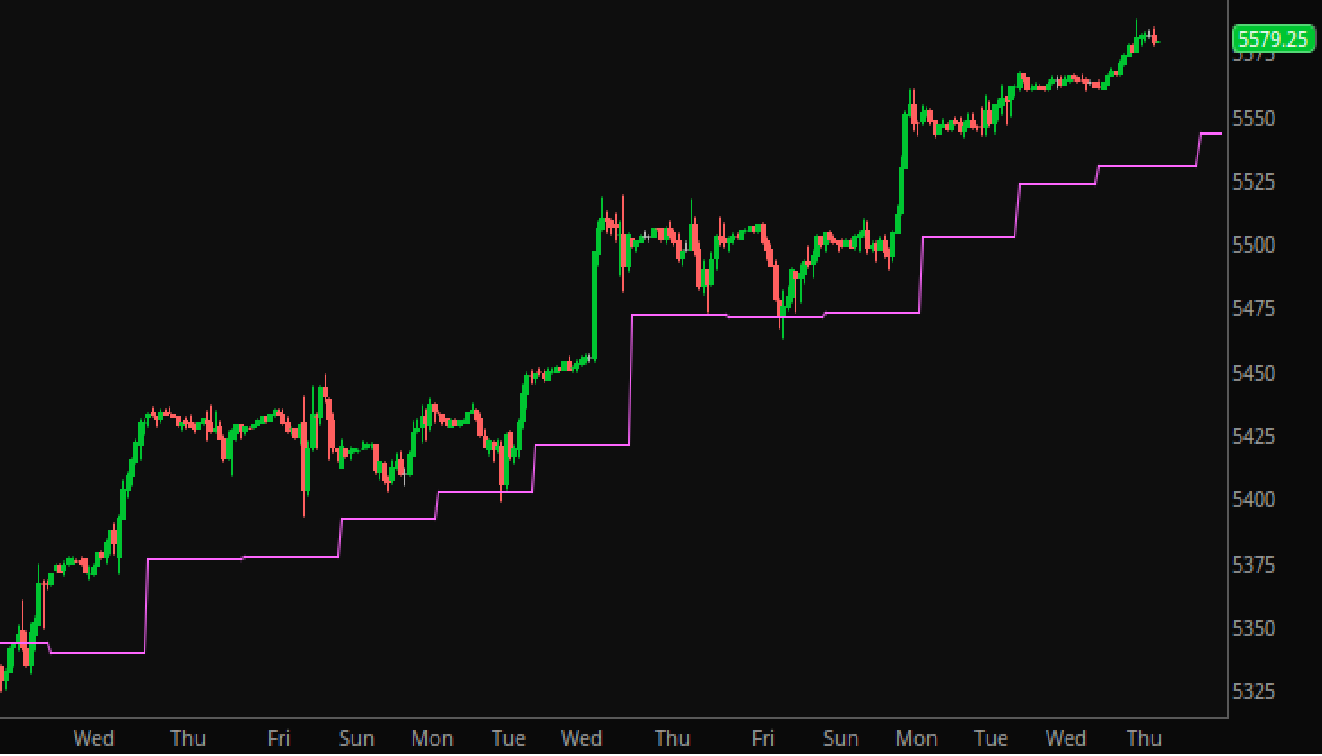
E-Mini – 1 Hour Chart
Until we see a break in that upwards momentum by trading consistent, with volume, below that Weekly Central Pivot? We see no reason to attempt to short the market; to attempt to play a mean-reversion trade lower. In fact, the Weekly Central Pivot has been providing fine structural areas to buy the market in this recent rally.
If You Feel You MUST Short the Market
We’re all traders. We get it. At times, you want to layer in a short, even without a break in momentum. Ok.
If one feels one must short the market? We feel it is best to do so with Options.
Naked calls for some reason seem to garner a lot of ‘hate’ by traders; and we do not understand the reason for this. Many traders will use options as cash-covered puts. In other words, selling puts on a stock they would like to own anyway. If they want to own 300 shares of PLTR, then simply keep selling 3 puts at the 20 deltas until they are assigned. If not assigned, then they are paid the premium for the idea of being long the stock; and collecting premium as income until such assignment takes place.
But then the same traders have a problem with selling calls naked. We would never sell calls naked, as we have stated in our video entry “simply because they are at the 15 deltas” as some sort of iterative way to simply collect premium
However, we would sell a call at an area that we would be comfortable being short 100, 200 or however many shares short of the SPY; provided one has the capital to do so.
At the moment, if one is comfortable being short at the 565 region of the SPY? One could sell the .12 delta, July 12, 2024 SPY Call Options for around .75 per ($75 per 100 shares short). There is only a 26.37% probability of touch as the variables exist this morning. And if assigned, short 100 shares per option sold at that level.
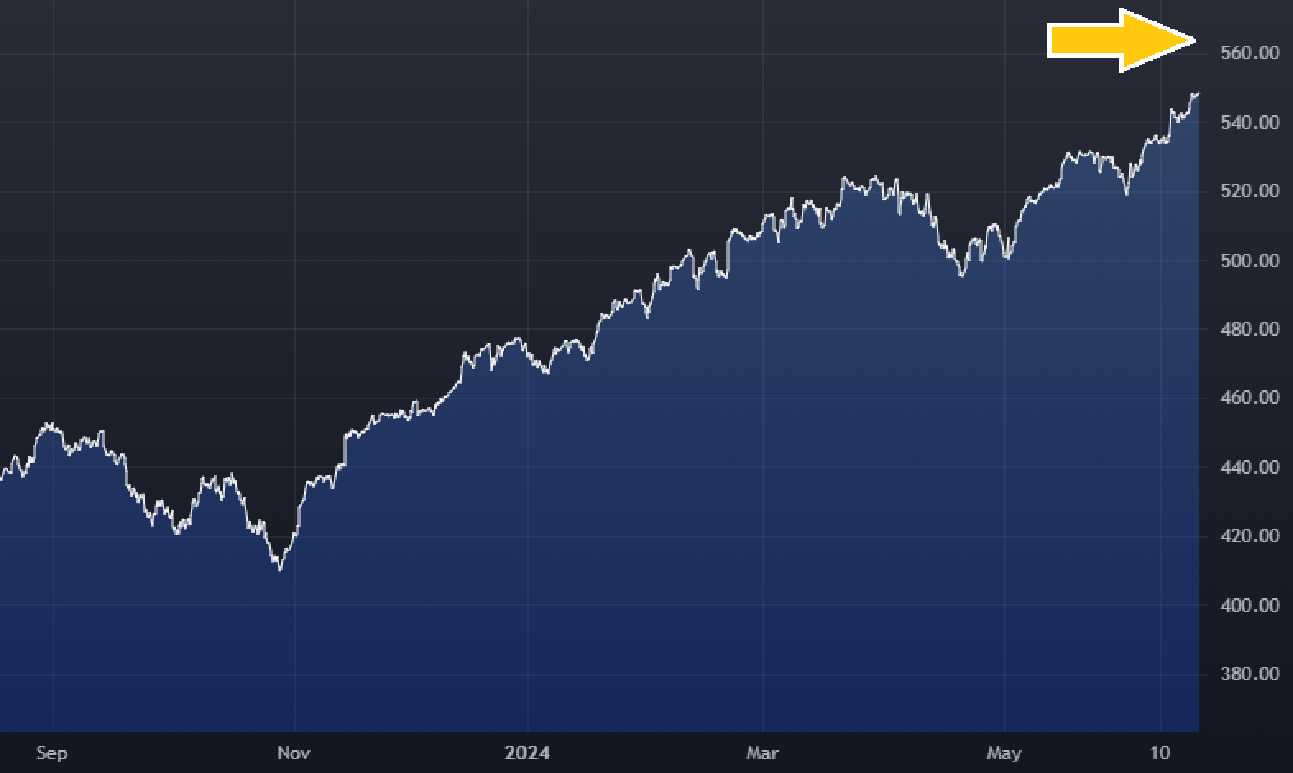
SPY
That is, if one feels one must layer in a short.
We prefer to wait for a break in momentum; and allow our long positions to move higher
Stay safe and trade well …
Economic Calendar
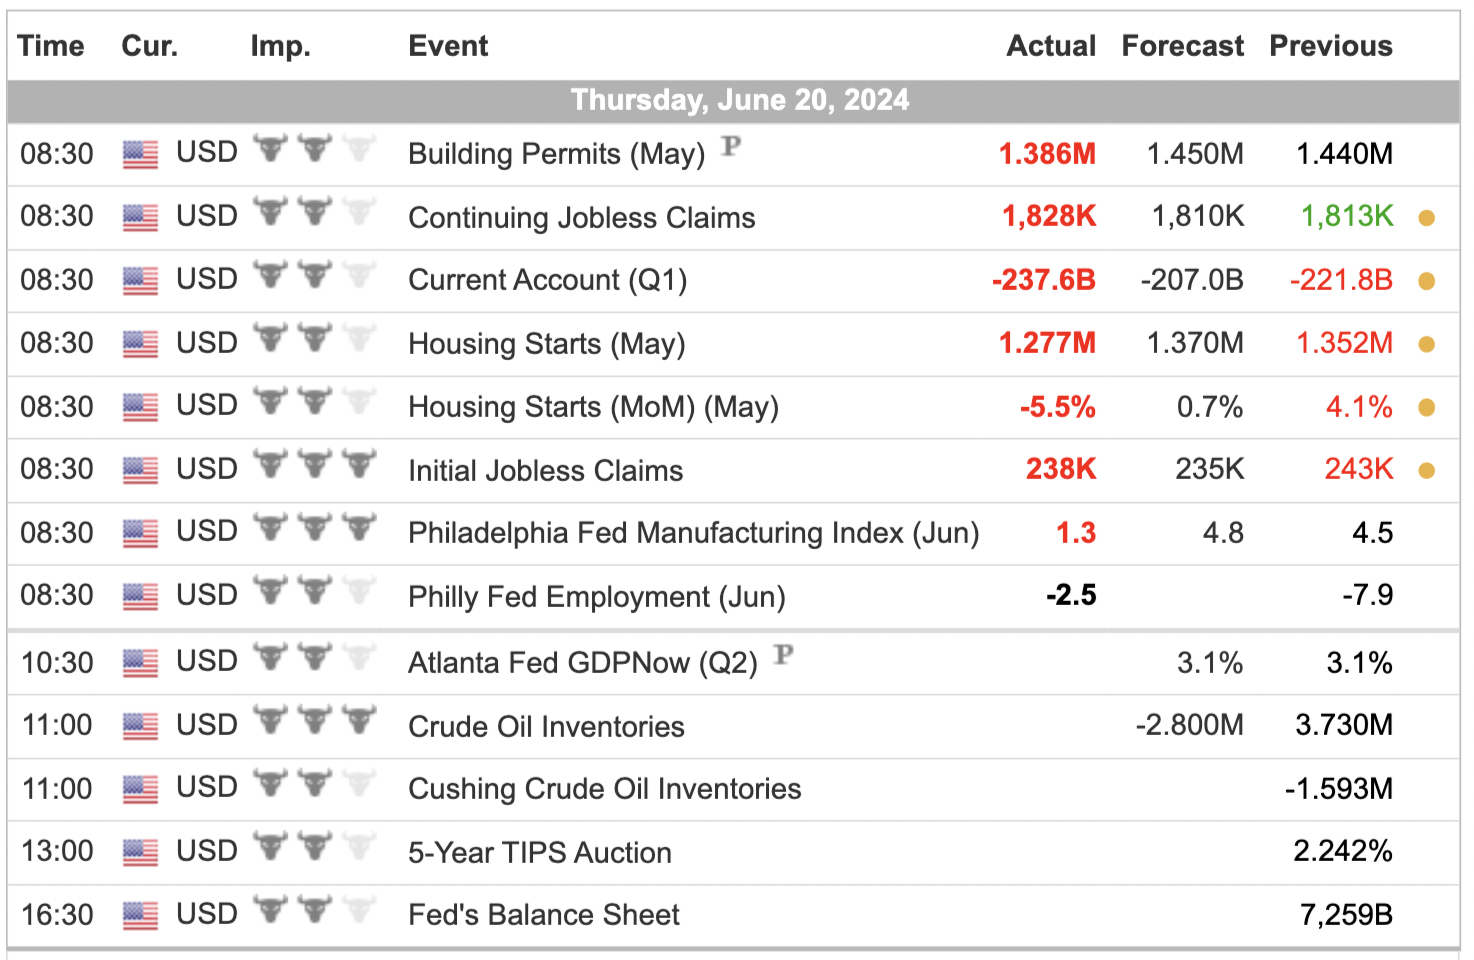
For a more complete Economic Calendar see: https://mrtopstep.com/economic-calendar/
Comments are closed