Using Caution Into Triple Witch Expiration
Tech sways the indices
Follow @MrTopStep on Twitter and please share if you find our work valuable.
Our View
I may post stories, but to tell the truth I don’t read a lot of them. I also do not have CNBC, FOX or Bloomberg TV running… ever. I have learned that even if I did get the story quick, the headline news algos would be way in front of me.
Unlike the S&P pit there is no free, low-hanging fruit to cherry pick. Right now, the S&P and Nasdaq are trading at the highest they have ever been and the PitBull said he has an Elliot Wave chart that warns of the ‘tech stock Hindenburg’ — Harry Dent who predicted the 2008 credit crisis — says we are in for the ‘bubbles of all bubbles.’ There are even mentions of a ‘black swan’ event’ and JPMorgan analysts are raising alarms about a repeat of the dot-com crash.
The PittBull says he can’t believe we won’t correct at some point before the election. I have been talking about how we are well past the 2000 Tech Bubble. I agree that the markets are floating on air, too. After the stock split, NVDA rallied up to $140.76 — that’s $1,400.76 pre-split. Shares hit that high yesterday, but closed lower by 3.5% at $130.78.
I kinda sensed there was something out of whack on Tuesday’s OP and after a 6-point holiday trading range, the ES and NQ jumped to another set of all-time contract highs Wednesday night into Thursday morning. After the gap-up, both the ES started to fail and despite some good rips they continued to be sold.
I am not looking for a Hindenburg, but I do have reason to be concerned. Apple, Microsoft and Nvidia have a combined market cap of almost $10 trillion and make up over 20% of the S&P 500.
To me, that’s concerning. Let’s face it, there are ~500 stocks in the S&P but 15 make up the majority of the gains. Like my old saying says, “I’m a bull, but I aint no fool!”
Our Lean
Did the markets act bad? I don’t know, they act like I have said — tired. The weakness in the bonds and notes did not help.
I think this comes down to two things: The slight tone changes and the June Triple Witching Options expiration. I’m not bearish as much as I am cautious we could see further downside.
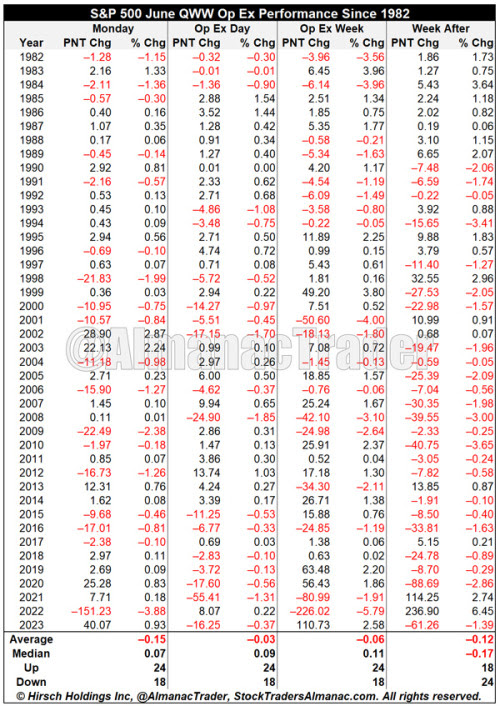
This is from my good friend, Jeff Hirsch at Almanac Trader:
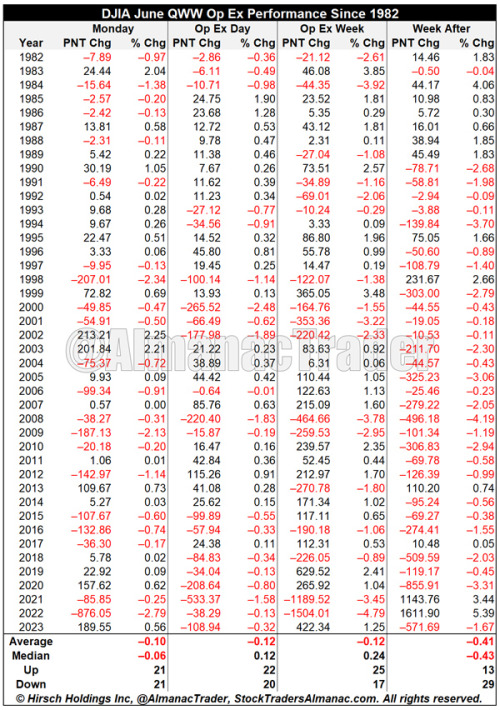
“The second Quadruple Witching Week of the year brings on some volatile trading with losses frequently exceeding gains. NASDAQ has the weakest record on the first trading day of the week, down 23 times in 42 years. Quad-Witching Friday is usually better, S&P 500 has been up 12 of the last 21 years, but down 6 of the last 8.
Full-week performance is choppy as well, littered with greater than 1% moves in both directions. The week after June’s Quad-Witching Day is horrendous. This week has experienced DJIA losses in 28 of the last 34 years with an average performance of –0.83%. S&P 500 and NASDAQ have fared better during the week after over the same 34-year span. S&P 500 averaged –0.49%. NASDAQ has averaged +0.03%. Sizable gains in 2021 and 2022 during the week after improved historical average performance notably.”
MrTopStep Levels:
MiM and Daily Recap
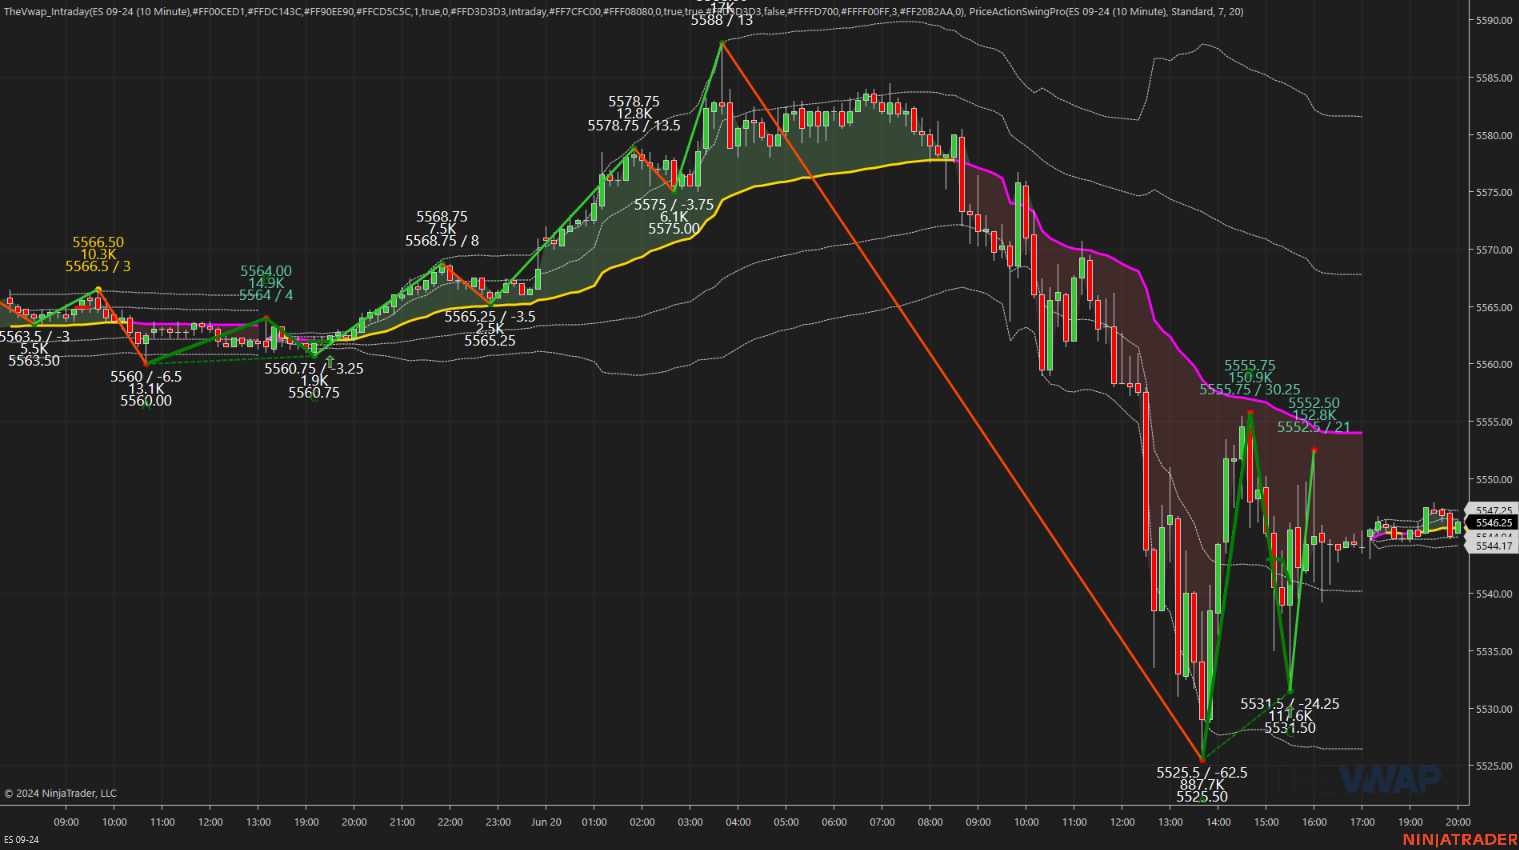
The ES rallied up to 5588.00 on Globex and opened Thursday’s regular session at 5570.25. After the open, the ES traded down to 5959.00 at 10:15, rallied up to 5570.75 at 11:10 and then pulled back to 5558.25 at 11:50. The ES bounced up to 5562.50, traded down to 5533.50, rallied back up to 5551.00 at 12:55 and then dropped 20 points down to 5531.00 at 1:15. After the low, the ES rallied up to 5543.75 and then made a new low at 5525.50 at 1:40 and rallied up to 5555.75 at 2:25 and then traded down to a new low at 5525.50 at 3:25. After the low, the ES made a sequence of higher lows and rallied up to 5549.75 at 3:46 and traded 5544.25 as the 3:50 cash imbalance showed $3.2 billion to sell, rallied up to 5552.25 at 3:54 and sold off down to 5541.00 and traded 5544.75 on the 4:00 cash close. After 4:00 the ES flatlined and settle at 5544.00, down 17.75 points or -0.32%, while the NQ settled at 20,053.50, down 176.75 or -0.87% on the day.
In the end I mentioned something about the price action of the ES and NQ being weird on Wednesday — how the ES would go offered and the NQ would go bid and then the NQ would go offered and the ES would go bid — and my lean was to sell a higher open or the first rally above the gap up. In terms of the ES’s overall tone, there was a big rally up to new all-time highs on Globex, and once all the buying power was used up, in came the algo sell programs. In terms of the ES’s overall trade, 555k ESM and 1.8 million ESU traded.
Technical Edge
-
NYSE Breadth: 58% Upside Volume
-
Nasdaq Breadth: 46% Upside Volume
-
Advance/Decline: 48% Advance
-
VIX: ~13.50
Guest Post — Spot Gamma
SpotGamma is one the the shining stars of the options markets. If you have never heard of them or already know of them and have never signed up for their options flow products or the SG Academy, I fully suggest you check them out and add them to your trader’s toolbox.
Here’s a snippet from them:
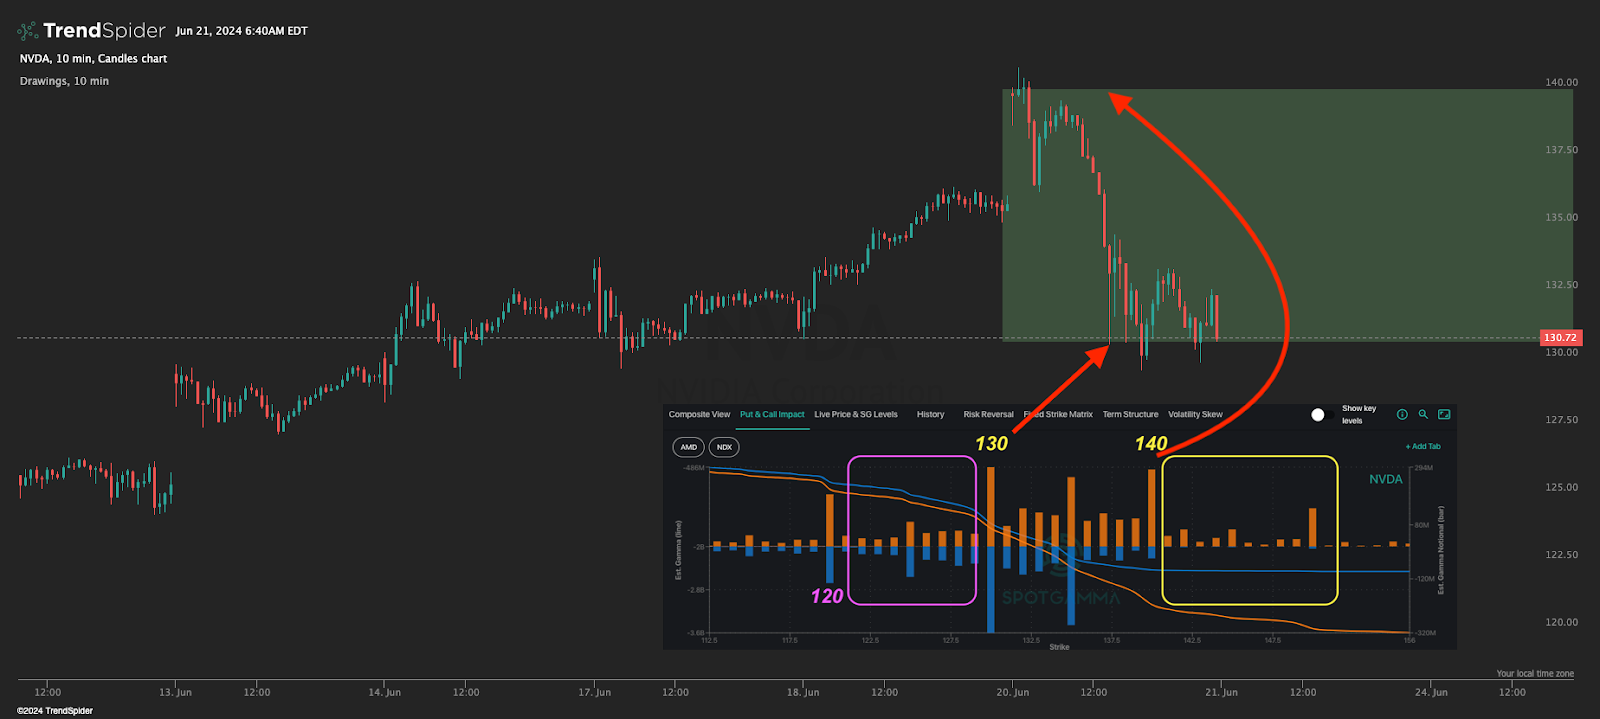
One of the topics most-discussed in markets today, is of the low correlation. This has been on display as single stocks, namely NVDA, blast higher in price, leaving broader equities in the dust. That “correlation move” was on display yesterday, just to the downside. NVDA yesterday rejected right at the 140 area highlighted in yesterday’s AM note, and lost 7% from that level to close at 130. In yesterday’s Member Q&A, we highlighted there were very few positions in NVDA <130, but today’s open interest update shows some large positions now at 120 – which is our new downside target.
This is a critical point: violent moves up in single stocks, relative to a grind-up in index, likely partially unwind with a violent move down in single stocks, and a grind-down. The “correlation trade” likely only fully breaks with some type of macro catalyst which pushes traders out of equities writ-large, and into cash or bonds. As far as we can tell there is no macro scare at the moment – just OPEX.
Economic Calendar
For a more complete Economic Calendar see: https://mrtopstep.com/economic-calendar/
Comments are closed