Zooming Out to Look at the Rally
A huge move in the ES since October
Follow @MrTopStep on Twitter and please share if you find our work valuable!
Every week, MrTopStep invites traders to an “Own the Close” contest where the closest guesstimate where the SPX will settle on Friday’s 4:00 cash close.
The winners get a free week’s access to the MrTopStep Chat and trading tools. Enter your guess now!
Our View
I looked at some longer term charts of the ES and the NQ.
-
On May 2, the ES traded 5100.75 and on June 19 the ES traded up to 5588.00 — that’s a 587.25 point rally in 33 sessions.
-
On May 31, the ES traded 5270.00 and on June 19 the ES traded 5588.00 — that’s a 318 point rally in 14 sessions.
-
On Friday June 14 the ES traded 5462.25 and on Monday June 17th, it traded 5561.00 — a 99 point gain in just three days.
These are just a few examples and it’s been an incredible run, but if you go back six months ago, the ES made a low at 4825.00 on Jan 4 and traded up to 5479.25 on 2/27/24 — a 653.75 point rally.
Zooming out even more, the ES traded 4291.00 on 10/26/2023, climbing 1,297 points to the current high of 5588.
Where am I going with this? The S&P has outperformed Wall Street analyst expectations by a long shot and no doubt is in need of a pullback/selloff at some point. There is an abundance of talking heads saying we could go lower — but that’s what the talking heads have been saying all year.
Our Lean
The week ahead has 7 Fed speakers and 11 economic reports, with the PCE index on Friday.
I think we can rally, but I’m not sure how well the ES will hold. Ideally, I would look to buy a lower open — especially if it’s near the Globex low. If not, I can’t rule out selling the early rips and buying the pullbacks or just keep it simple and buy the 20 to 30 point pullbacks.
I found this piece by Goldman Sachs interesting:
Forecast Change: The S&P 500 will rise higher than previously expected
“Goldman Sachs Research has raised its year-end target for the S&P 500 from 5200 to 5600, driven by milder-than-average negative earnings revisions and a higher valuation multiple. The S&P 500 index has returned about 15% since the start of the year, and earnings and valuation have contributed equally to that return.
Consensus earnings-per-share estimates have a typical pattern of negative revisions. That’s been offset in part by stellar earnings growth registered by five mega cap tech stocks. Consensus forecasts now imply a 31 percentage-point gap between earnings per share growth for these stocks compared with the median S&P 500 firm (37% vs 6%).
Goldman Sachs Research’s 2024 and 2025 earnings estimates remain unchanged. “Stable S&P 500 earnings estimates are unusual,” Kostin writes. “Historically, starting in June of the previous year, consensus estimates have been cut by an average of 7%.” Going forward, Goldman Sachs Research expects milder-than-average revisions to S&P 500 earnings estimates until the end of 2024, since upward revisions to mega cap tech earnings have already taken place.”
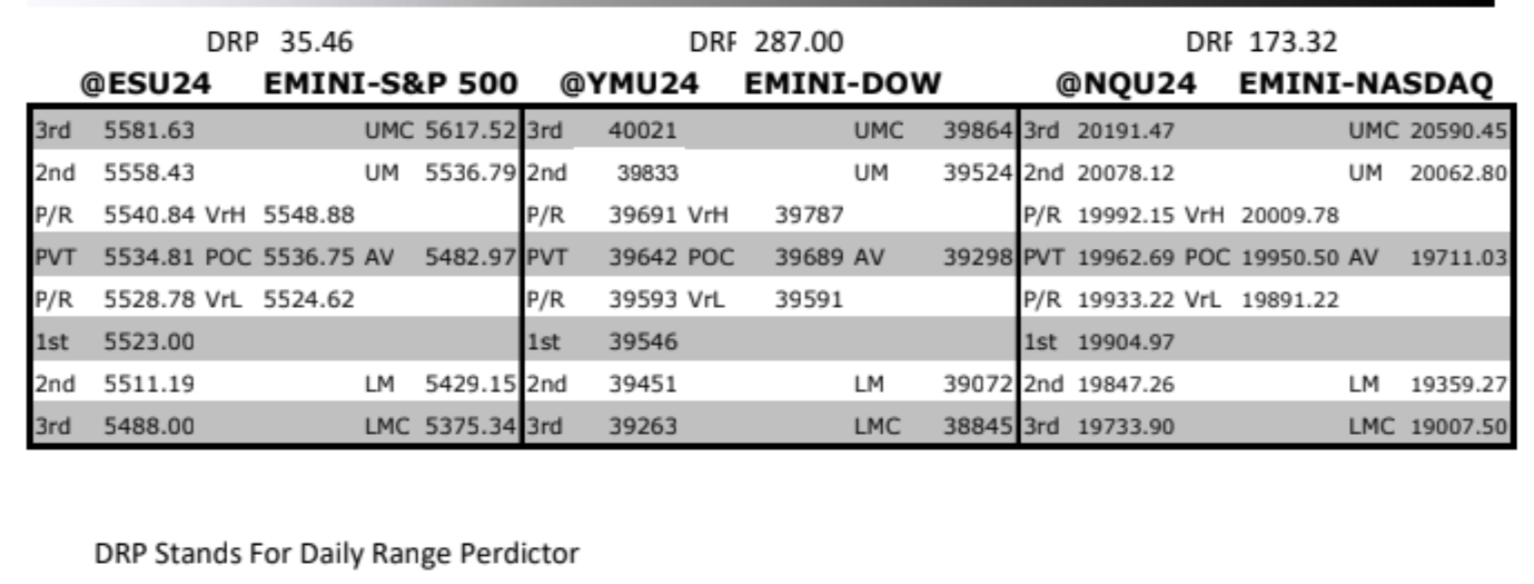
MrTopStep Levels:
MiM and Daily Recap
ES Recap
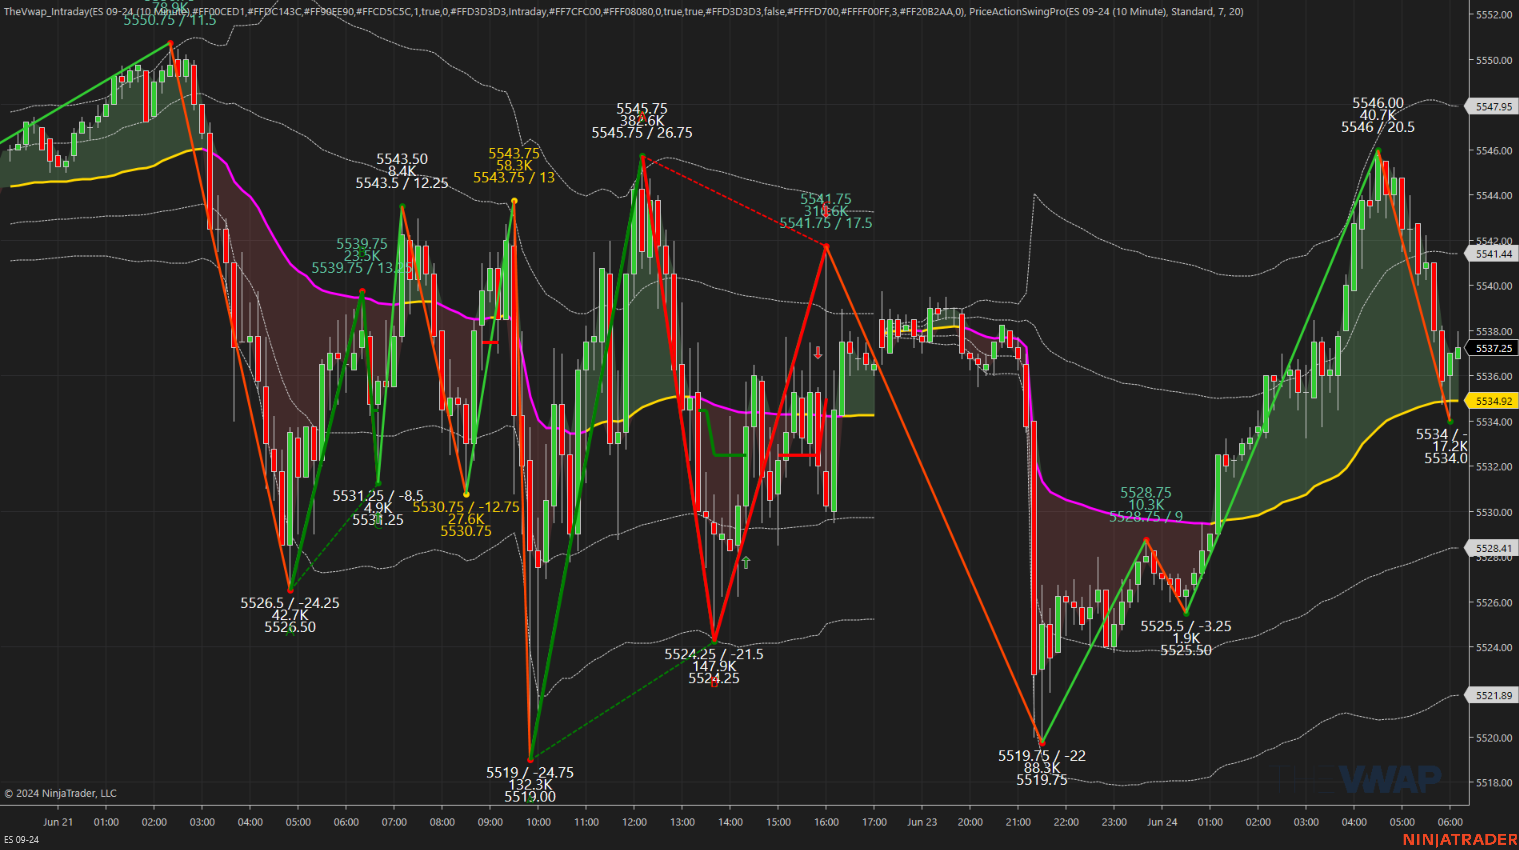
The ES sold off down to 5526.50 on Globex and opened Friday’s regular session at 5534.25. After the open, the ES traded down to 5529.00 and then rallied up to 5538.00 at 9:37. After the open, the ES made a series of lower lows down to 5519.00 at 9:46 and then rallied 17.25 points up to 5537.25.
The ES made a high at 5545.75 at 12:10, sold off down to a higher low at 5524.25 at 1:40 and then traded up to 5536.25 at 2:30. From there, it sold back down to 5528.50 at 2:55 and then a small buy program pushed the ES back up to 5537.75 at 3:10, traded down to 5532.00 and traded up to 5541.75 at 3:55. The ES dipped down to 5530.00 at 3:59 and traded 5530.75 on the 4:00 cash close. After 4:00 the ES sold off down to 5529.50 at 4:05, rallied up to 5539.00 and settled at 5536.50, down 7.5 points or -0.14% on the day. The NQ settled at 20,009.75, down 46.25 points or -0.23%, the yield on the 10-yr note ticked up to 4.256%, from 4.252% on Thursday, gold settled at 2,334.70, down 34.3 points or -1.45%, crude oil settled at 80.59, down .70 or -0.86% and Bitcoin settled at 64,860, down 815 points or -1.24% on the day.
In the end, the $5 trillion in expiring options was a dull fade and all the volume was done in the first and last hour — the NYSE did 3.5 billion. In terms of the ES’s overall tone, it was weak but not overly. In terms of the ES’s overall trade, volume was on the low side at 1.253 million contracts traded.
Technical Edge
-
NYSE Breadth: 45% Upside Volume
-
Nasdaq Breadth: 54% Upside Volume
-
Advance/Decline: 51% Advance
-
VIX: ~13.75
Economic Calendar
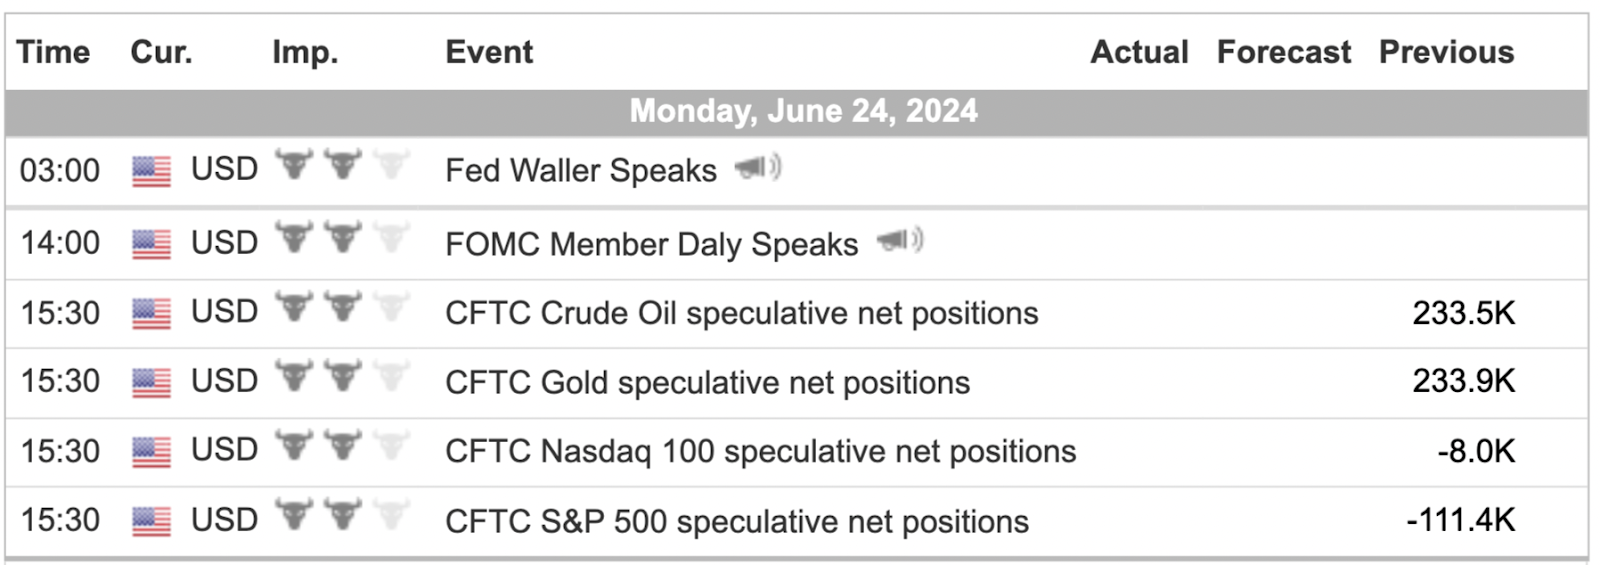
For a more complete Economic Calendar see: https://mrtopstep.com/economic-calendar/
Comments are closed