Bulls Remain in Control Despite Overbought Conditions
Earnings start this week
Follow @MrTopStep on Twitter and please share if you find our work valuable!
Our View
Friday’s jobs report has reignited the rate-cut narrative, despite the unemployment rate ticking up to 4.1%, suggesting the job market is gradually cooling.
Following Friday’s jobs data, traders in interest-rate futures were betting that there is a 78% chance that the Fed will cut rates at least once by its September meeting, according to CME Group data.
I still say no way, but it really seems like the Fed wants to prove its point and lower rates, though I think that would be a big mistake. According to JPMorgan, historically, the Fed doesn’t stay on the sidelines during election years but rather continues to pursue its dual mandate of price stability and maximum employment, while maintaining its independence from politics.
Our Lean
Since 1928, July has consistently been the best month in terms of stock performance. The average increase in the S&P 500 has been 1.7%, with the index rising in July more than 60% of the time. This implies that investing early in July could potentially yield benefits in the subsequent weeks, particularly if you invest in an S&P 500 index fund.
While some of the market-leading stocks are overbought, it appears that doesn’t seem to matter much. The Relative Strength Index (RSI) measures how fast a stock is rising compared to its history; a stock is considered overbought if its RSI exceeds 70 and it is more likely to pull back as it approaches 80. For instance, Microsoft’s RSI is currently at 75. Nvidia’s RSI peaked at 85 in January and reached 81 in June when its shares peaked at $140, showing that sometimes these ‘rules’ don’t apply to artificial intelligence.
Friday was not a great open to sell. Why?
First, the ES was 10 points off its high. Second, the NQ was too strong. Nonetheless, I did sell and added to my position when they rallied after the open. I made money, but ended up getting long right after getting out.
This week will see only 8 economic releases, with Thursday’s CPI report being the highlight. Fed Chairman Powell will address the Senate on Tuesday at 10:00 am and the House on Wednesday at 10:00 am. This week marks the beginning of earnings season with JPMorgan and Citigroup reporting. According to FactSet, overall, companies in the S&P 500 are expected to report a fourth consecutive quarter of earnings growth, with profits projected to have increased by 8.8% from the second quarter of last year.
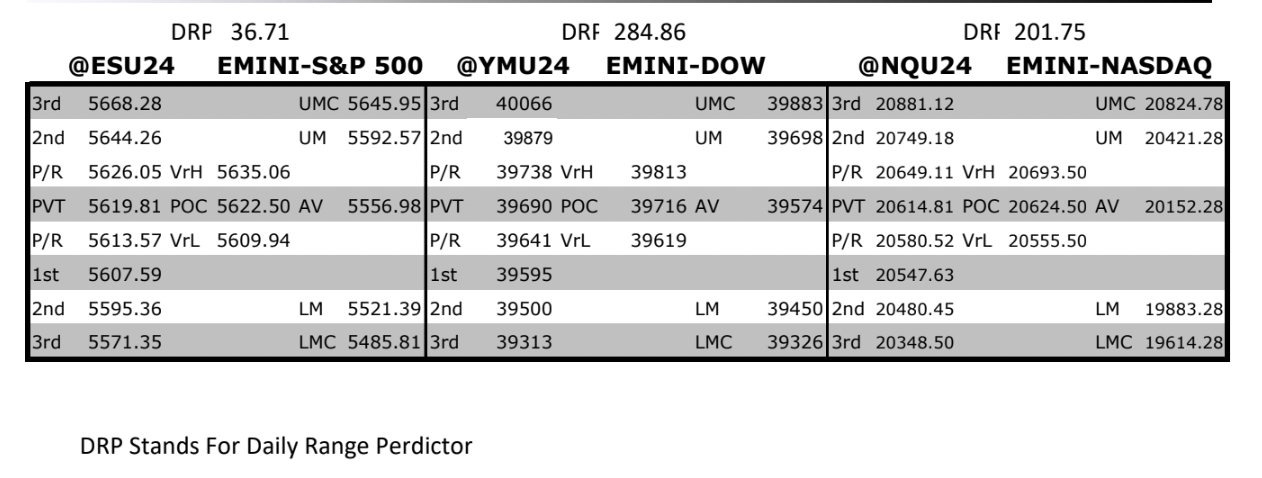
Our Lean: The ES, settled at its late-day lows. I must admit, I am somewhat surprised by how far the ES and NQ have gone without any pullbacks. Buy any 20 to 30-point pullbacks and watch for resistance at the 5630-35 level.
MrTopStep Levels:
MiM and Daily Recap

ES recap
The Globex low was 5585.00 and the ES was trading 5589.50 before the Jobs number showed the US labor market losing steam as the unemployment rate climbed to 4.1% and the jobs number was revised lower for April and May. The ES rallied up to 5605.00 and opened Friday’s regular session at 5592.25.
After the open the ES traded 5589.75, then traded up to 5598.25 at 9:45, sold back down to 5588.25 and the next move was up to 5502.75 at 10:05. From there, it sold off down to 5585.50 at 10:15, rallied up to a new high by 2 ticks at 5603.25, pulled back to the 5595.50 level and then made 7 new highs up to 5612.50.
After the high the ES pulled back to 5607.00, made a new high by 1 tick at 5612.75 at 12:25, dropped down to 5606.25 and then rallied up to a 5611.00 double top at 12:55. It then down-ticked and then rallied up to another new all time contract high at 5621.00, pulled back to the 5608 area and then rallied up to another new high at 5624.00 at 3:48. The ES traded 5622.25 as the 3:50 cash imbalance showed $500 million to sell, traded up to 5626.00 at 3:57 and traded 5619.50 on the 4:00 cash close. After 4:00 the ES sold off down to 5615.00 and settled at 5615.00, up 24.75 points or +0.44%, the NQ settled at 20,591.50, up 180 points or +0.88% on the day. The yield on the benchmark 10-year note declined to 4.272% after settling at 4.346% on Wednesday. This put yields lower for the week following two weeks of gains.
In the end, the S&P made its 34th new record close and the NQ made its 24th. In terms of the ES’s overall tone, the ES and NQ are and have been firm. In terms of the ES’s overall trade, volume was low but higher than expected at 1.224 million contracts traded.
Technical Edge
-
NYSE Breadth: 45% Upside Volume
-
Nasdaq Breadth: 63% Upside Volume
-
Advance/Decline: 68% Advance
-
VIX: ~12.50
S&P 500 — ES Futures

ES Daily (levels in Lean)
Economic Calendar
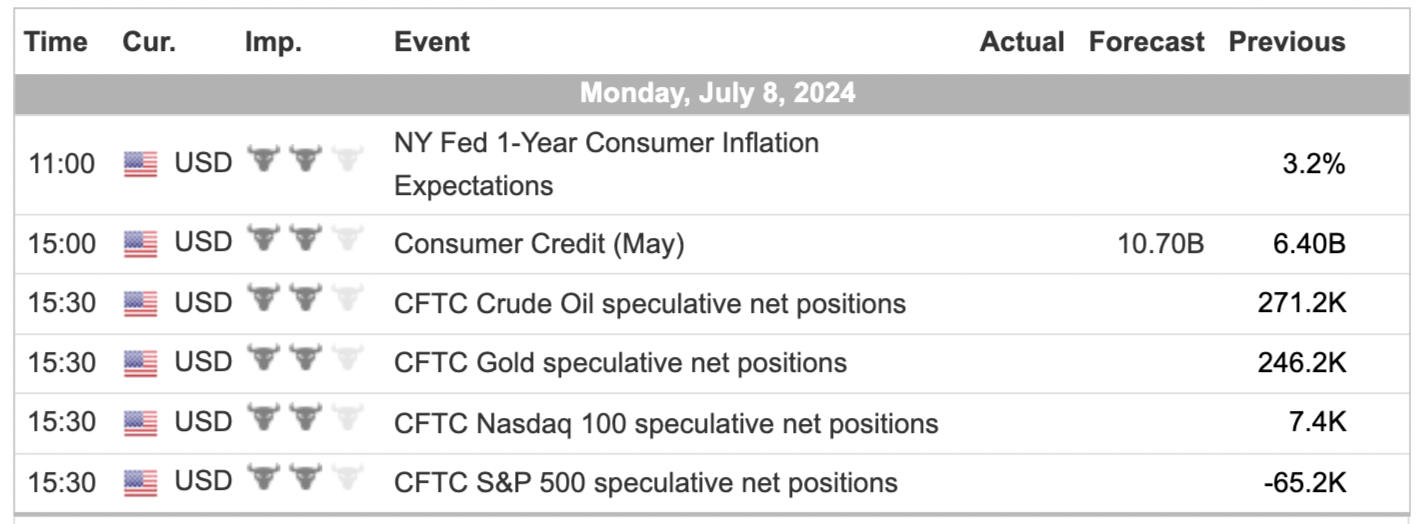
For a more complete Economic Calendar see: https://mrtopstep.com/economic-calendar/
Comments are closed