The Pullback Was Due, but Can We Bounce?
Monthly opex is tomorrow
Follow @MrTopStep on Twitter and please share if you find our work valuable!
Every week, MrTopStep invites traders to an “Own the Close” contest where the closest guesstimate where the SPX will settle on Friday’s 4:00 cash close.
The winners get a free week’s access to the MrTopStep Chat and trading tools. Enter your guess now!
Our View
After trading up to its 39th new record high at 5721.25, the market finally reacted to a few negative headlines. I don’t need anyone to tell me how far the ES and NQ have rallied; I’ve been observing it every day for 37 years. I mentioned that we might see 5750, but reaching ES 5800 wouldn’t come as quickly as the last three 100-point rallies, given that the recent momentum felt like trapped buyers and the ongoing mammoth rotations without an apparent end.
I’ve commented several times on the ‘weird’ price action between the ES and NQ, and honestly, I think it’s all part of a large-scale rotation.
Money doesn’t really sell; it just moves to whichever sector is in favor on any given day. I could present all the statistics of big down days, but I’ll keep it simple: yesterday marked one of the worst July selloffs ever. Adding to this, there’s the suspect July expiration — is the dip all just Opex driven? — and the seasonal weakness that typically follows after July 20th.
Our Lean
The BS about a 10% drop started up again yesterday. Even if it does, it’s going to have to get through a 5% drop first. I’m sure the bulls don’t like the hit, but as I have said many times, nothing goes up or down forever, at some point they will move the other way. Is this the beginning of a correction? I think the better way to say it is… are the S&P and Nasdaq due for a pullback? I wholeheartedly think so. Today we have 3 economic reports and one Fed speaker.
Our Lean: I think there is more downside, but I also think you take this one day at a time. Yesterday’s drop took the ES back near its July 12th 5621.75 low. Below that I have 5613, 5585.50 (which traded back on July 5th), 5560 from July 3rd, 5552, 5531 and then the 5512 area — most of which I doubt we see today.
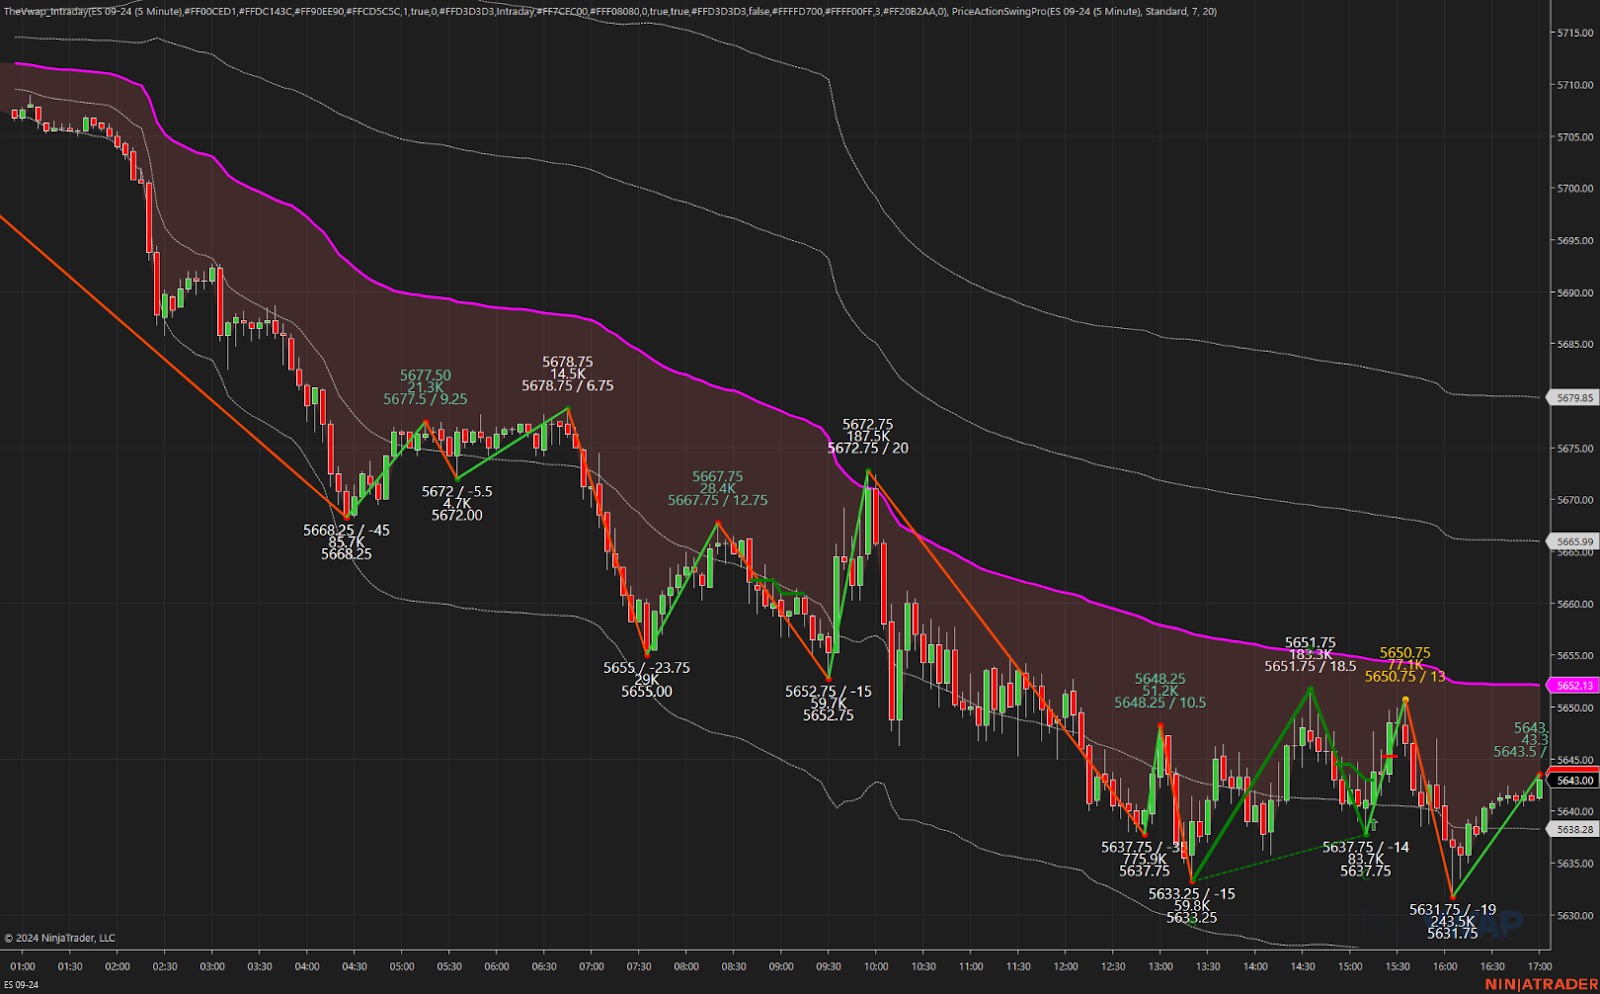
The 50% retracement from the 5721.75 high to yesterday’s 5631.75 low equals 90 points exactly — at 5676.75 — and if you look at the chart, the ES traded up to a high at 5678.75 at 6:50 am on Globex. If the ES gaps lower, I would look to be a buyer and if the ES gaps higher I want to get a good look at what the NQ is doing because after such a big drop the tech buyers may test the water.
While I do not think the decline is over, that doesn’t mean there won’t be a big bounce. Last time we had a big down day (last Thursday, when the ES made a new record high, then reversed and closed lower by 68 points) it recovered all of its losses on Friday and took out Thursday’s high.
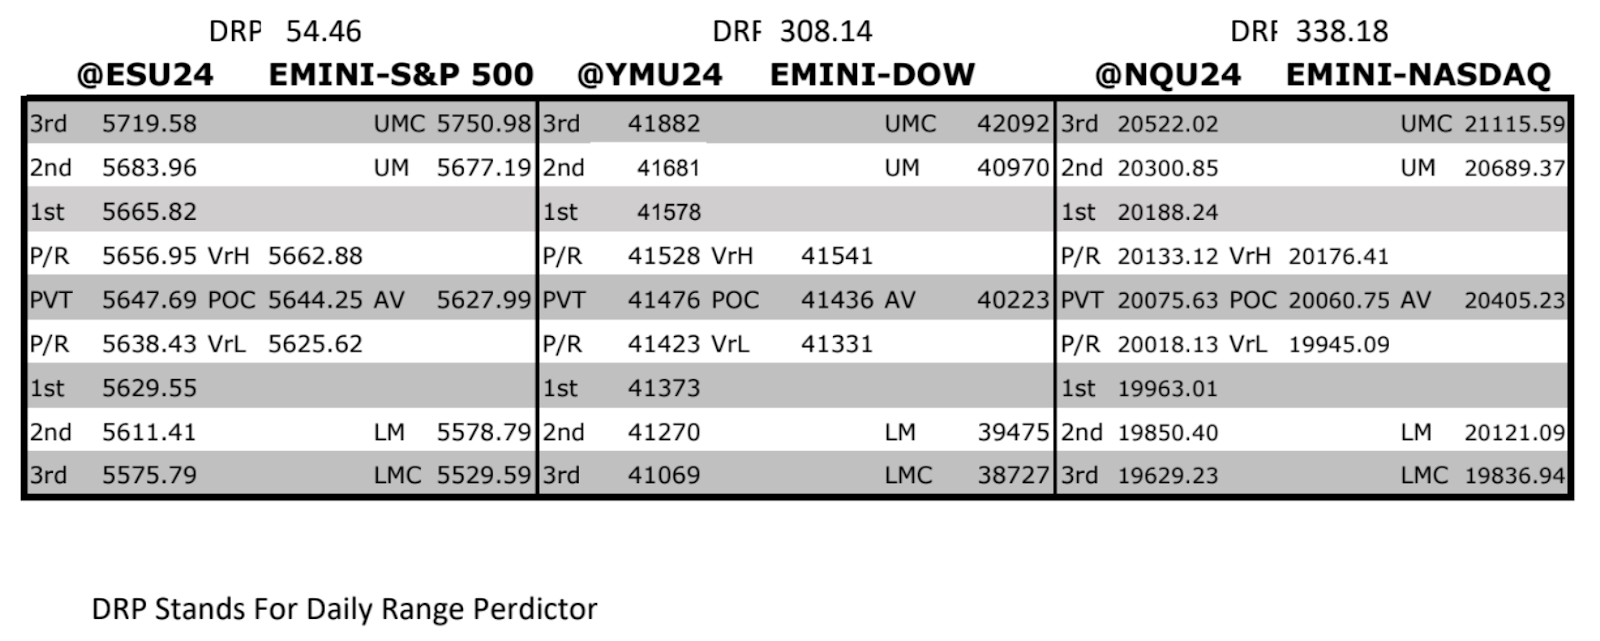
MrTopStep Levels:
MiM and Daily Recap
ES recap
The ES got slammed after a few overnight headlines hit hard. The first was the EU central banks lowering growth expectations for China and India, coupled with news of the US expanding tariffs on Chinese technology. This sent the ES down to 5652.75 at 9:28 am and it opened Wednesday’s regular session at 5655.25. After the open, the ES traded 5652.75, rallied up to 5669.25, pulled back to 5660.25, and then reached 5672.75 at 9:56.
It then sold off to an early low of 5646.25 at 10:16, rallied to 5661.25, and slowly declined to 5637.75 by 12:53. It rallied again to 5648.25 at 1:00 and then dropped to a new low at 5633.25 at 1:20. After this low, the ES rallied to 5646.50 at 1:40, sold off to a higher low at 5635.75, and then rallied to 5651.75 at 2:33. It sold off again to a lower high at 5637.75 at 3:09, traded back up to 5650.75 at 3:33, and then dropped to 5638.50, trading 5642.50 as the 3:50 cash imbalance showed $523 million to buy. It traded up to 5647.00 and then sold down to 5637.00 at 3:49, closing at 5637.25 by the 4:00 cash close. After 4:00, the ES traded to a new daily low at 5631.75, rallied to 5642.50 at 4:40, and settled at 5643.00, down 72.5 points or -1.27%.
The NQ settled at 20,016.75, down 574 points or -2.82%, with the Magnificent 7 shares causing the tech-heavy gauge’s biggest one-day selloff since December 2022. The YM settled at 41,544.00, up +0.40%, while the Russell futures (RTY) settled at 2,265.00, down 19.20 points or -0.84%. Treasury yields slipped, with the 10-year note yield inching lower to 4.143%. Oil rose by 2.34%, while gold fell by 0.19%.
In the end, it was a case of the market being overwhelmed by headline news. In terms of the ES’s overall tone, it acted weak, which is understandable given its recent rally. Trade volume was high, with 260k ES contracts traded on Globex and 1.709 million traded during the day session, totaling 1.969 million contracts traded overall.
Technical Edge
-
NYSE Breadth: 40% Upside Volume
-
Nasdaq Breadth: 34% Upside Volume
-
Advance/Decline: 41% Advance
-
VIX: ~14.50
-
Hit its highest level since May 30
-
Guest Post — Dan atGTC Traders
Eyeing Up a Simple New Option Trade
Something nice and simple this morning.
We have all watched the pretty impressive rotation out of the favored tech stocks, into defensive names.
Invesco’s S&P 500 High Dividend Low Volatility ETF (SPHD), is somewhat known as the “Widows and Orphans” ETF. And while the Nasdaq could not find a bit whatsoever yesterday …
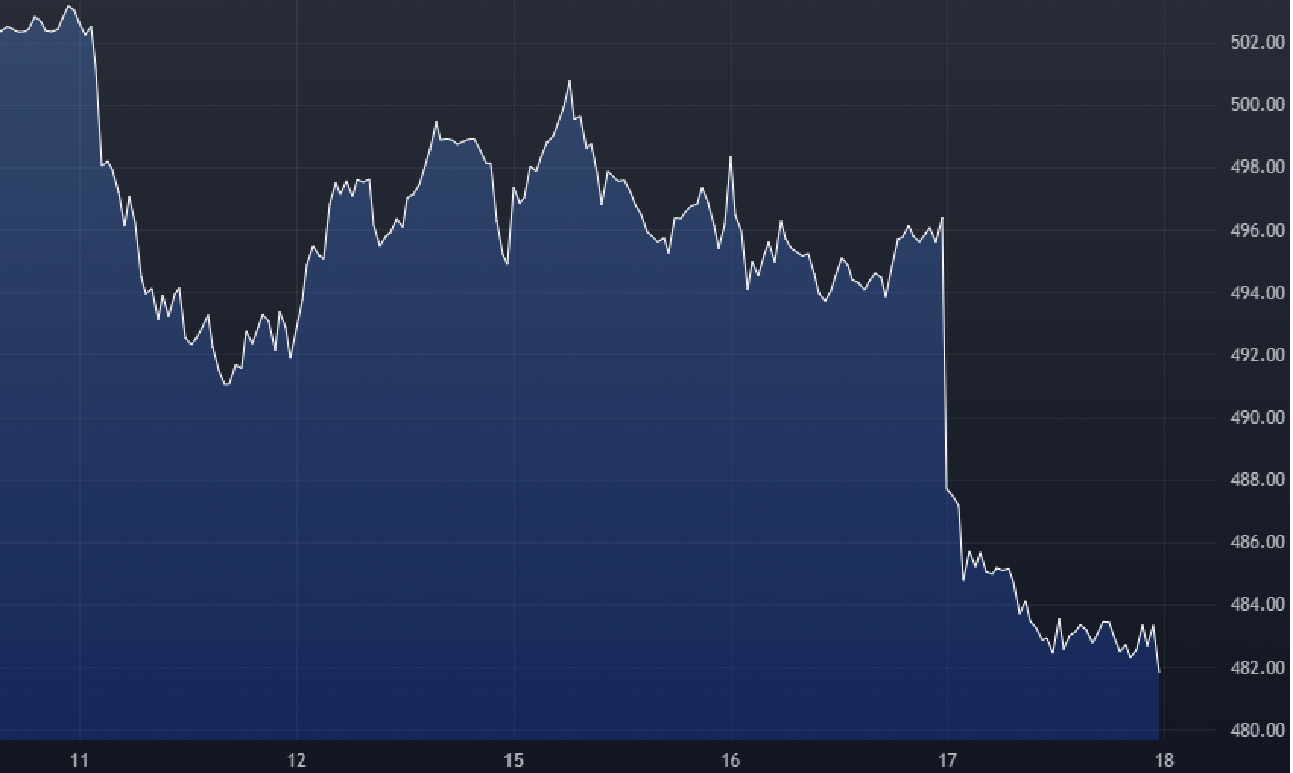
QQQ – 10 Minute Chart
Widows and Orphans could not find an offer to sell anywhere …
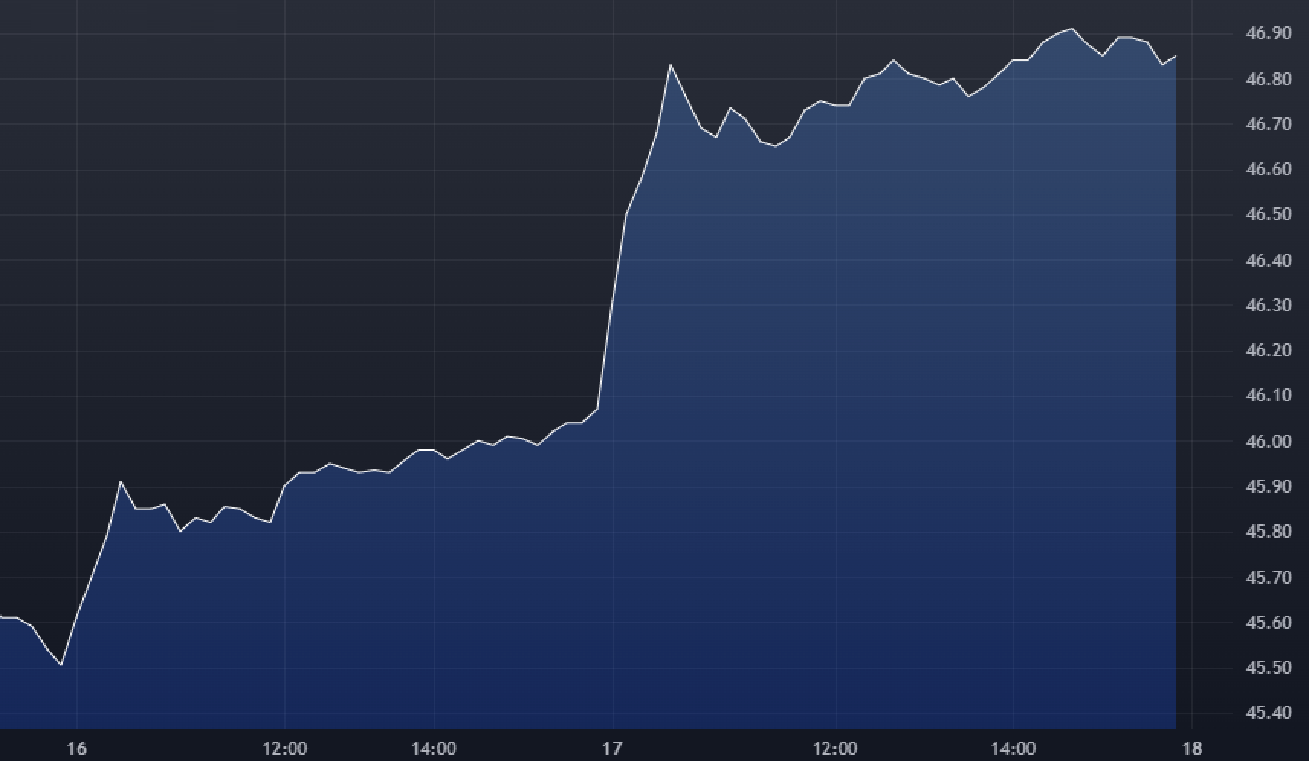
“Widows and Orphans” ETF – SPHD – 10 Minute Chart
And the Russell continued its march higher in this month of July …
iShares Russell 2000 ETF – 10 Minute Chart
While these moves have been impressive; and we have enjoyed them? (The GTC Sample Portfolio holds both SPHD as a piece, as well as many of the stocks that enjoyed a nice rally)
We’re actually looking to short the move on exhaustion of this incredible rally. But we want to do so intelligently, with options.
IWM currently enjoys a IVR or IV Percentile of approximately 75%. Which means that for the last year? Implied volatility (somewhat inaccurately thinking of this as the ‘juice’ of an options price for those new to options) is in the 75th percentile of where it’s been for the last year. This doesn’t indicate whether we will win or lose the trade. However, it does tend to indicate that we can pull in more money … more ‘juice’ by selling the option at this time.
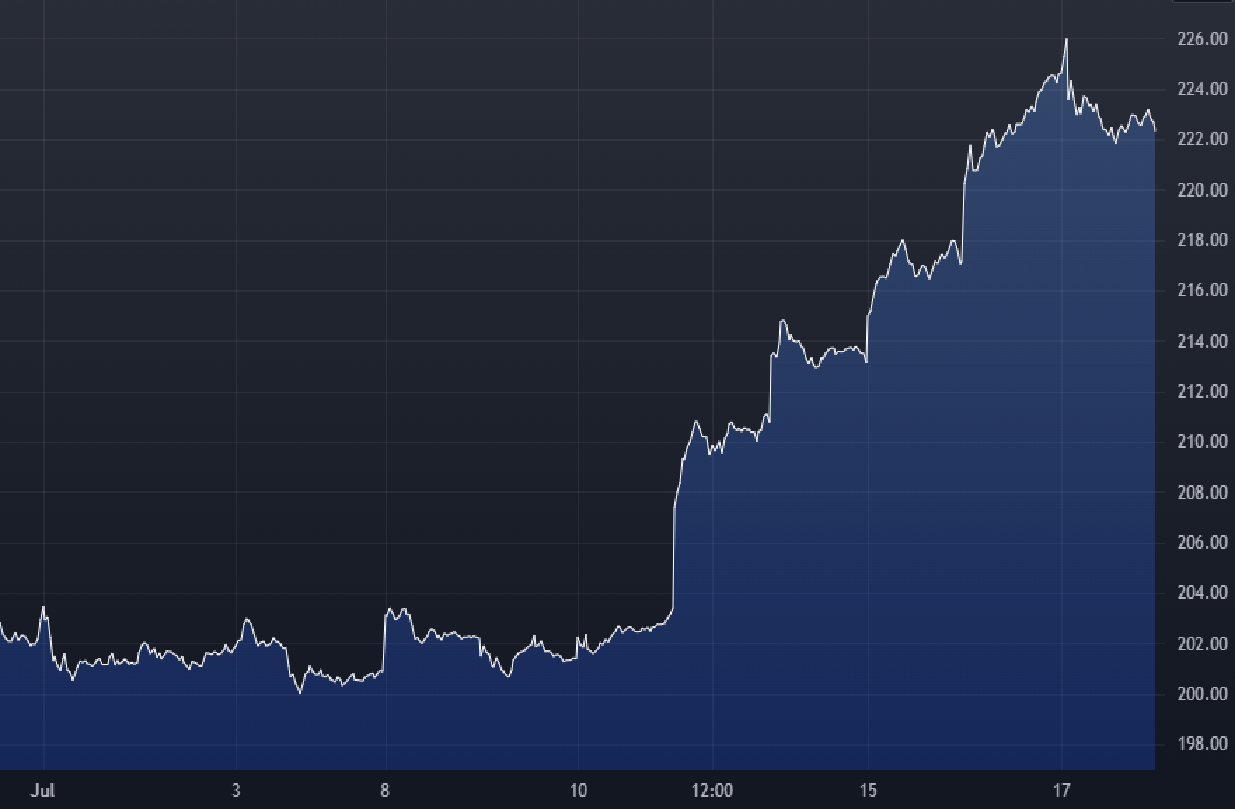
So we are simply waiting for a break in momentum on the Russell, or IWM. It’s currently trading above both the Weekly Central Pivot (Pink) and the Weekly VWAP (dotted blue).
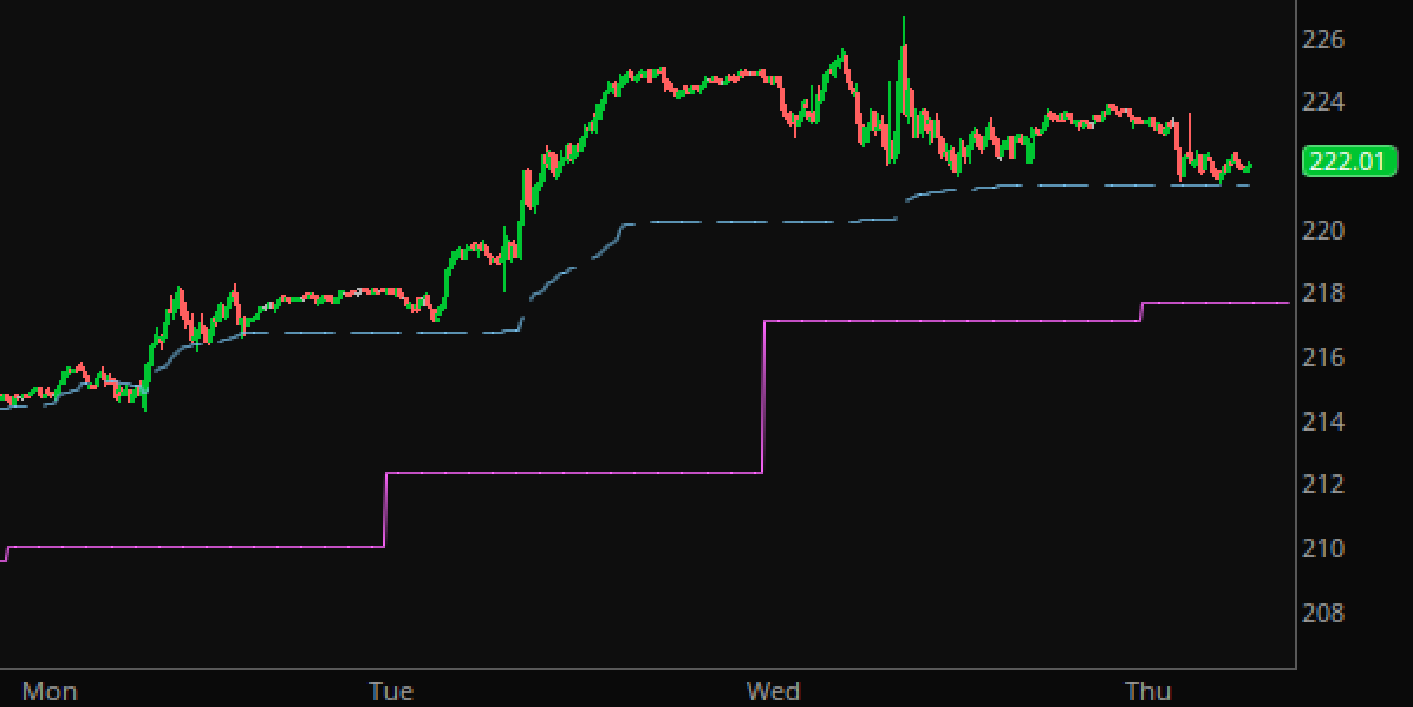
IWM – 10 Minute Chart
At the moment, selling the August 23, IWM 245 Calls, and buying the 255 Calls, could bring in 0.54 per option spread sold. The Probability of Profit is around 91%, with a CvaR of around -$724.06. That is selling the 11 Deltas, with a total max loss if you completely fell asleep at the wheel of -$946.00 per spread. The expected range at this time, before future variables come into play, is only $234.50.
If the option gets into trouble (The Russell would basically have to double again, the move it’s already made in 36 days time), we could always defend the position by rolling it forward in time; so as to extend duration and keep the trade alive and profitable.
Regardless, if the Russell starts trading below it’s weekly VWAP, and shows a bit of a break in congestion? Don’t be surprised if we put that trade on, in addition to the others that we currently hold.
Stay safe, and trade well…
Economic Calendar
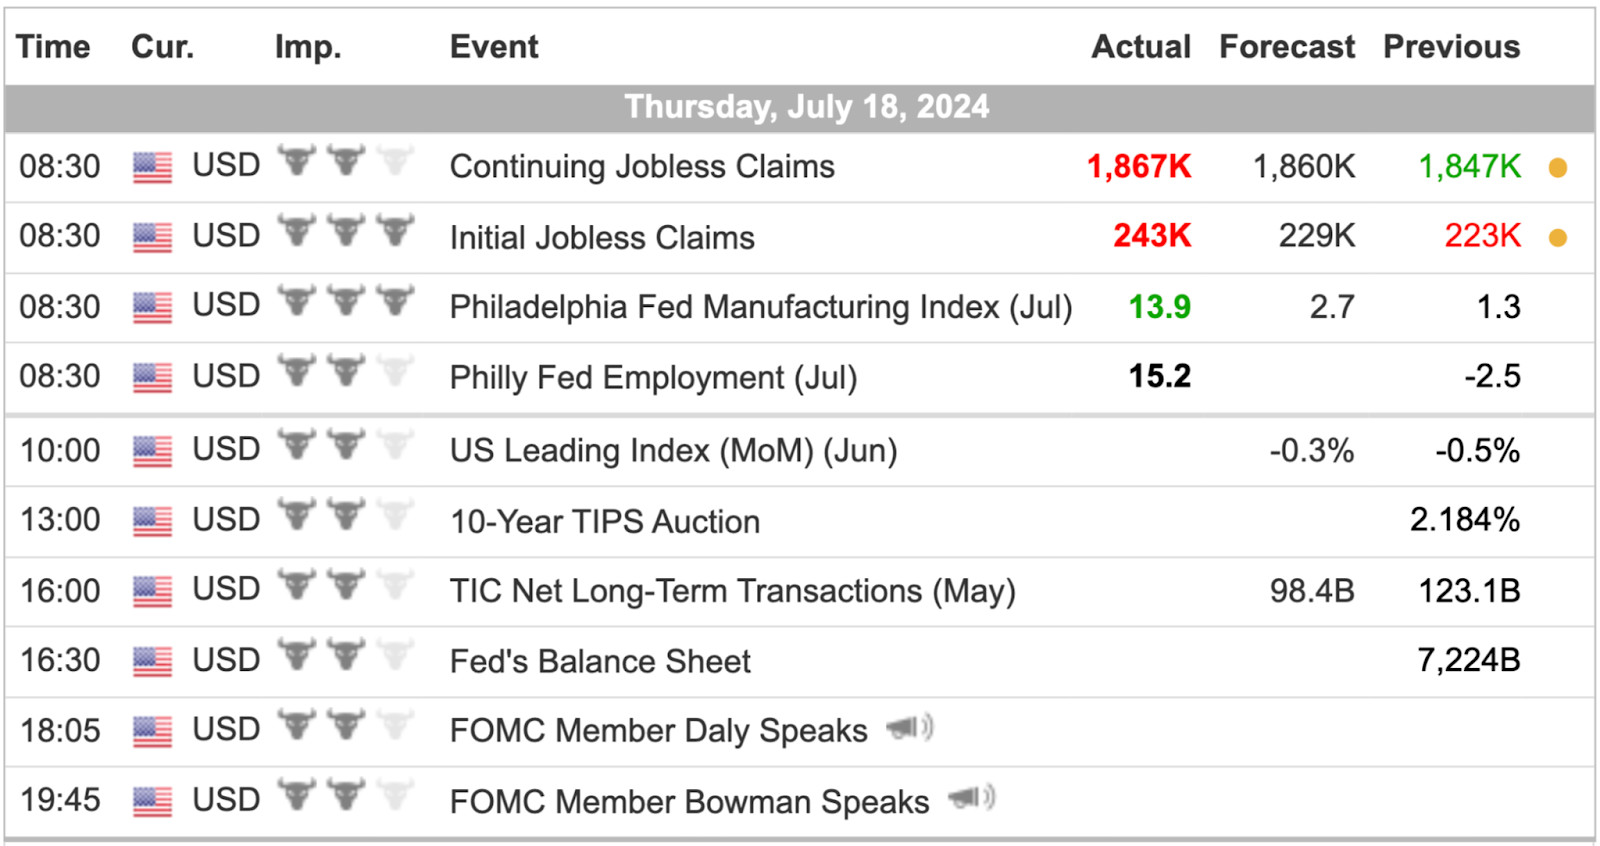
For a more complete Economic Calendar see: https://mrtopstep.com/economic-calendar/
Comments are closed