Volatility Rises and Trading Ranges Expand
Can the bulls muster a bounce?
Follow @MrTopStep on Twitter and please share if you find our work valuable.
Our View
I think a lot of people are eager for July to end, but there are still four trading days left, culminating in a session where the Fed meeting coincides with the rebalance.
When will the stock market stop going down? I’ll tell you: it will happen when the largest-ever tech rotation ends. I didn’t anticipate a 10% drop in the S&P; I thought a 5% decline would be challenging enough, but the index fell 5%. Given the over-concentration in the top 15 stocks, particularly the Magnificent Seven, some form of blow-off was inevitable.
As sellers exited tech, they shifted money elsewhere. Yesterday, that shift was toward the Dow and Russell, which rose 0.35% and 1.31%, respectively. Following a stronger-than-expected rise in GDP data, smaller companies outperformed as the largest rotation in history continues. Rotations have always been part of the stock market, but in today’s trading environment, money is constantly moving — money never sleeps.
Our Lean
Drop 43 points, rally 100 points and drop 100 points all in one day. Welcome to what has been a very volatile July and what could be the preview for the month of August — the dog days are upon us.
If there is one thing that stands out about this decline, it’s that every rally fails — no matter if it’s a 10 point rally or 100 points.
It’s 9:00 PM and the ES just traded up to 5458.75. My guess is we again see some type of rally/bounce that the odds favor will fail. The 50% retracement from 5533.75 down to the 5433.25 low — a 100 point range, mind you — works out to 5483.50.
MiM and Daily Recap
ES Recap
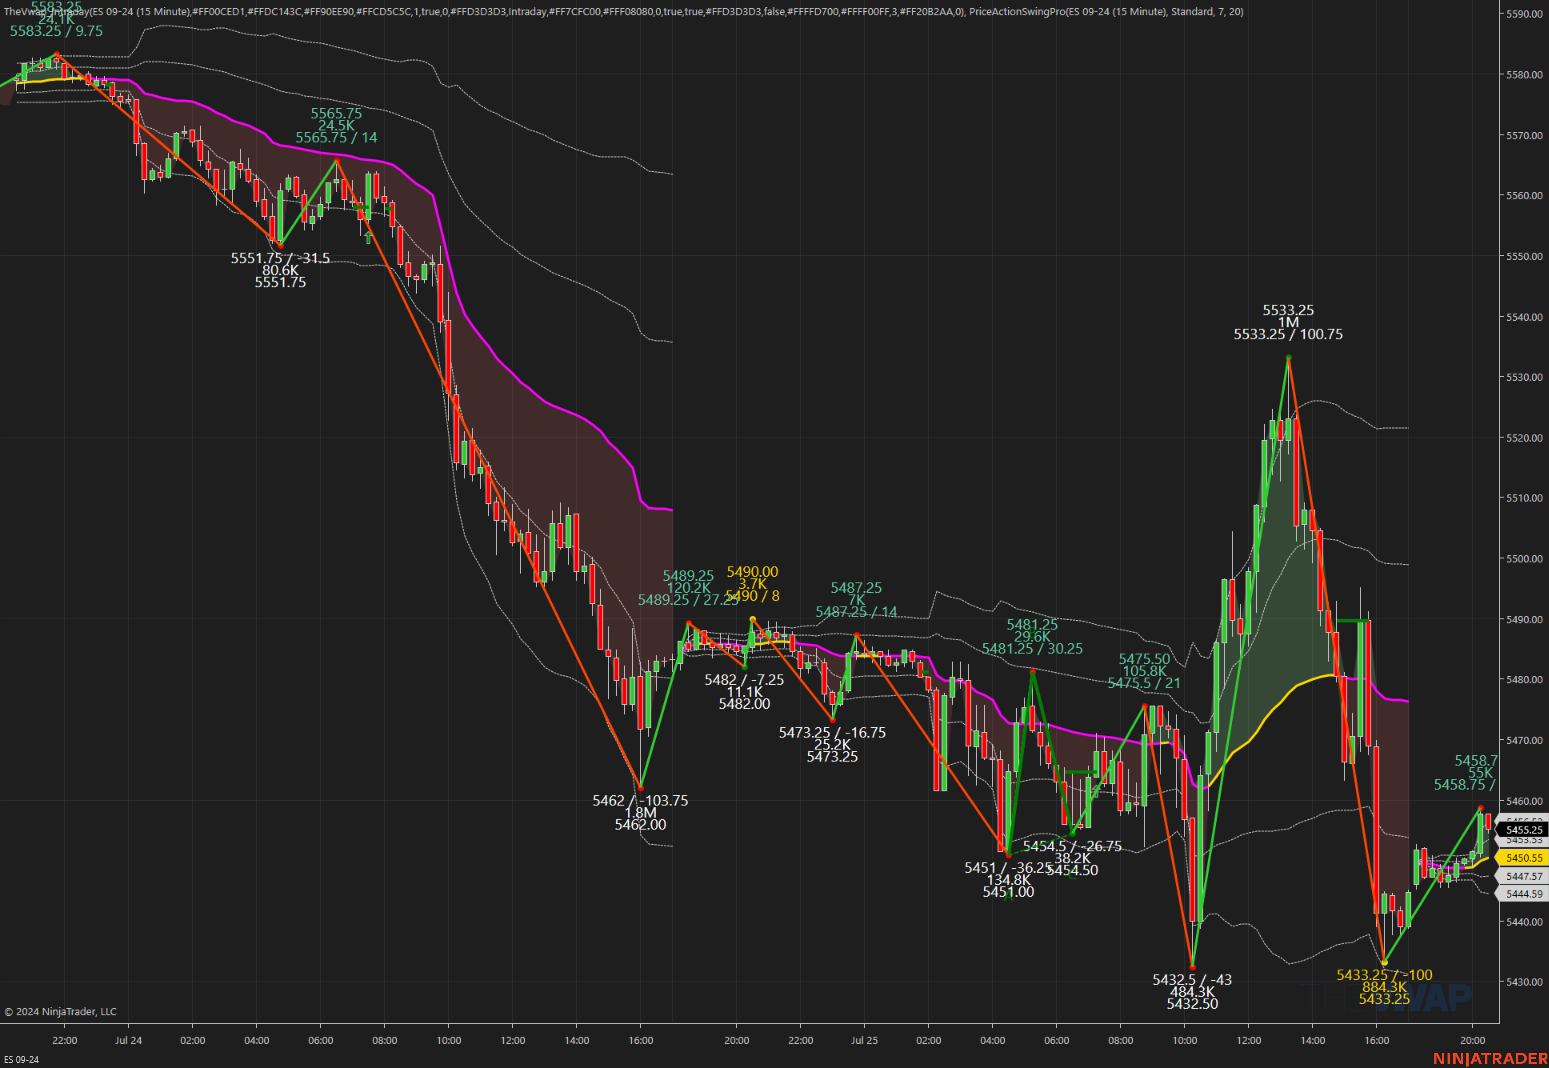
The ES traded down to 5462.00 and rallied up to 5490.00 on Globex and opened Thursday’s regular session at 5471.75. After the open, the ES traded 5474.25 and then sold off down to the low of the day at 5432.50 at 10:15 and then rallied 72 points up to 5504.50 at 11:20, pulled back down to 5481.75 at 11:44 and then shot up to 5524.75 at 12:42. After the high, the ES pulled back down to 5512.75 at 12:52 and then rallied up to the high of the day at 5533.25 at 1:12 and I noted in the chat:
-
Dboy (2:12:02 PM): PitBull 101 — The S&P tends to close in the direction it starts out
From there, the ES dropped 70 points down to 5463.5 at 2:55. I reminded everyone about the parts to the trading day:
-
IMPRO : Dboy : (3:06:37 PM): Remember the 3 Parts to the trading day 1) What happens on Globex 2) what happens after the 9:30 open and 3) what happens after 3:00
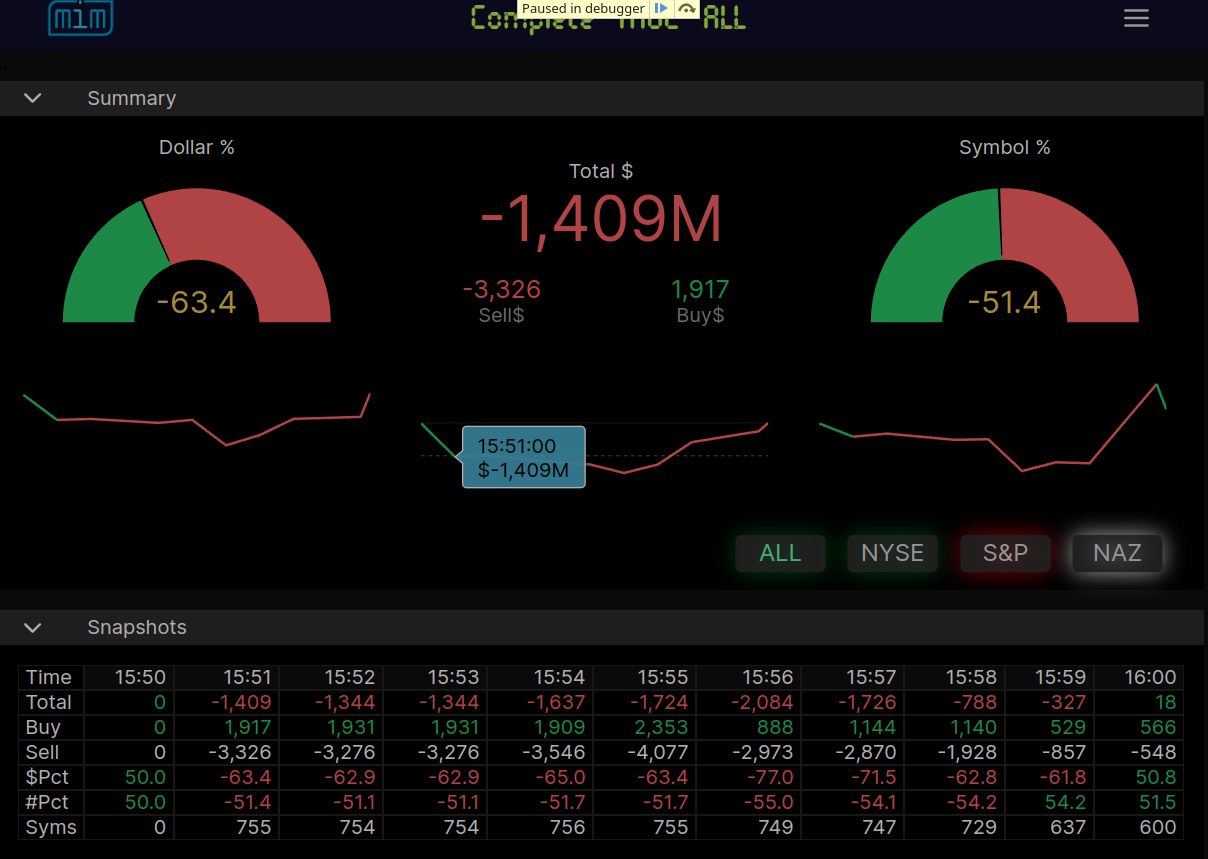
After the ES slowly rallied up to 5495.25 at 3:30, it sold back off down to 5458.00, then traded 5469.25 as the 3:50 cash imbalance showed $1.36 million to sell and then sold off down to 5439.00 at 3:59 and traded 5441 on the 4:00 cash close. After 4:00, the ES sold off down to 5433.25 at 4:06 and rallied back up to 5445.25, just 3 ticks off the low of the day and low of the move at 5432.50 and settled at 5445.25 on the 5:00 futures close, down 38.50 points or -0.70%, the NQ settled at 18,994.75, down 282.25 points or -1.47%, gold got whacked, down 55.00 down to 2,360.20, the 10yr note closed up 0.14% at 4.287%, crude oil settled at $78.11, up 0.52 or +0.67%, and Bitcoin closed down 1,080 points at 64,620.
In the end it was a drop and a 100 point pop. In terms of the ES and NQ’s overall tone, they were oversold and buy programs took over. In terms of the ES’s overall trade, volume was big: 435k ES traded on Globex and 2.355 traded on the day session for a total of 2.79 million contracts traded and the NQ volume was 972k (wow). The ES volume was the highest one-day figure since May 10, 2023.
Technical Edge
-
NYSE Breadth: 53% Upside Volume
-
Nasdaq Breadth: 53% Upside Volume
-
Advance/Decline: 66% Advance
-
VIX: ~17.50
-
~10% off yesterday’s high
-
Guest Post — SpotGamma
SpotGamma is one the the shining stars of the options markets. If you have never heard of them or already know of them and have never signed up for their options flow products or the SG Academy, I fully suggest you check them out and add them to your trader’s toolbox.
Here’s a snippet from them:
On June 18th, NVDA became the worlds largest company, surpassing MSFT. That lasted one week.
Since then, NVDA is down 20%, with the QQQ -5% & SPY -2%. Meanwhile, the DIA and IWM are both higher at +3% & +12%, respectively.
Through this lens, we are in the midst of an equity rotation – a “Correlation Spasm” as equity relationships normalize from “never seen before” levels.
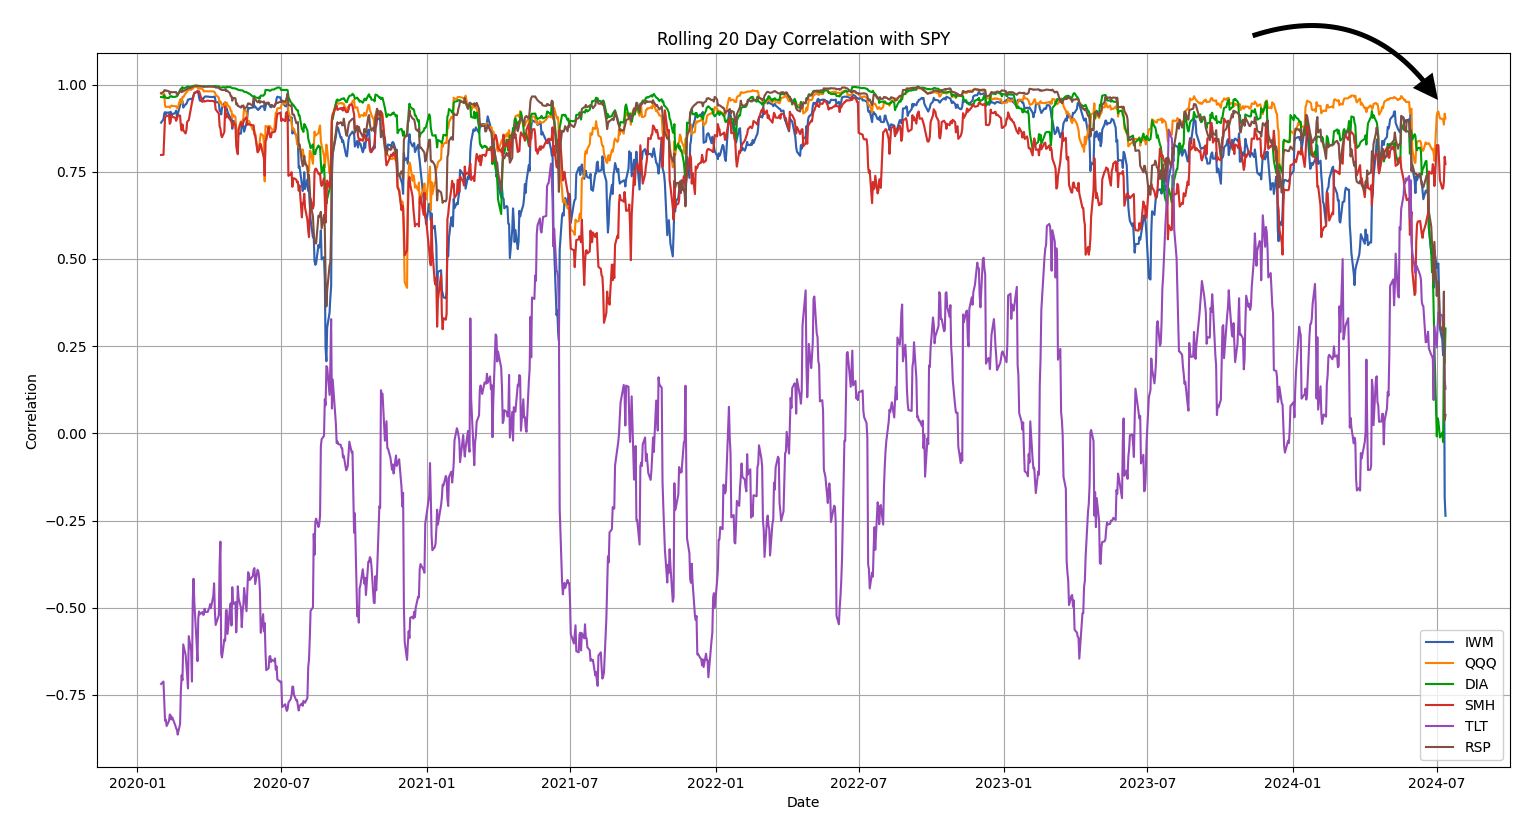
You can see these relationships in the plot below, which shows realized correlation of various ETF’s to SPY. The QQQ (orange) and semi-ETF SMH (red) are heavily correlated to the SPY, as they are all essentially the same trade: heavyweight tech (and that performed very well up into June).
Note here the DIA (green) and IWM (blue) are inversely correlated to SPY in ways not seen over the last 4 years, as DIA/IWM go up and tech declines.
Economic Calendar
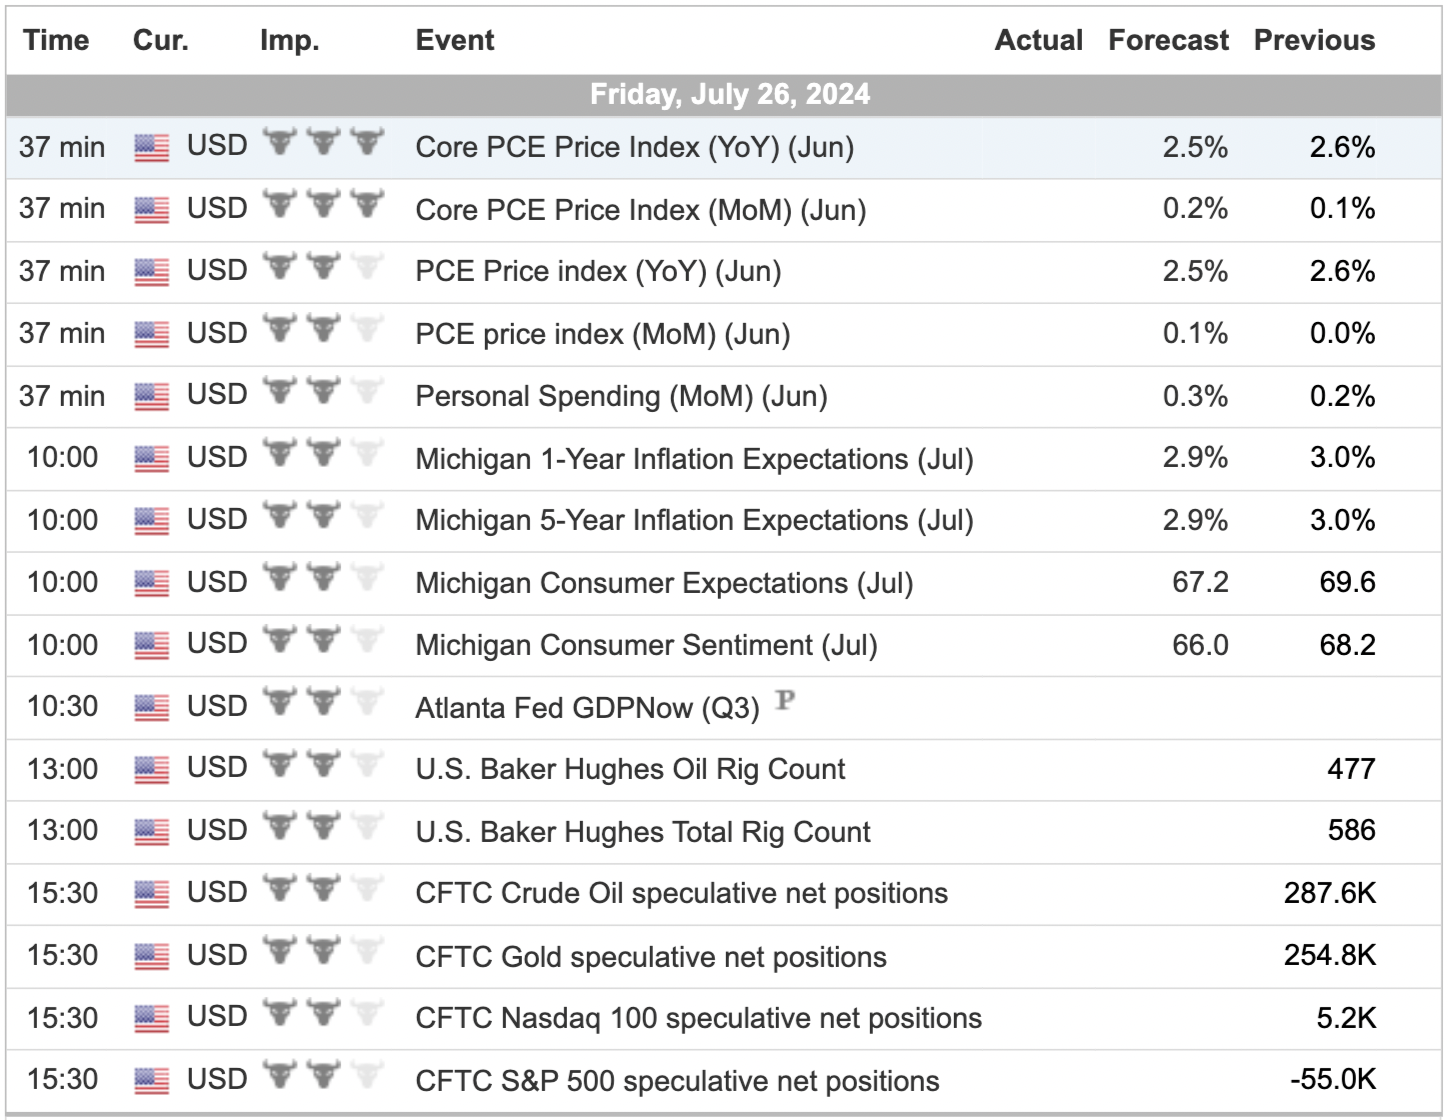
For a more complete Economic Calendar see: https://mrtopstep.com/economic-calendar/
Comments are closed