Is a Bounce Brewing?
I expect volatility to continue
Follow @MrTopStep on Twitter and please share if you find our work valuable!
Every week, MrTopStep invites traders to an “Own the Close” contest where the closest guesstimate where the SPX will settle on Friday’s 4:00 cash close.
The winners get a free week’s access to the MrTopStep Chat and trading tools. Enter your guess now!
Our View
Last week’s trading was the wildest we’ve seen in a long time. I haven’t witnessed so many 50- to 100-point up and down moves in a single day since the COVID pandemic. I think this is a sign of the times and that this volatility will continue beyond the end of summer. I get the feeling that the markets could remain in flux right up to the election, but I also think there will be a good buying opportunity for another push higher.
Although tech stocks have seemingly fallen out of favor, something miraculous has happened: the Russell 2000 logged its third consecutive week of gains. It’s worth pointing out that the Nasdaq 100 has declined in three straight weeks.
With 3M having its best day ever (+22%), the Dow jumped 654 points, or +1.6% on the day, and was up 0.70% for the week. The S&P 500 closed down 0.80% for the week, while the Nasdaq ended down 2.1% for the week and experienced its biggest daily drop since 2022 on Wednesday.
Remember, this Wednesday is the last trading day of July and also the second day of the Fed meeting, with a lot of talk about potential rate cuts before the September meeting. Additionally, there were significant earnings reports and important economic indicators, including the APD report and jobs number on Friday.
Our Lean
When I look at the ES and NQ charts, I see a lot of higher lows and back-and-fill going on, but I also see that when the futures rally early they sell off and rally again, both positives.
I think they could be in rally mode today. If the ES opens 10 to 20 lower, I’m buying the open and buying the pullbacks. If the ES gaps higher I would consider selling a 10 to 20 point higher open, but I want to get a look at the volume and the overnight inventory and then buy any 20 to 30 pont pull backs. Maybe a little short squeeze up to 5550.
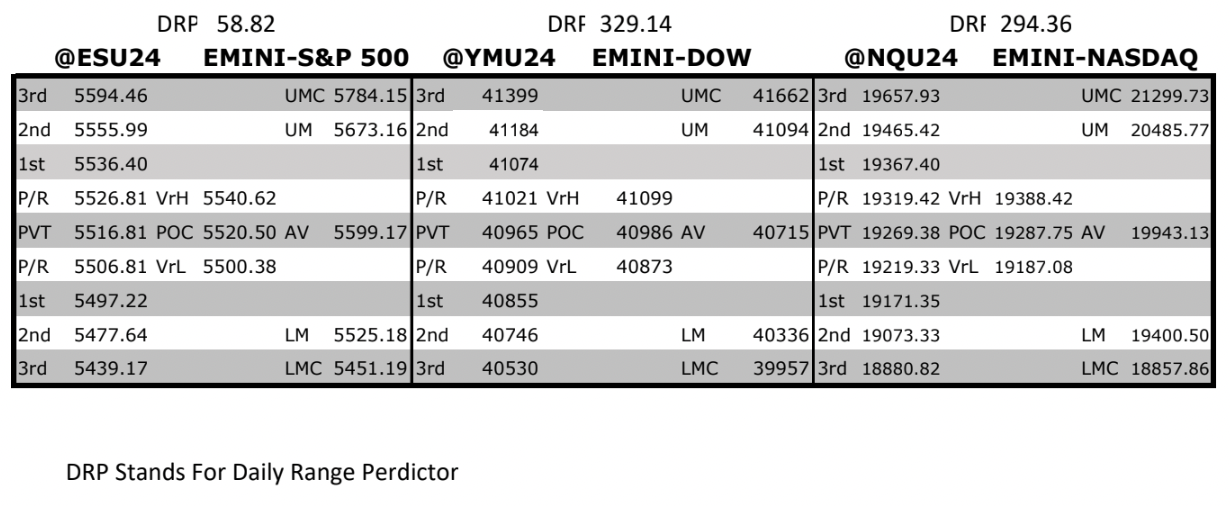
MrTopStep Levels:
MiM and Daily Recap
ES recap
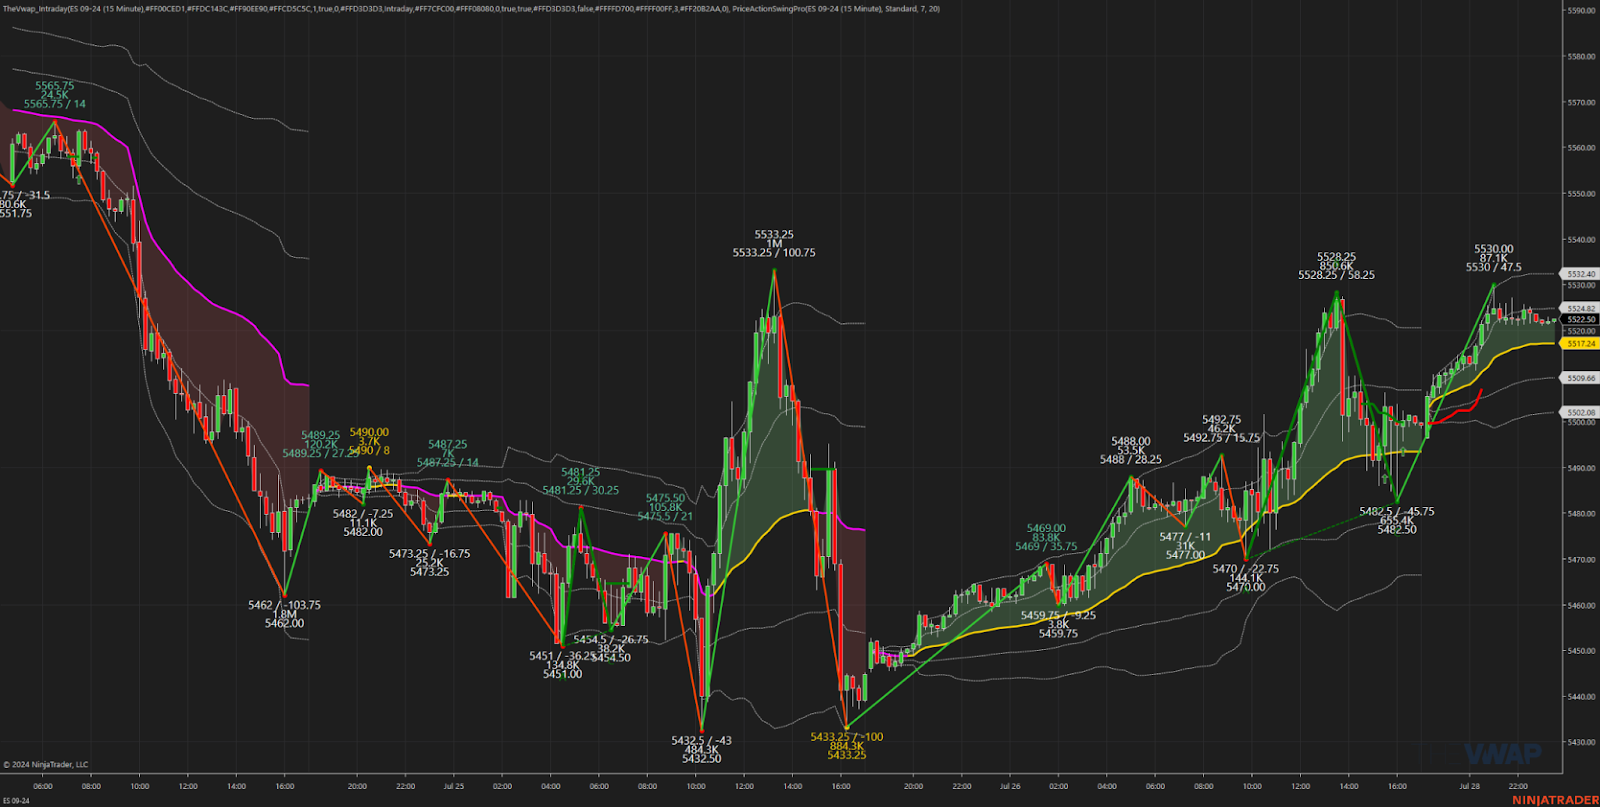
After reversing 100 points late in the day, the ES rallied to 5488.75 and traded 5478.50 at the regular session open on Friday at 9:30. After the open, the ES sold off to 5470.00, then fell into an upward chop, trading up to 5494.50 at 10:04. It then sold off to a higher low of 5475.00 at 10:10 and rallied up to 5501.75 by 10:30. Following this high, the ES sold off to 5471.75 at 10:36, then rallied to 5495.75 at 11:10. It made one last dip to 5483.00 at 11:18 before rallying 42 points to 5525.00, dipping to 5528.50, and trading up to 5528.25. At this point, the NQ started to decline, and the ES dropped 32.5 points to 5495.75.
After this drop, the ES bounced back to 5510.25, then sold off to 5486.00 at 3:08. It rallied to 5506.50 at 3:28, then sold off to 5484.75 at 3:36 before rallying to 5504.00 as the 3:50 cash imbalance showed $1.5 billion to buy. The ES then sold off to 5482.50 at 3:57 and traded at 5500.00 at the 4:00 cash close. After 4:00, the ES traded up to 5502.50 at 4:14, flatlined, and settled at 5499.25, up 58 points or +10.7%. The NQ settled at 19,175.75, up 185.50 or +0.93%. Crude oil settled at $76.44, down 1.84 or -2.35%. The 10-year note (ZNU4) settled at 111’070, up 0’135 or +0.38%. Gold (CGQ4) settled at 2,385.70, up $32.20 or +1.37%. Bitcoin (BTUQ4) settled at 68,900, up 2,880 points or +4.40% on the day. Everything was moving.
In the end the markets were oversold going into expiration Friday. In terms of the ES’s overall tone, both the ES and the NQ firm. In terms of the ES’s overall trade, volume was lower from Thursday’s 2.79 million volume — which was the highest volume since May 10, 2020 — with total volume of 1.893 million contracts traded.
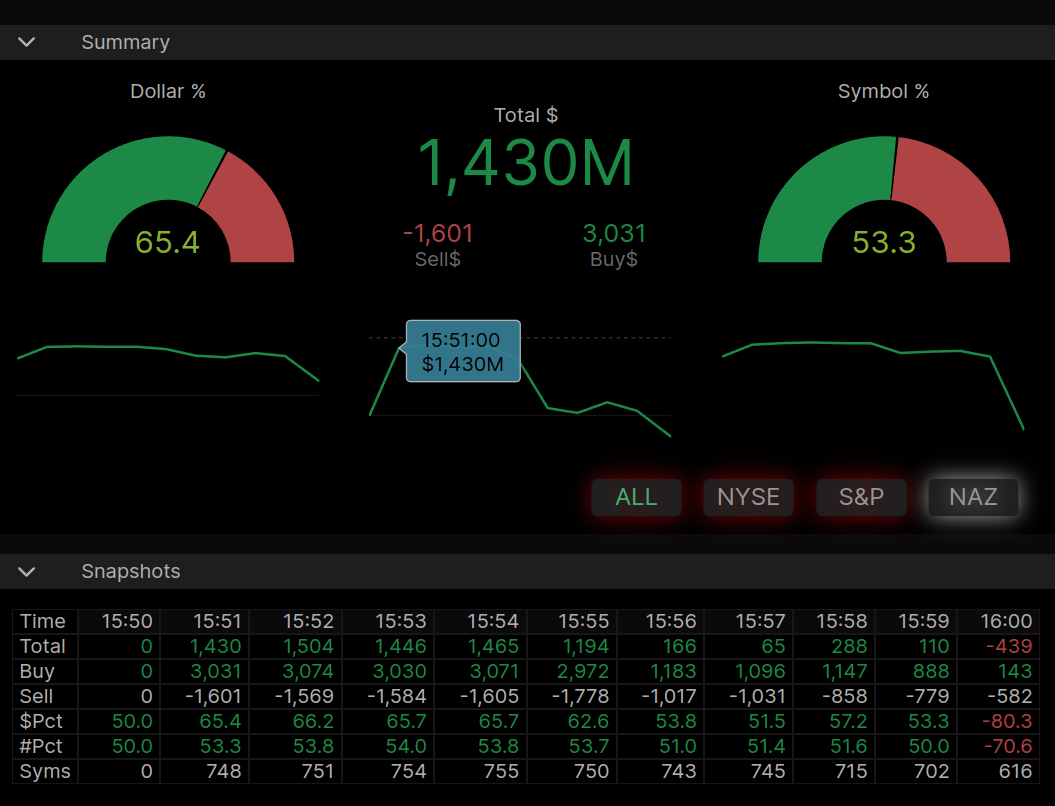
MIM
Technical Edge
-
NYSE Breadth: 82% Upside Volume (!)
-
Nasdaq Breadth: 66% Upside Volume
-
Advance/Decline: 81% Advance (!)
-
VIX: ~16.50
-
~15% off last week’s high
-
Guest Post — GMTT
GMTT is a market newsletter with a different approach than many others. Its focus is to find the tradable low or high in a market. Pre-warns when there is a turning point and aims to be ahead with entering a trade. It does result sometimes in small losses when it has been too early, but with given tight stops they tend to result in profitable trades.
They very much calculate the risk /reward ratio and when it is in accordance with their guidelines they enter the trade. GMTT daily update consists of shorter term trading signals and covers: E-mini S&P 500, VIX (cash), Gold, Silver, Copper, Crude, Nat Gas and BTC/USD.
Our team has more than 25 years of combined experience in analyzing and trading major global financial markets.
Gold
Today we highlight Gold that has been making all time new highs and so far printed this year a high of 2488.40.
GMTT called the last low in Gold late Feb 2024 and so far this year traded close to 2500. Nothing moves in one direction and gold is now technically on a short-term sell signal from July 19 which was triggered below 2448.
We gave a downside target of 2356 which was reached and gold bounced nicely off its lows. The sell signal gets canceled on a close above 2419. Medium-term outlook is a relatively wide range of 2380 – 2490. A close above 2490 is needed for Gold to move another leg higher.
Unlock your trading potential with our exclusive newsletter. Delivered once per day, the GMTT newsletter provides expert market insights, precise entry and exit levels, and in-depth technical analysis. Whether you’re a broker, hedge fund manager, or individual trader, our actionable advice ensures you stay ahead of market trends and make informed decisions. Join our community of successful traders and elevate your trading strategy today!
Subscribe now to start receiving our market analysis and insights!
Economic Calendar
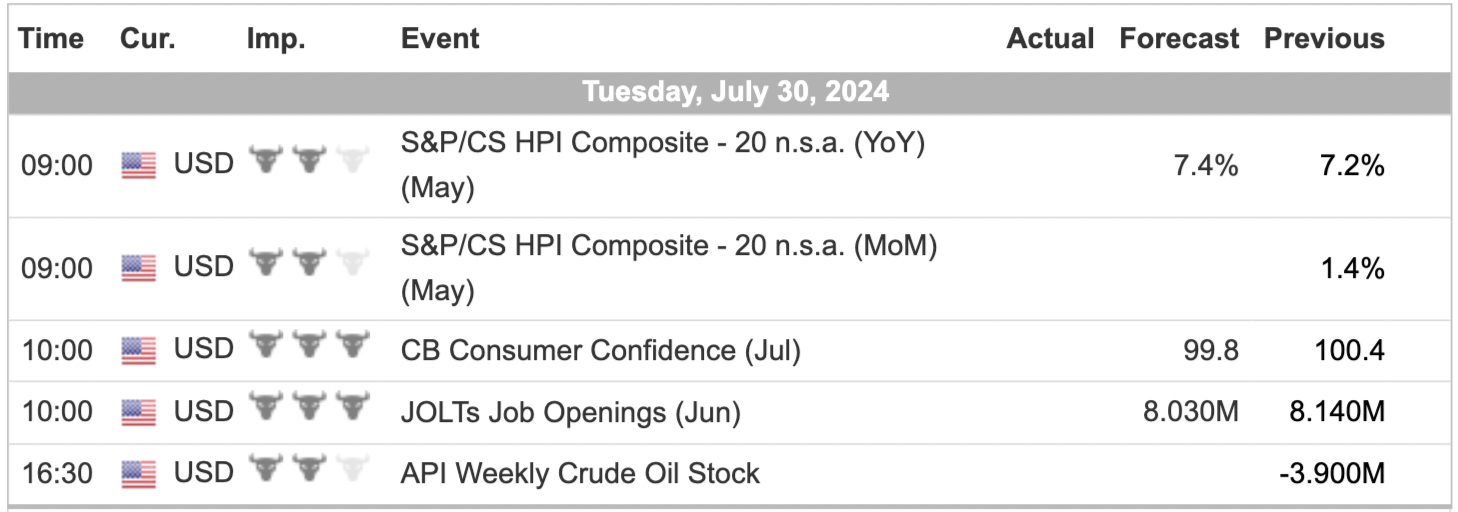
For a more complete Economic Calendar see: https://mrtopstep.com/economic-calendar/
Comments are closed