Black Monday
Volatility explodes
Follow @MrTopStep on Twitter and please share if you find our work valuable!
Every week, MrTopStep invites traders to an “Own the Close” contest where the closest guesstimate where the SPX will settle on Friday’s 4:00 cash close.
The winners get a free week’s access to the MrTopStep Chat and trading tools. Enter your guess now!
Our View
I wanted to do an update yesterday, but the markets were moving so fast I actually could not do one. That said, very early on I was saying this in the chat:
-
IMPRO : Dboy : (9:33:43 AM) : I do not know what the gap study says, but there should be a decent initial bounce.
-
IMPRO : Dboy : (9:34:02 AM) : should have bought the ES — easier to hold, and mentioned buying call lottos
While buying last Friday’s jobs gap down didn’t work due to the sheer size of the selling, yesterday was different. There was almost 1 million ES traded on Globex before the open, and the futures ES had fallen 180 points.
Overnight inventory for both the ES and NQ was 100% short, which is why I went long on the NQ. However, as I mentioned, the futures were moving so erratically that if you turned your head, the NQ could move 60 or 80 points within minutes, and the ES could move 30 or more points without missing a beat. The level of algorithmic and high-frequency trading programs was unprecedented, operating at a higher rate and in both directions throughout the day.
Additionally, MrTopStep has a program meter called SpyGate that alerts users with a noise when buy and sell programs are triggered and provides a live summary of the program sizes in dollar terms. According to SpyGate, the total value of buy programs was $36.78 billion, while sell programs amounted to $60.82 billion.
Our Lean
I have tried to take a lower profile when writing the Lean because I don’t want to say something that might change your mind if I end up being wrong. I never feel good about that. You’ve heard me say that I very rarely, if ever, change the Lean because my initial call is usually correct, but I may start reconsidering when I see a significant move overnight.
My original Lean was straightforward: when the markets are already weak and declining, a negative news piece can sometimes trigger a low, as was the case with NVDA yesterday. The markets often experience a sharp selloff after such news, reaching a low point.
That said, I’ll do my best to provide an update the next time I notice a similar situation.
Our Lean: Is the low in, or is this just another dead-cat bounce? I’m not sure if I’m leaning toward the idea that the low is in. I thought we might see a low this week, but I didn’t expect the ES to fall to 5120 so quickly. What the bulls need is some lower back-and-fill price action. The bears are looking for a significant gap up and some early morning sell programs to test how well they hold.
I can’t rule out selling a big gap-up on high Globex volume, buying the pullback, and looking for a long opportunity. However, the problem is that with ranges of 100 to 200 points, these rips and dips can easily be 50 to 100+ points. If you asked me, “DBOY, I have a gun to your head—up or down?” I would say up, but not without some shake, rattle, and roll.
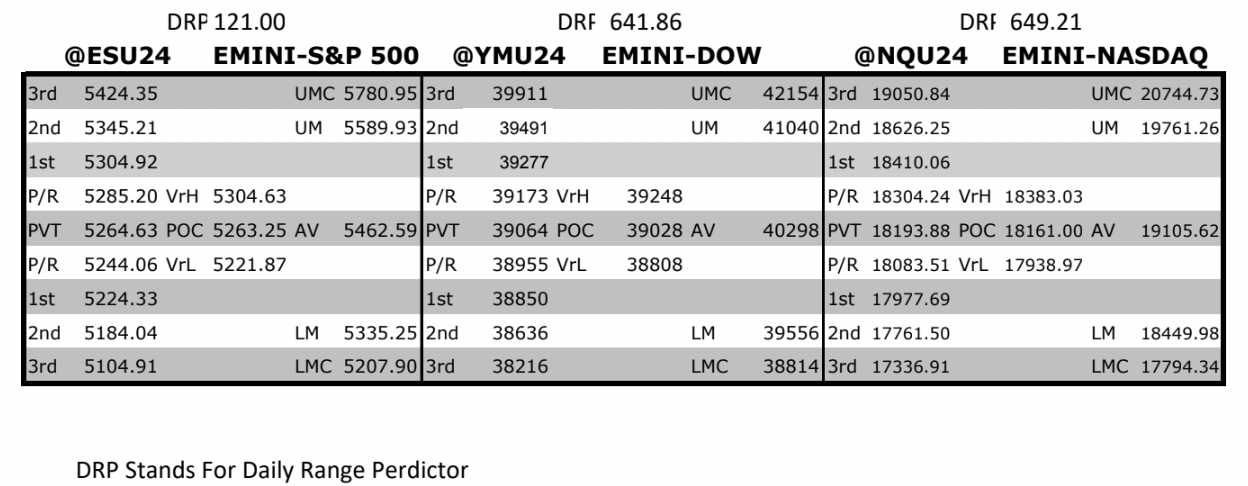
MrTopStep Levels:
MiM and Daily Recap
ES Recap
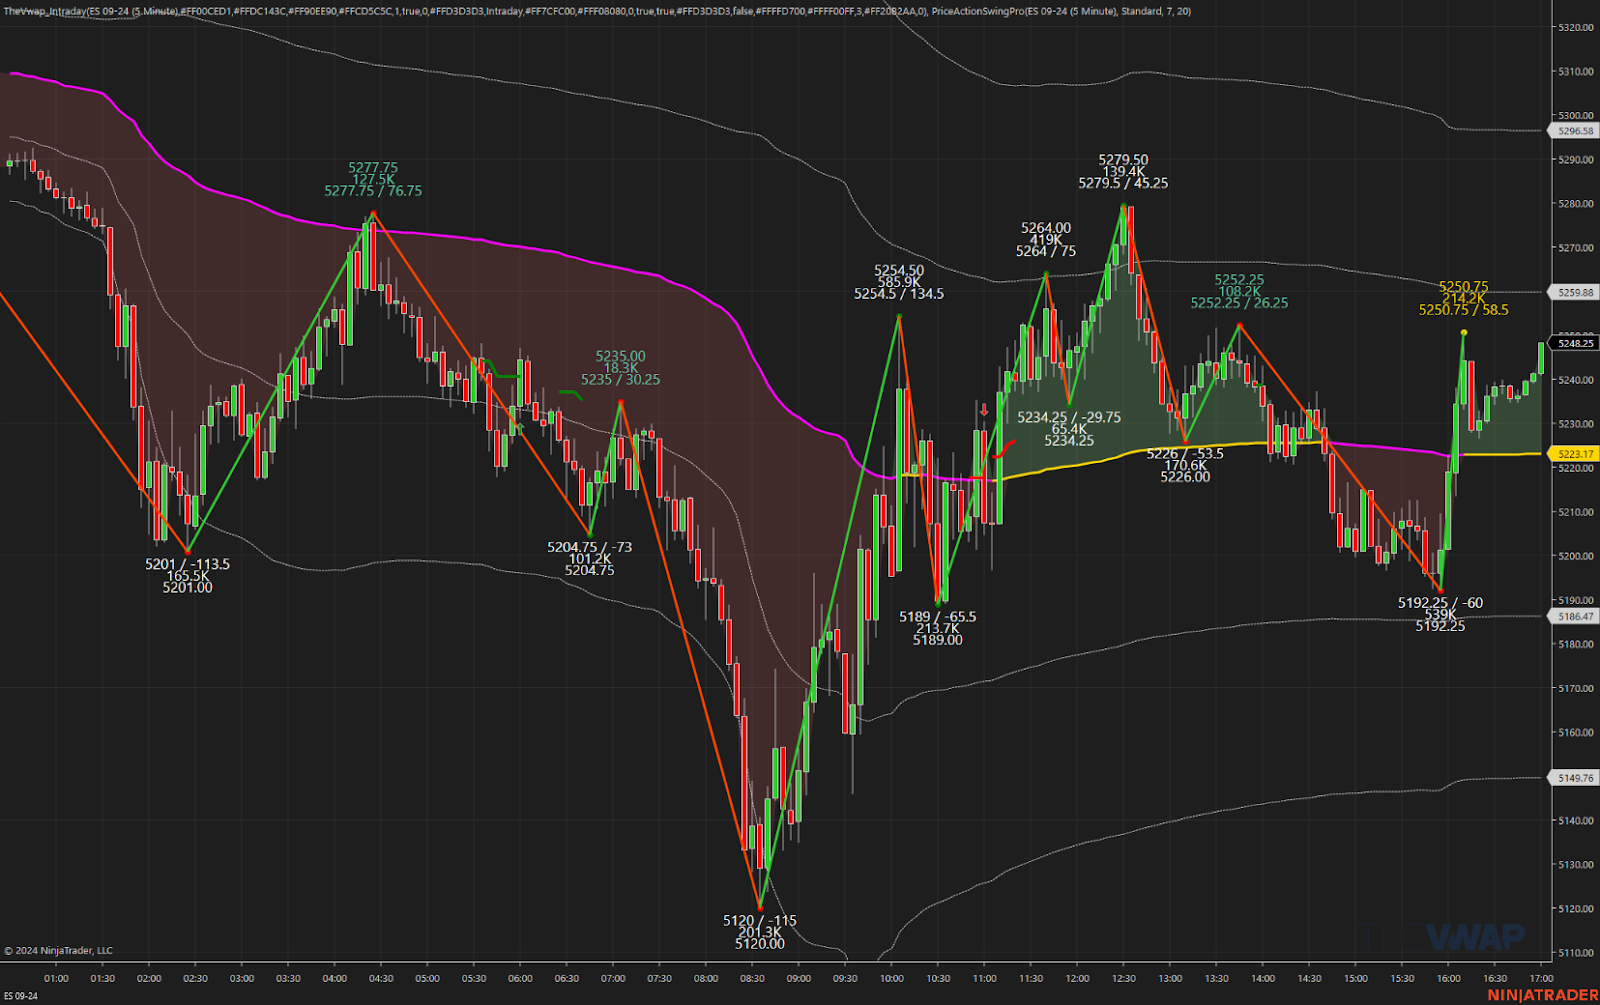
2024’s Black Monday saw the ES crash all the way down to 5120.00, down 237 points on Globex, and opened Monday’s regular session at 5159.50. After the open, the ES traded down to 5146.00 at 9:32 and then rallied 146 points up to 5452.50 just before 10:02. It then sold off to 5189.00, a 65.5-point drop at 10:33, rallied to 5235.50, dropped to a higher low at 5196.75, and then rallied to 5264.00, a 67.25-point pop at 11:40, with 205.6k ES traded from low to high. After the high, the ES traded up to 5264.00 at 11:39, sold off to 5234.25 at 11:54, and then reached the high of the day at 5279.50 at 12:30, a 159.5-point rally from the low of the day to the high. The 100 to 200-point moves in the ES are reminiscent of the 2008 credit crisis.
After reaching the high, the ES sold off to 5226.00 at 1:00, rallied to a lower high of 5252.25, then sold off to 5220.75 at 2:18. It rallied to 5212.75 at 3:33, pulled back to 5192.50 at 3:49, and traded at 5196.00 as the 3:50 imbalance showed $6.1 billion to sell. It sold off to 5192.25 at 3:51:25, rallied back to 5222.50, and traded at 5221.25 at the 4:00 cash close. After 4:00, the ES rallied to 5250.75 at 4:09, sold off to 5226.50, and settled at 5248.25, down 127.75 points or -2.38%.
The NQ settled at 18,146.75, down 409.50 points or -2.21%. The 10-year note settled at 114’010, down 0.035 or -0.10%. Gold fell 17.70 to 2,452.10 or -0.72%. Crude oil settled at 73.92, up 0.40 or +0.54%. Bitcoin settled at 54,700, down 8,750 points or -13.79%. Last but far from least, the VIX jumped to a high of 65.73 before the market opened, up about 42 points from its close on Friday, and closed at 38.57, its highest close in nearly four years.
In the end, the Magnificent 7 pushed the markets up and pushed them down. In terms of the ES’s overall tone it was a total kibosh on both sides. In terms of the ES’s overall trade, volume was extremely high with 964k on Globex and 2.321 million traded on the day session for a grand total of 3.285 million contracts traded.
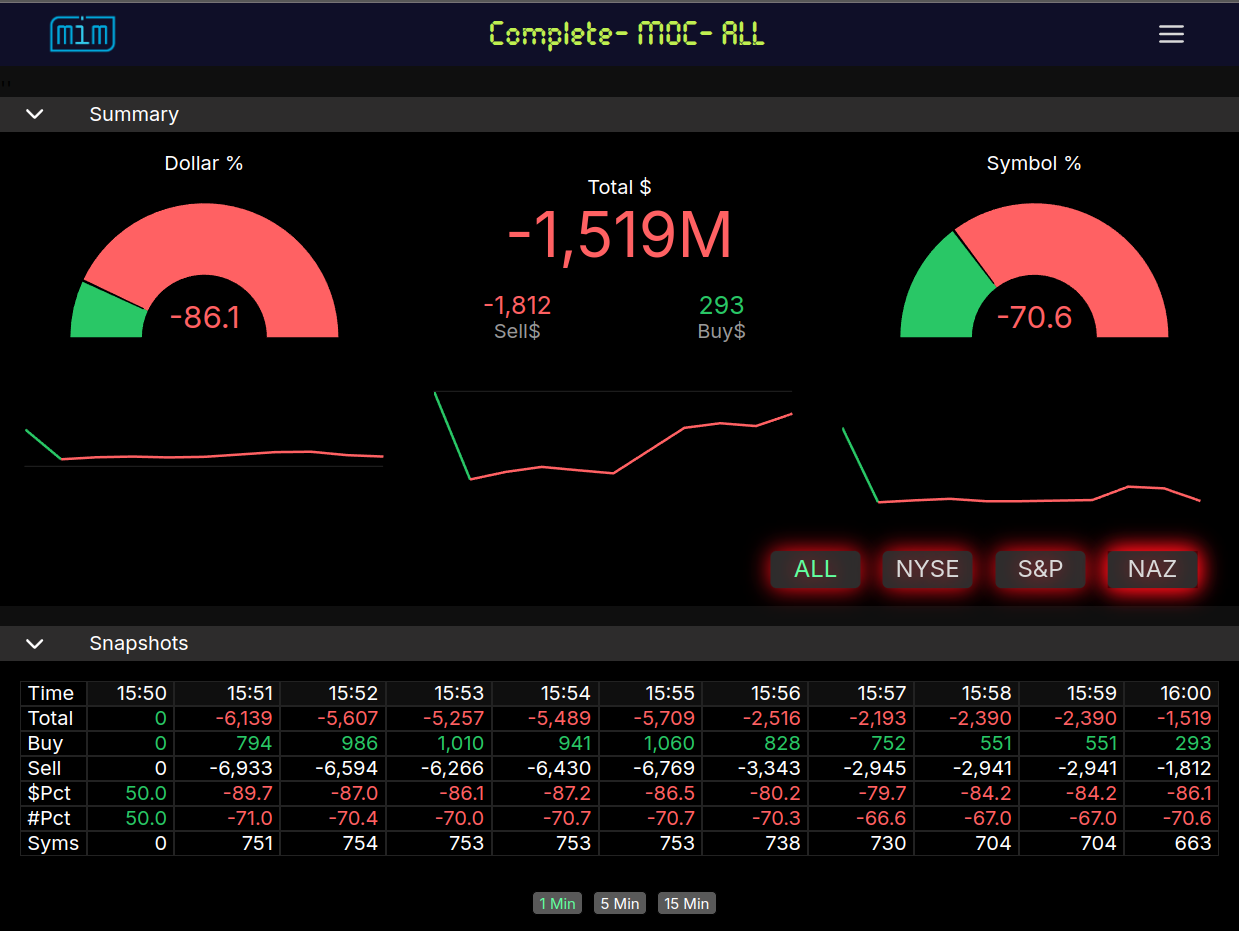
MIM Meter
Technical Edge
-
NYSE Breadth: 7% Upside Volume (!!)
-
Nasdaq Breadth: 20% Upside Volume
-
Advance/Decline: 7% Advance (!!)
-
VIX: ~33
Guest Post — Tradrr
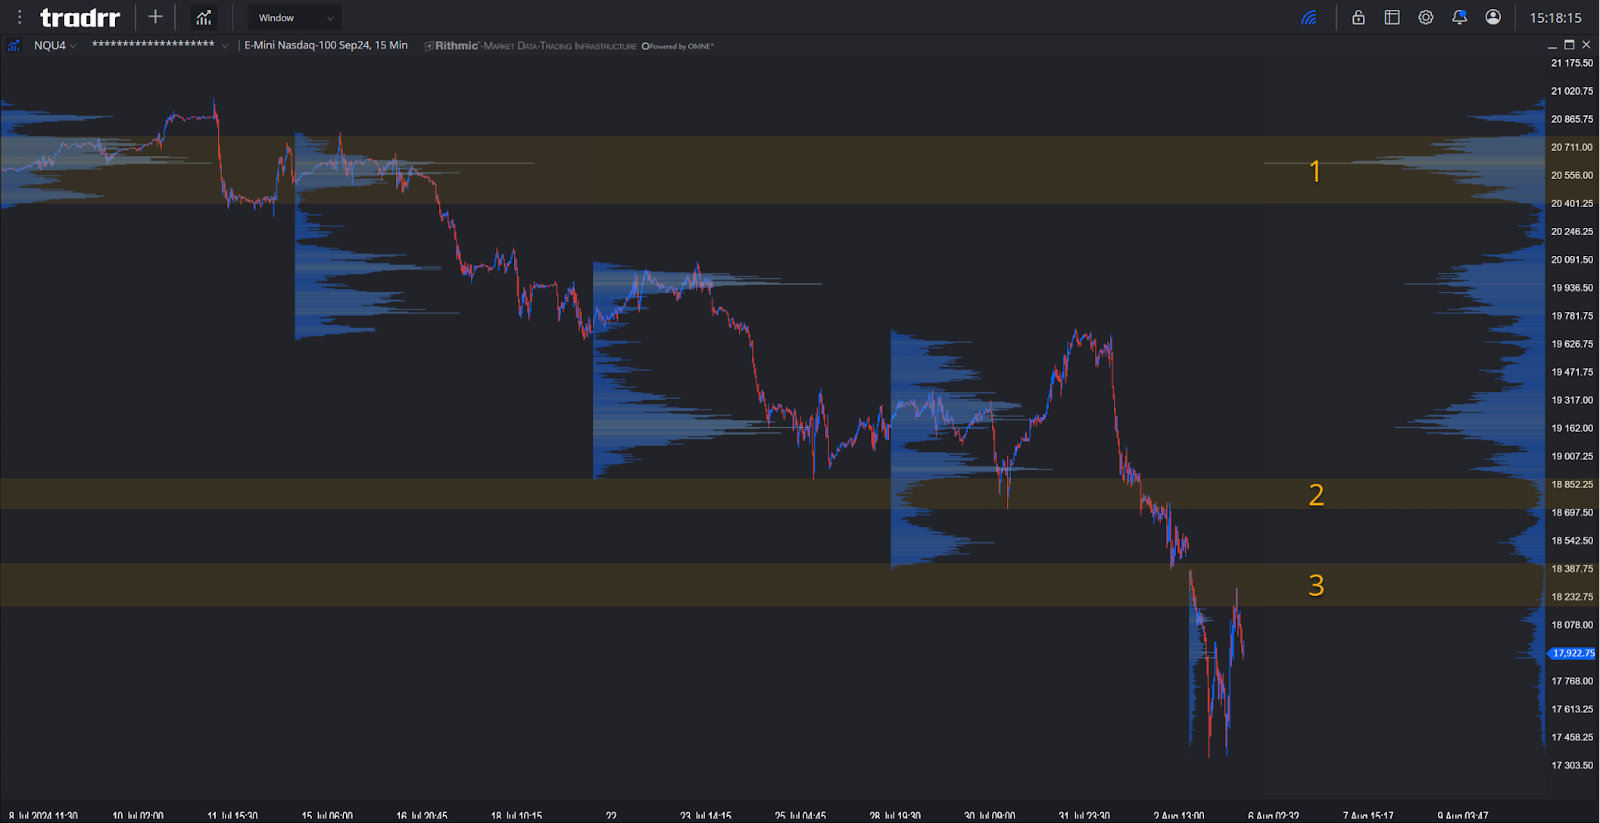
Considering the many headlines over the weekend and the heavy volatility at the start to the week from yesterday it becomes easy to get overloaded with information resulting in analysis paralysis.
Coming into the remainder of trading for the week we have zone 3 to consider as a line in the sand for upside trading as it encompasses the previous week’s low and is left as a low volume node from the current week’s open.
Should price be capable of repairing and gaining back some ground zone 2 could be the location to balance out and drag the POC lower for a more structurally supported move. Zone 1 would be the ideal location for buyers to return to gain traction to higher highs should lower prices get rejected and sellers unable to build structure to support themselves lower.
For more from Tradrr, please visit them here.
Economic Calendar
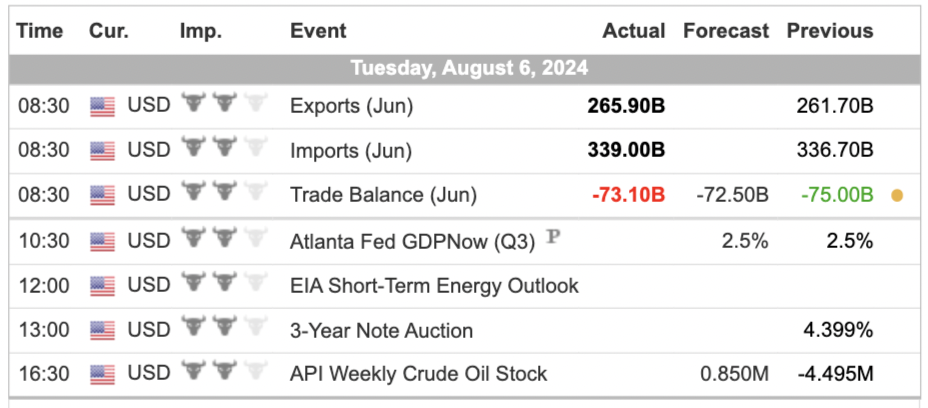
For a more complete Economic Calendar see: https://mrtopstep.com/economic-calendar/
Comments are closed