Where Are All the “Dip-Buyers?”
Middle East conflict is still a problem
Follow @MrTopStep on Twitter and please share if you find our work valuable!
Every week, MrTopStep invites traders to an “Own the Close” contest where the closest guesstimate where the SPX will settle on Friday’s 4:00 cash close.
The winners get a free week’s access to the MrTopStep Chat and trading tools. Enter your guess now!
Our View
Funny thing. The S&P and Nasdaq have had a hard fall, but something is missing! Where are all the traders screaming, “buy the dip!”
Remember when they used to say things like there is $2 trillion waiting to go into stocks…buy the dip. I am not going to list all the crashes and pullbacks, but “buy the dip” are the three greatest words in the history of the stock market.
Every crash has eventually turned into new highs, but sometimes it takes longer than people would like. The one that sticks out to me is the 2008 credit crisis. If you bought the dip in the SPX cash at its March 2009 low at 666.75 and held it to the July 2024 all-time contract high at 5669.67, it turned into one of the largest bull runs in history with a gain of more than 5,000 points or 750%.
It’s not always easy to buy when everyone is selling. According to Goldman Sachs, after a 5% drop from a recent high, the S&P 500 has generated a median return of 6% over the following three months.
2000 Tech Bubble
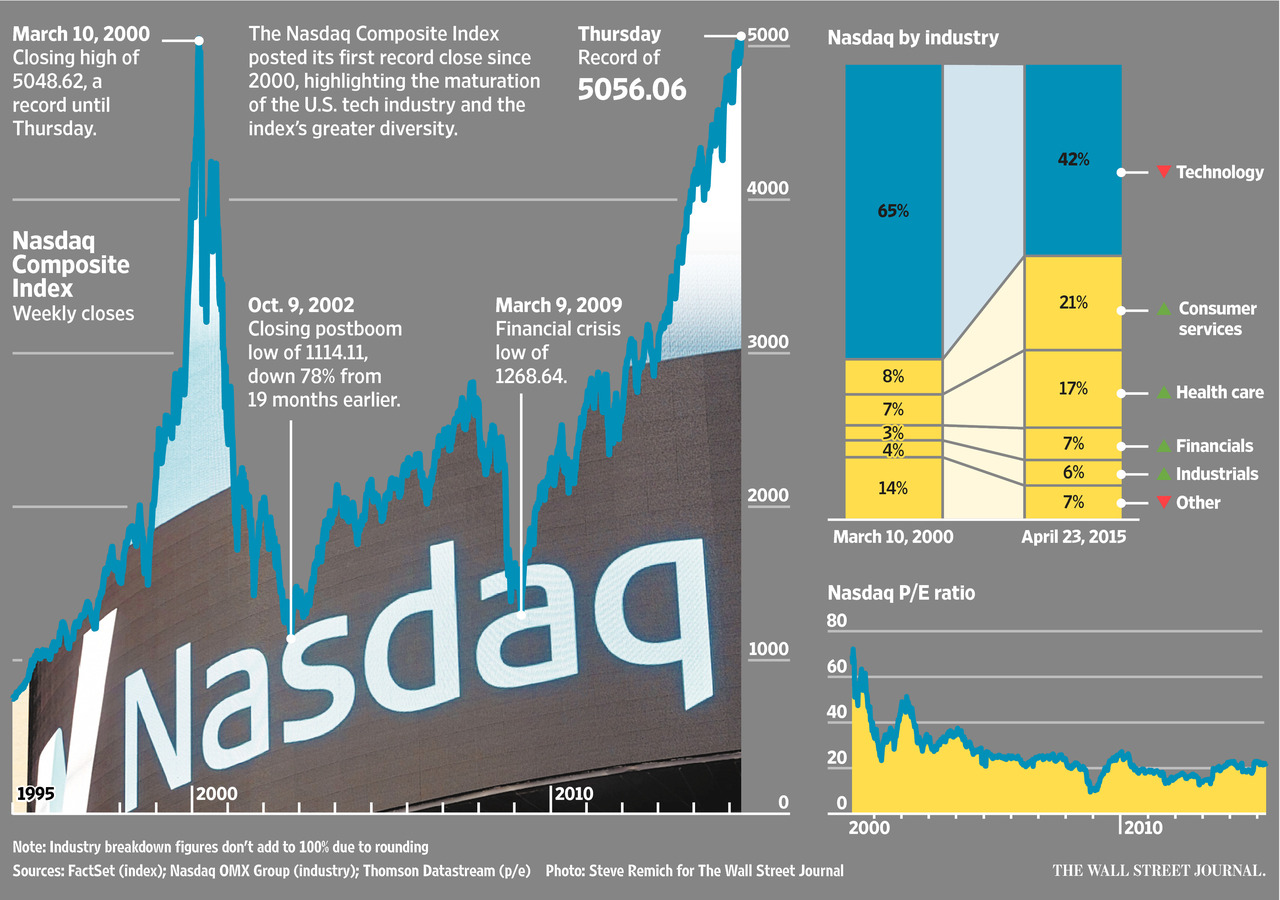
Now a look at tech.
After the 2000 tech bubble popped, the Nasdaq Composite made its low at 1,108 in October 2022 (and then almost double-dipped in 2008-09, with a low at 1,265 in March 2009). Nevertheless, the Nasdaq made its all-time high at 18,671 in July 2024, a gain of 17,562 points or 1,584%.
But the 2000 tech-bubble was different…
I remember one of the guys at my desk bought the QQQs just before the tech crash and it took 15 years to get back to the dot-com highs. Today the tech sector is different. The number of companies in the index has fallen from 4,824 companies in March 2000 to 2,569 today. Unlike 2000 when 65% of the Nasdaq’s market cap were technology stocks, today it’s down to 43%. Further, there are multiple sectors, including consumer discretionary, healthcare, and industrials, among others.
We all know how much the S&P and Nasdaq have rallied. What we don’t know is what a real crash looks like and I don’t think we have seen one yet.
Our Lean
While the ES still looks set to go higher, Iran remains front and center. That said, the week ahead could create new obstacles in the form of a very busy economic calendar. The NFIB optimism index and PPI are on Tuesday, and the CPI is on Wednesday.
On Thursday, we have Initial Jobless claims, Empire State manufacturing survey, Philadelphia Fed manufacturing survey, Retail sales, Import price index, Industrial production, Capacity utilization, and Business Inventories Thursday.
Then on Friday, we have Consumer sentiment, Housing starts, Building permits, and the Home Builder Confidence index on Friday.
I would usually not post the economic calendar, but with the Fed still talking rate cuts after a disastrous July jobs report, all data will be suspect.
Our Lean
I may have been overly cautious, but I still think an Iranian attack on Israel is imminent. Iran is playing a game of cat and mouse and keeping Israel in a state of uncertainty. If you are following Iran’s warning about an attack being carried out in 3 or 4 days, the Jewish holiday Tisha B’av is August 13th.
Our Lean: Volume has fallen by over a 1 million contracts from early last week. This makes it easy to push higher and hard to sell on down-ticks. If the ES gaps 10 to 20 points higher, I am selling the open and/or the first rally above and will try to hold part of the position if they keep going down. If the ES bounces, I’ll get out. I may buy some pullbacks, but I really think if there is an attack it won’t be a one and done thing, I think it will go on for days.
Sometimes people don’t want to think about the realities of war, but on Saturday a member of the Iranian Parliament’s National Security Commission, Ahmad Bakhshayesh Ardestani, warned that an attack on Israel from Iran could “be carried out by surprise and may even last three to four days.” The Iranian lawmaker added that Tehran “is certainly prepared for the consequences of such an attack and will be ready for any subsequent developments.” Iran has said that all of its proxies will be involved. I was wrong to think Iran would go early on because it adds to Tisha B’av – August 13. This solemn day is a reminder of the destruction of the First and Second Temples in Jerusalem, which occurred on the same Hebrew calendar date.
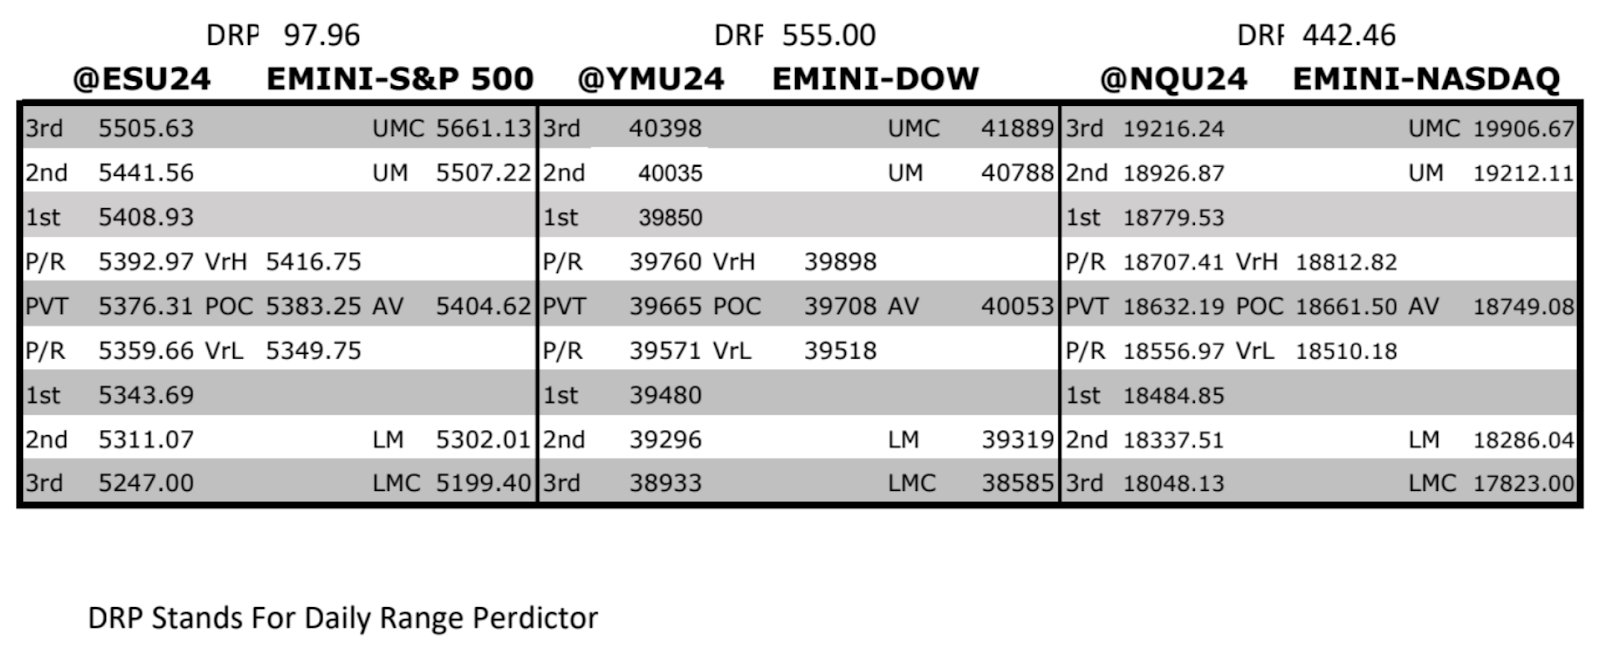
MrTopStep Levels:
MiM and Daily Recap
ES Recap
The ES rallied on Globex up to 5372.00 at 5:00 a.m., then sold off to 5319.50. It rallied again to 5339.75 at 9:20 and opened Friday’s regular session at 5337.50. After the open, the ES traded down to 5334.00, then rallied to 5351.00 at 9:40. It sold off to a higher low of 5324.75 at 9:52, then rallied 33 points to 5357.75 at 10:15. The ES then dropped 24.75 points to another higher low at 5333.00 at 10:30, before rallying 33.5 points to 5366.50 at 11:10.
After this high, the ES made a few lower highs and then dropped to 5346.75, rallied to 5358.50, and then dropped straight down to 5343.25. It sold off 20.75 points to 5337.75 at 12:27. After this low, the ES rallied 47.50 points to 5385.25 at 1:33, then sold off to 5354.25 at 2:36. It traded up to 5372.50 at 3:22, pulled back to 5366.25 at 3:39, and then rallied to 5373.75. It traded at 5369.75 as the 3:50 cash imbalance showed $400 million to buy, rallied up to 5365, sold off to 5360.25, and then rallied to 5374.00 at 3:59. It traded 5368.75 at the 4:00 cash close, then after 4:00, the ES rallied to 5370.25, then slightly ticked down to 5365.25 at 4:27 and settled at 5365.00, up 12 points or +0.22%. The NQ settled at 18,602.50, up 37.50 or +0.20%.
In the end, it was exactly like I said: A two-way street. In terms of the ES’s overall tone, it acted firm. In terms of the ES’s overall trade, volume was low with a total 1.35 million contracts traded.
Technical Edge
-
NYSE Breadth: 57% Upside Volume
-
Nasdaq Breadth: 58% Upside Volume
-
Advance/Decline: 50% Advance
-
VIX: ~20

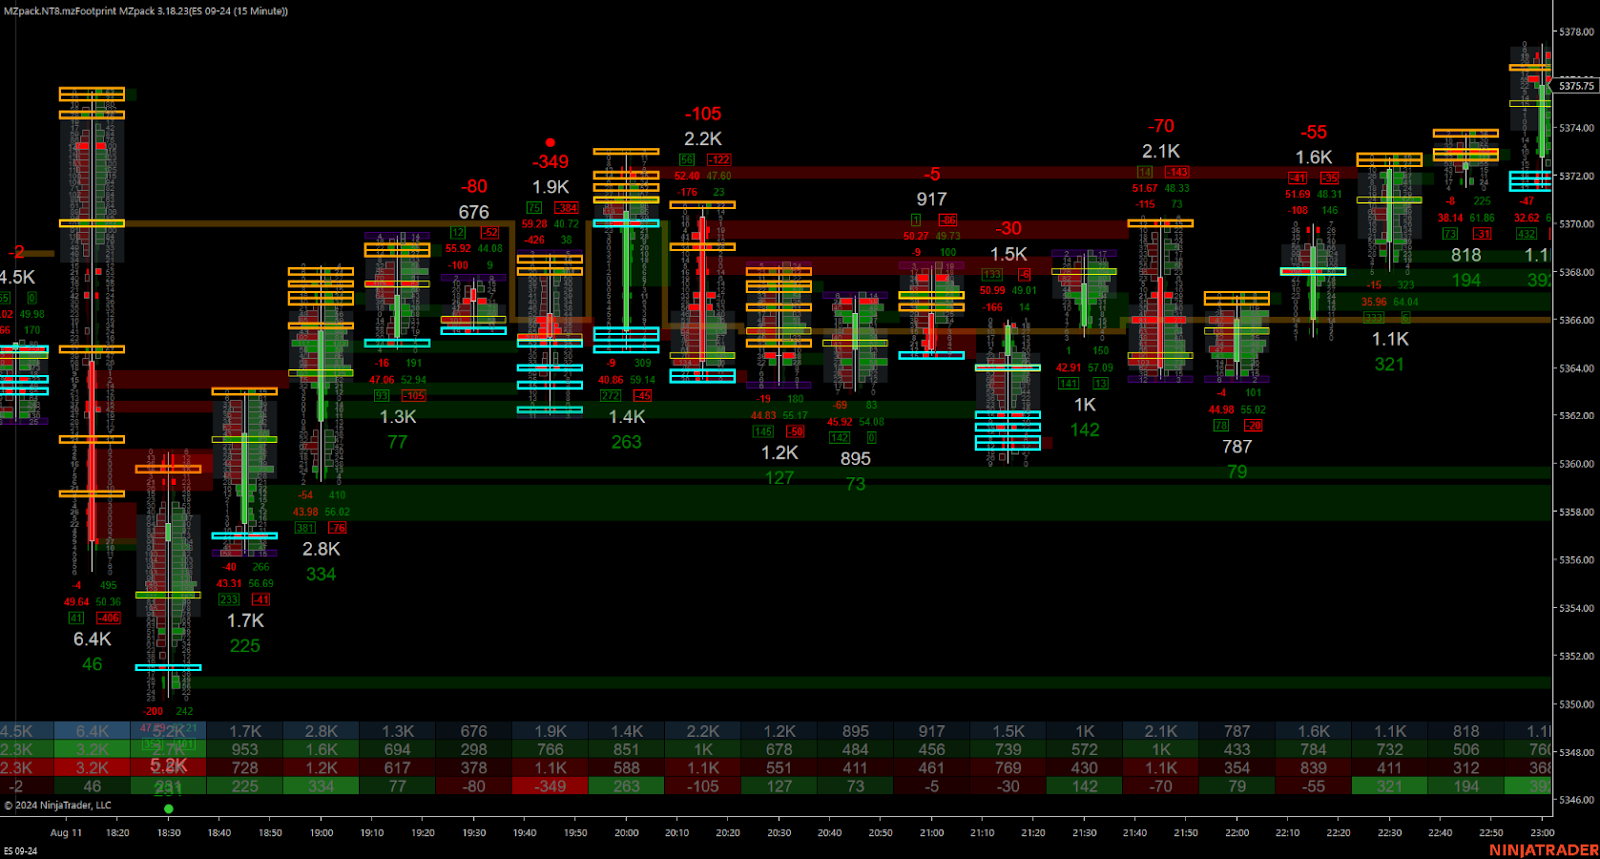
ES – Daily

NQ – Daily
Economic Calendar
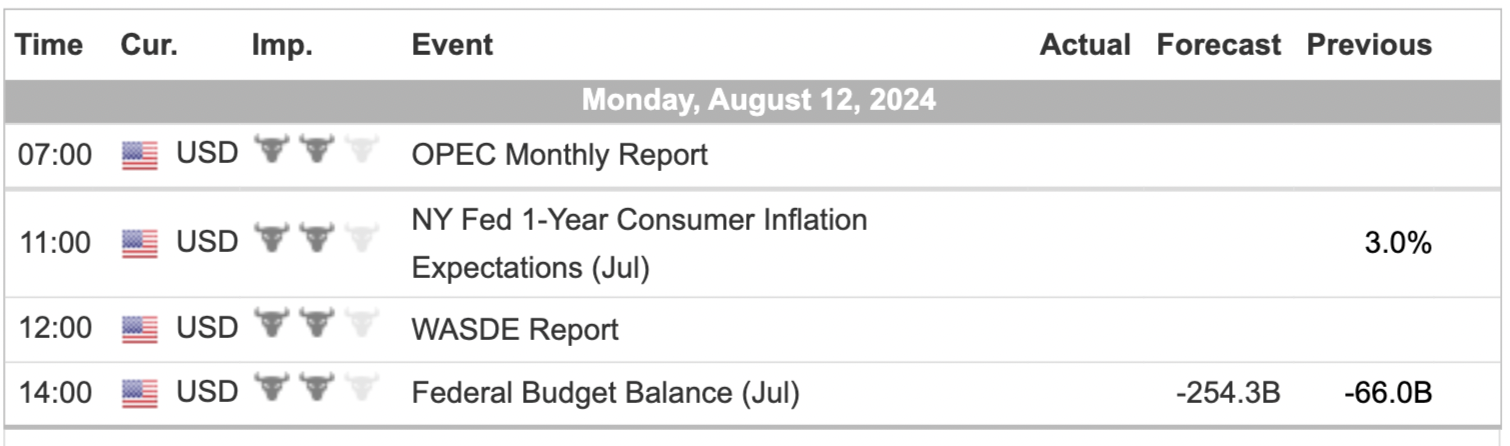
For a more complete Economic Calendar see: https://mrtopstep.com/economic-calendar/
Comments are closed