Remember to Zoom Out When You’re Trading
Powell’s on tap at 10 ET
Follow @MrTopStep on Twitter and please share if you find our work valuable.
Our View
As unpredictable as things are, I want to spend some time on the week ahead. I have said this before, and I’ll say it again: it’s always beneficial to be able to read your charts. However, I also believe that the Stock Trader’s Almanac and my good friend Jeff Hirsch would agree that it’s not just today we should be focusing on; there should also be a focus on the bigger picture by looking ahead, and for that matter, a historical perspective.
According to the STA, the period from August 3rd to the last trading day of August has seen the S&P up 19 years in a row from 2003 to 2021 and down 0.7% in 2022. On the next-to-last trading day of August, the S&P has been down 18 of the last 27 years. On the last trading day of August, the S&P has been up 13 of the last 23 years, but down in five of the last eight years.
Labor Day is on Monday September 2nd, and the markets are closed. The day after Labor Day, the S&P has been up 16 of the last 29 years, but down 10 of the last 13. The first trading day of September has seen the S&P up 17 of the last 28 years, but down nine of the last 15.
Portfolio managers returning from Labor Day often use September to clean house, making it the biggest percentage-losing month for the S&P, Dow, and NASDAQ since 1950. A streak of four September gains for the Dow, averaging 4.2%, ended in 1999, with six consecutive losers averaging -5.9%. The S&P has opened strong 17 of the last 28 years, but tends to close weak due to end-of-quarter mutual fund portfolio restructuring.
On the last trading day of September, the S&P has been down 19 of the last 30 years. September triple witching can be particularly volatile, and the week after often shows weak performance.
Our Lean
I think it’s easier picking a low than picking a top, but when the ES is up 8 or 9 days in a row it gets a little frothy. First off, Powell doesn’t “speak” at 10:00, it’s a prepared speech. You know how I always talk about volumes and we all know volume increases during big selloffs and thins out as the ES rallies/short covers.
In addition to following the ES, NQ and CL volume, I also like to look at the NYSE volume. Yesterday total volume was only 830 million, with half the volume trading in the last 15 minutes of the day. When ES is constantly just under or just over 1 million contracts, it actually creates a problem for both the buyers and the sellers. When volumes are this low, program trading blips can knock the little guys out in many cases.
Our Lean: When I wrote the OP Wednesday afternoon I did what I could finish, went to dinner, came home about 8:45 and passed out. When I woke up at 1:30 am with all my clothes still on, I forwarded the OP to the editor and never finished the lean.
I have written about the NQ weakness all week and it finally reversed yesterday after the gap-up and small pop. I think the question today is, did yesterday’s selloff front-run Powell’s 10:00 remarks? I’m not sure if they ‘sell the news’ or they already sold it. The other part that no one is talking about is, today is the Week 4 Friday options expiration.
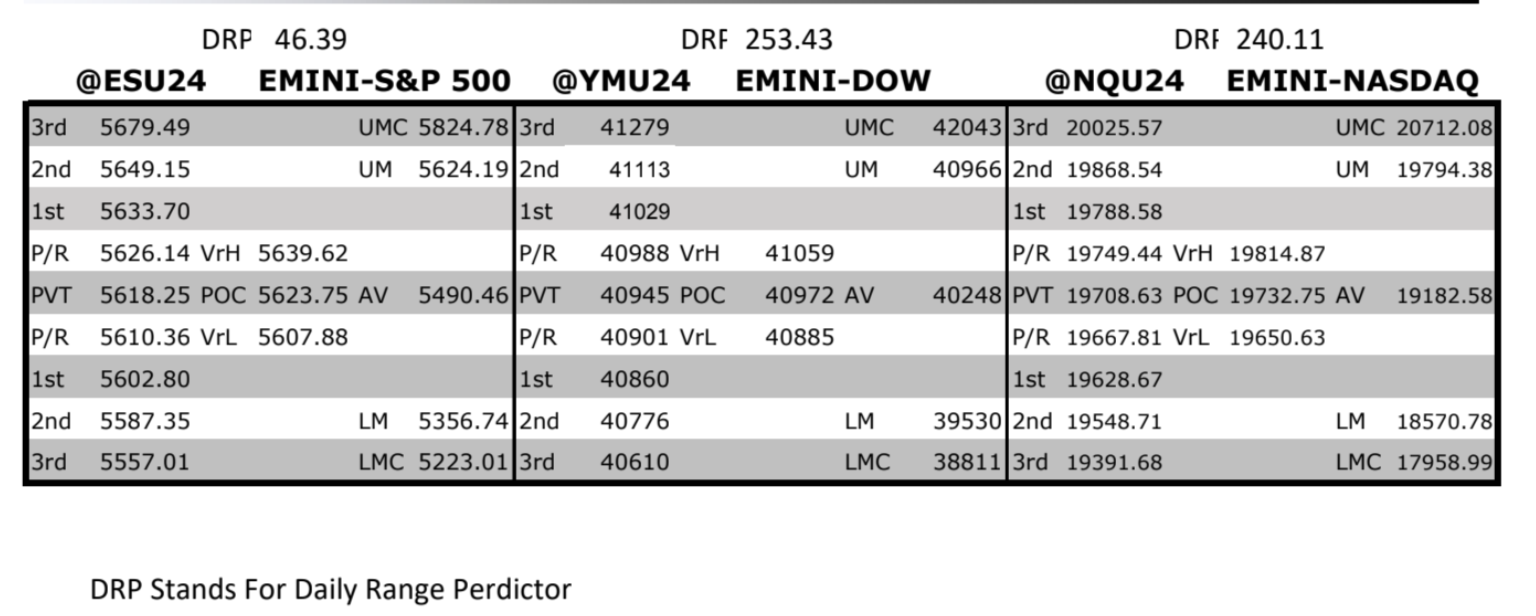
The 50% retracement from the 5665.25 high to the 5582.75 low is 5624 and as I am writing this, the ES just traded 5607.00 at 8:33 pm, which is right up against the 5605.75 high from the late afternoon. Above there I see 5611, 5625.50 and 5633. If the ES gaps 10 to 20 lower, I’m buying the open and selling the pop. If the ES gaps 20 to 30 higher, I am a seller, but I’m just not sure what effect Powell’s headlines will have and how it will impact the tape throughout the day.
I’ll do an update if I see something big.
MrTopStep Levels:
MiM and Daily Recap
ES Recap
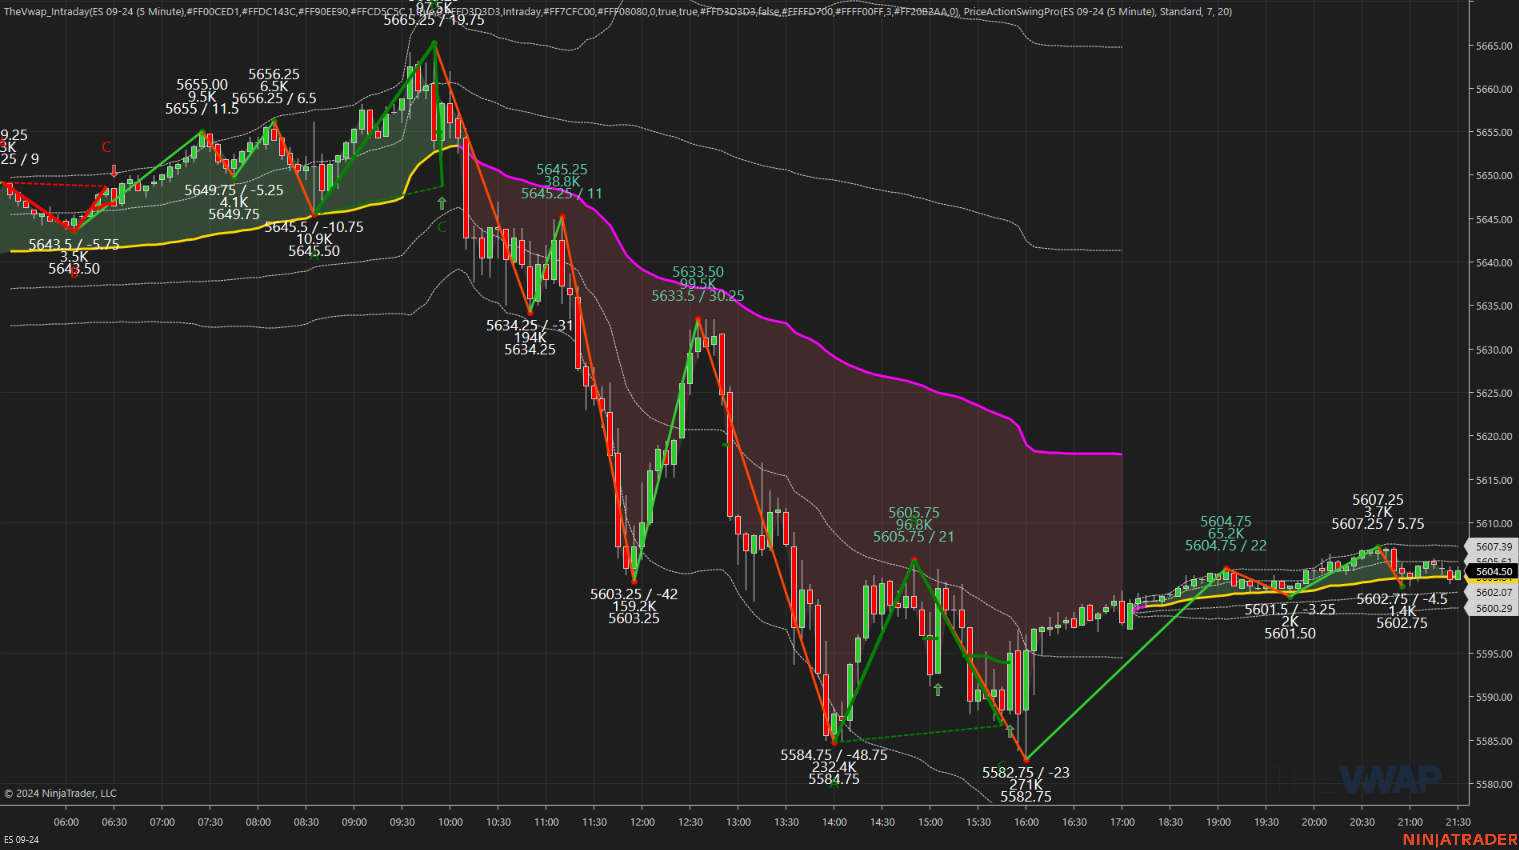
The ES made a low of 5651.25 on Globex, rallied up to 5658.25 at 9:06 a.m., and opened Thursday’s regular session at 5658.75. After the open, the ES traded at 5656.75, bobbed and weaved its way up to a lower high of 5662.00, and then dropped 15.75 points to 5637.75 at 10:12. After the low, the ES bounced back up to 5647.00, another lower high, and then sold off to 5634.25 at 10:50. The ES rallied back up to 5645.25, another lower high, and then dropped to 5603.25 at 11:52, a 42-point drop. It then rallied back up to 5633.50 at 12:32 before dropping 32.5 points to 5601.00.
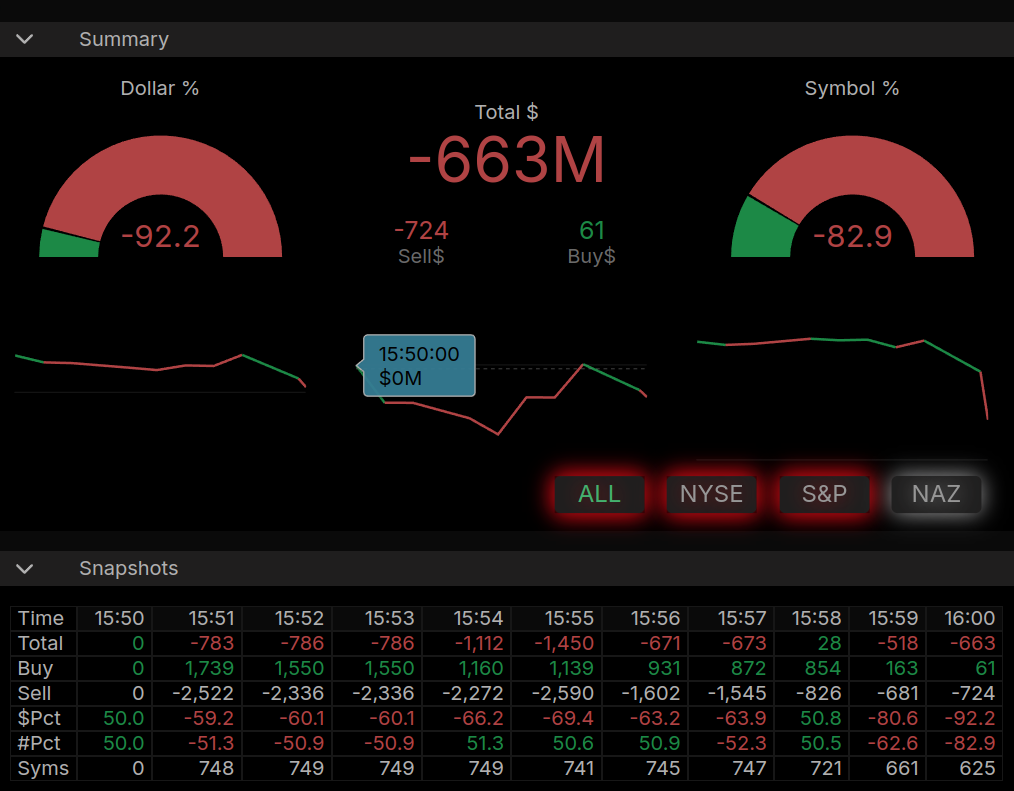
The ES then rallied back up to 5617.00, but was hit by a big stop run that pushed it down to a new low of 5593.75 at 1:30. It rallied up to 5605.75 at 1:38 and then dropped to a new low of 5584.75 at 2:00. After this low, the ES rallied back up to 5605.75 at 2:48 and then sold off to 5587.25 at 3:36. The ES traded at 5595.00 as the 3:50 cash imbalance showed $650 million to sell, then traded up to 5595.75 on the 4:00 cash close. After 4:00, the ES traded up to 5598.00 and settled at 5598.50, down 43 points or -0.76%. The NQ settled at 19,612.25, down 297.25 points or -1.49% on the day.
In the end, rumors and the continued selling pressure in the NQ has been a major factor over the last few sessions. In terms of the ES’s overall tone the NQ was again the weak link. In terms of the ES’s overall trade, volume was higher but not high at 1.31 million contracts traded.
Technical Edge
-
NYSE Breadth: 28% Upside Volume
-
Nasdaq Breadth: 36% Upside Volume
-
Advance/Decline: 33% Advance
-
VIX: ~17
Guest Posts — SpotGamma
SpotGamma is one the the shining stars of the options markets. If you have never heard of them or already know of them and have never signed up for their options flow products or the SG Academy, I fully suggest you check them out and add them to your trader’s toolbox.
Here’s a snippet from them:
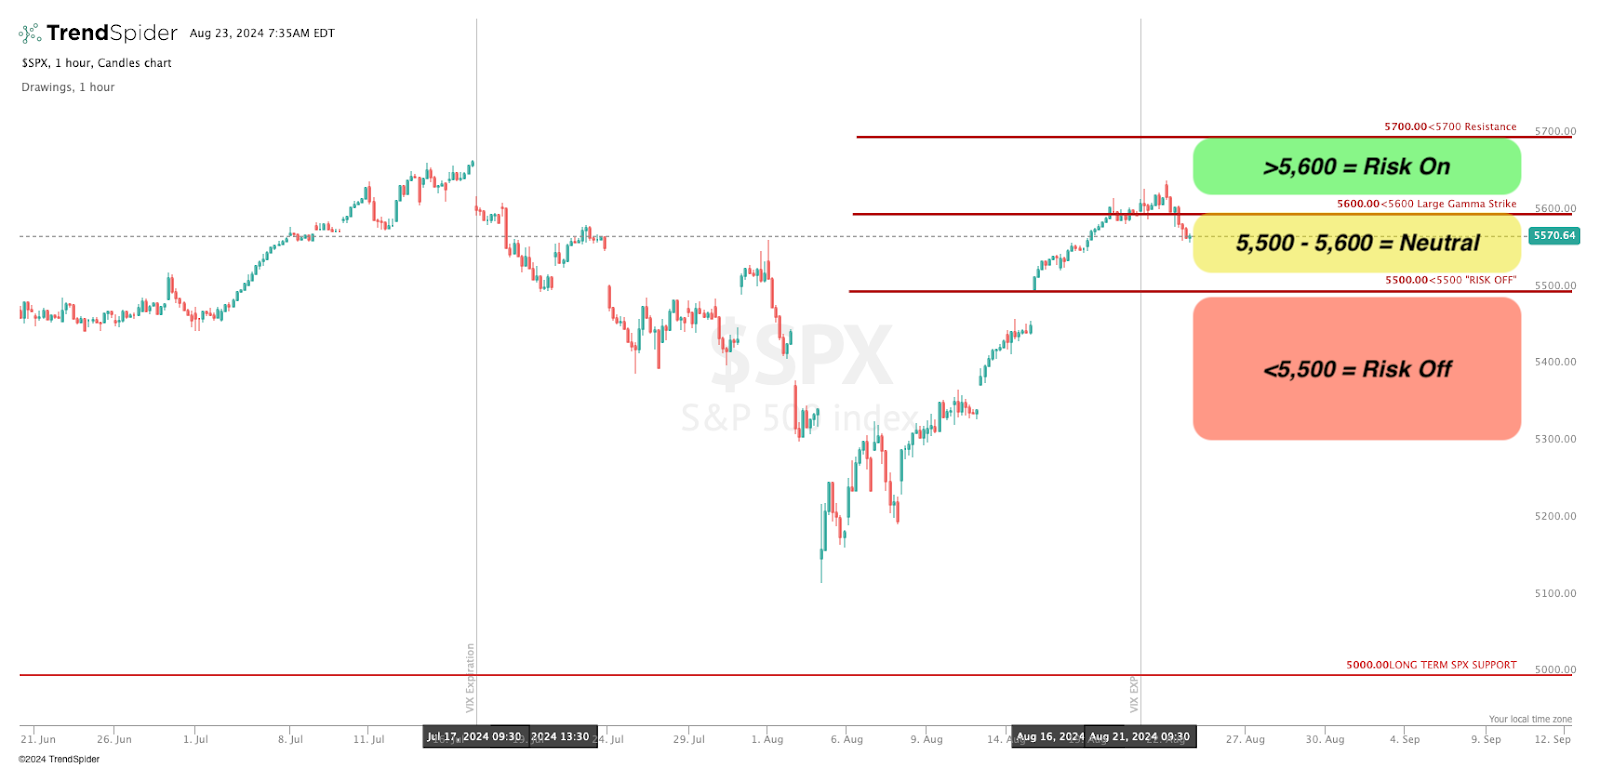
Things now rest with the read on Powell at 10AM, which feeds into NVDA on Wednesday. There are a matrix of possibilities out of these two events, with “soft landing”/dovish Powell and NVDA blowout-earnings likely paving the way for higher stocks. Inside of that is a realm of possibilities, and so rather than guess, we are set to read the options data, including large zones of gamma (positive & negative) and implied vols.
Our prime concern here is not navigating upside – we will generally hold stocks as long as the SPX is > Vol Trigger (5,545), but in this case we mark 5,600 as our “risk on” strike because of the potential shift in gamma & vol around Powell. Should the market continue to rise from here, our risk off trigger points (ex: Vol Trigger) should slide higher as options positions roll, helping us to maintain risk exposure.
The downside is much trickier, and much more of a concern. While traders shrugged off the violent downside of early August, we think it exposed a very soft, illiquid underbelly to this market. Recall that on Thursday 8/1 & Friday 8/2 (before the 8/5 VIX +50 spasm) the SPX had declined by -3.5%, with the VIX moving to 20. Further, it seemed to us that traders tried to short that Friday 8/2 vol spike, and were very lucky that vol quickly mean reverted on Monday morning.
Economic Calendar
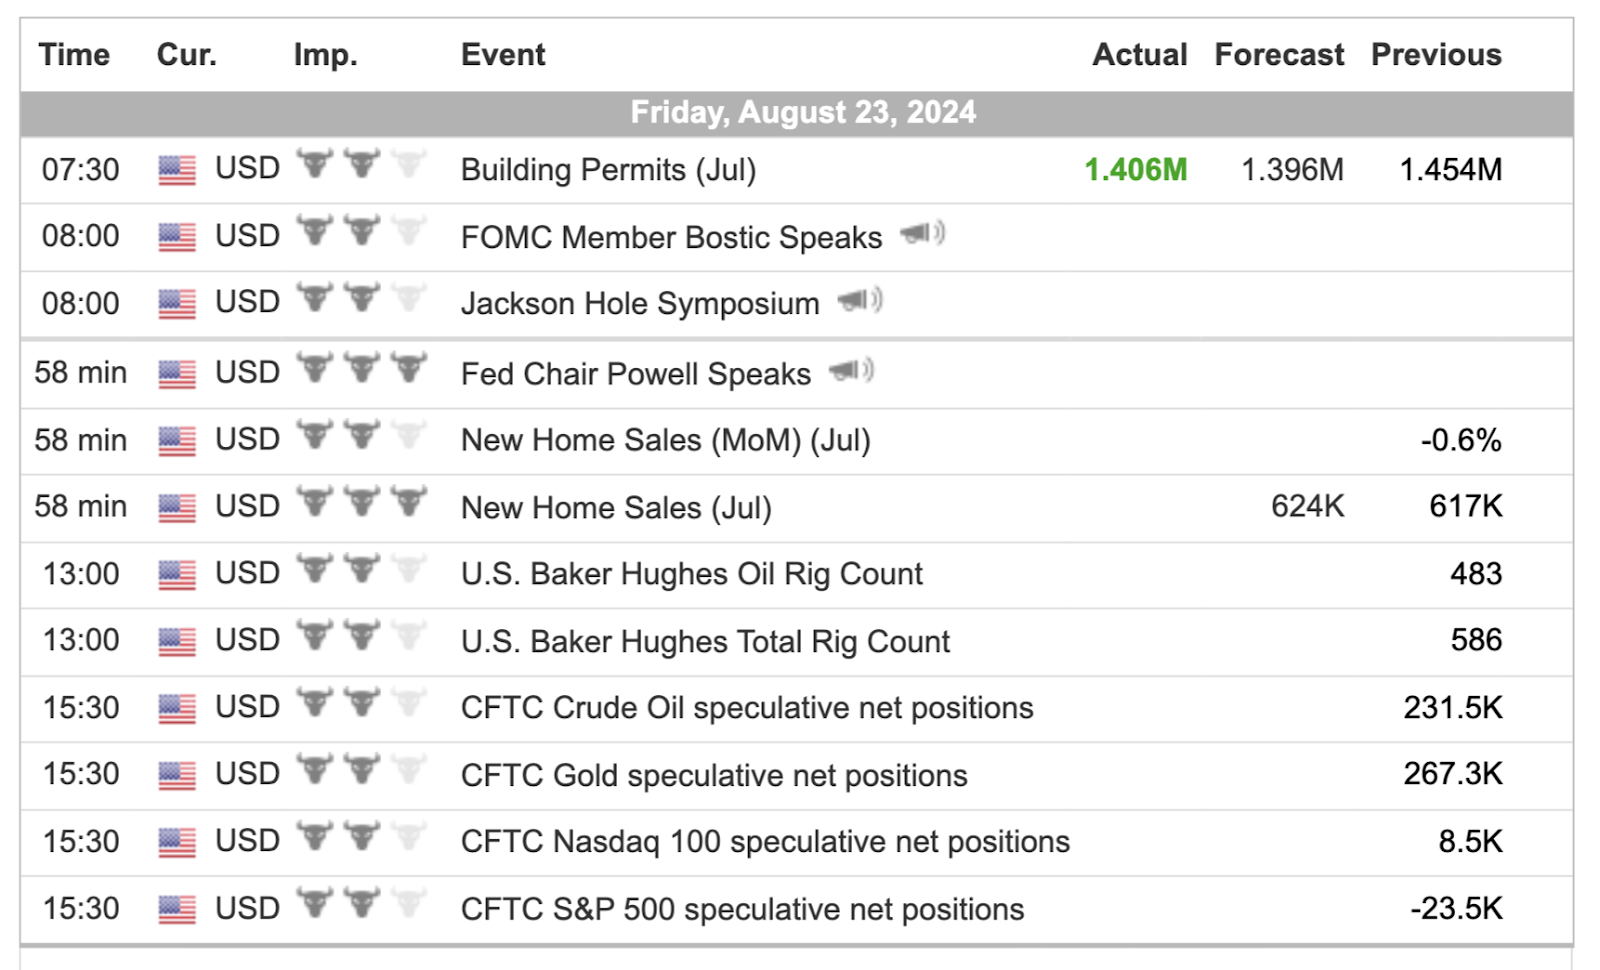
For a more complete Economic Calendar see: https://mrtopstep.com/economic-calendar/
Comments are closed