These Are Not Our Father’s Markets or Charts
NVDA reports tonight
Follow @MrTopStep on Twitter and please share if you find our work valuable!
Every week, MrTopStep invites traders to an “Own the Close” contest where the closest guesstimate where the SPX will settle on Friday’s 4:00 cash close.
The winners get a free week’s access to the MrTopStep Chat and trading tools. Enter your guess now!
Our View
The markets have really slowed and volumes have dropped in front of today’s NVDA earnings.
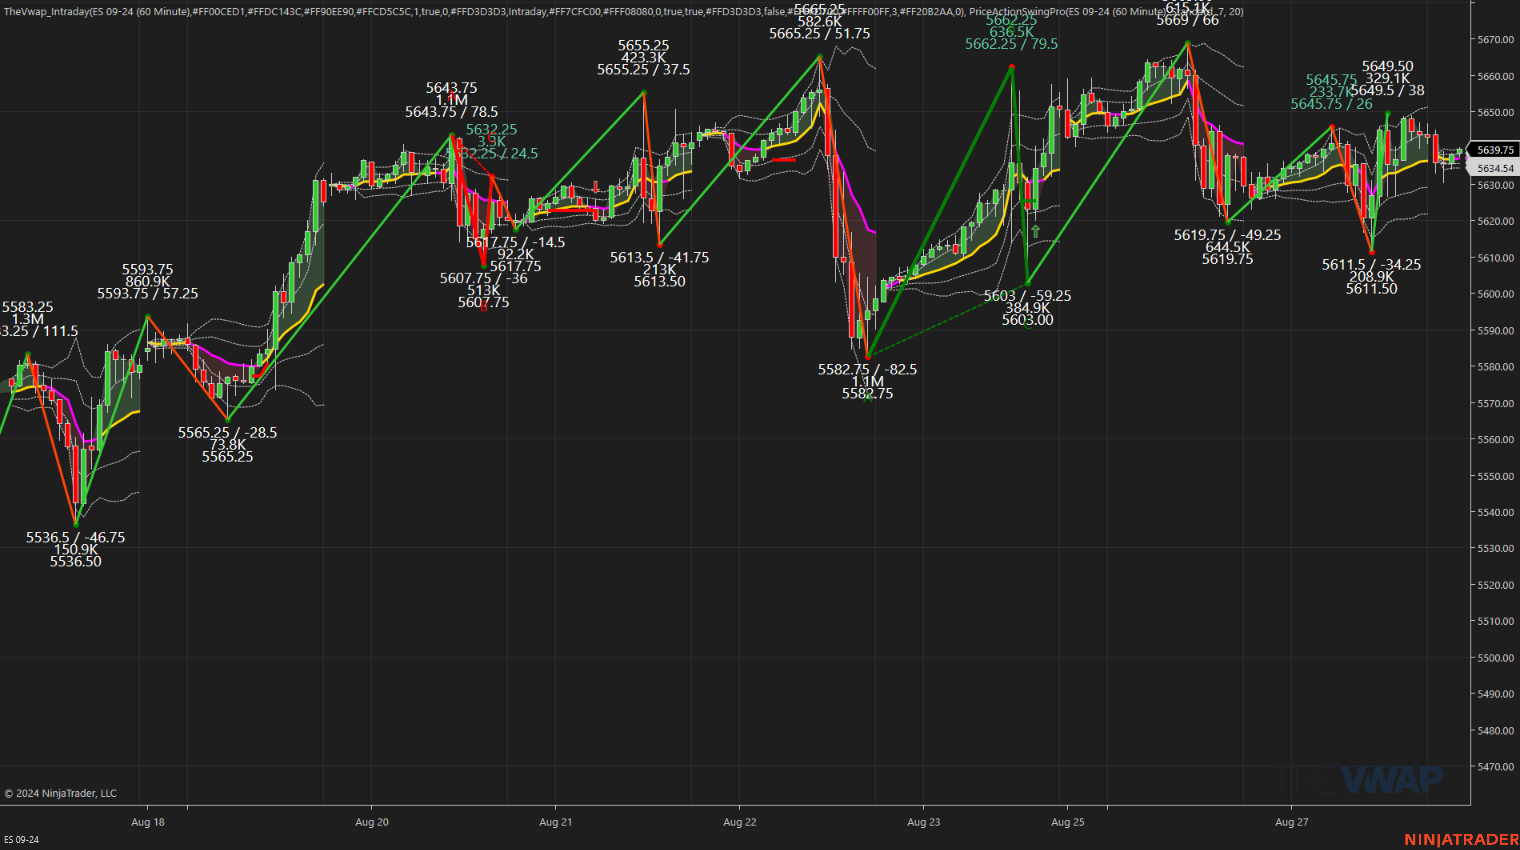
When I look at a wider view of the ES chart, I see several lows and no follow-through. The August 20 low at 5607.75, the August 21 low at 5613.50, the August 23 low at 5603.00, and yesterday’s low at 5611.50. Only one day — August 22 — did the ES break down through the 5,600 figure down to 5582.75. What I see is a big 60-point back-and-fill pattern.
Will Nvidia earnings beat expectations? Will the ES and NQ explode to the upside? Or will they sell the good news? What happens if NVDA does not meet expectations and tumbles taking the rest of the markets for the ride? Or will the stock fall and bounce?
The data analytics firm ORATS showed that options pricing anticipated a move of 9.8% in NVDA shares and that the report could prompt more than a $300 billion in swing in value, which is a larger-than-expected move over the last 3 years. It’s also well above the stock’s average post-earnings move of 8.1% over that same period and the largest expected earnings move of any company in history.
I don’t know how this can be a good thing, but if you add up the Dot-com companies, the market capitalization of all the tech companies was $47 billion in February of 2000. Going into today’s earnings, NVDA’s market cap is $3.16 trillion.
I know that I say I have been part of every market crash since 1980, but the Dot-com bubble was telegraphed. It started in 1995 and by late-1999, we knew something was going to happen. It started going up everyday, day after day, while several tech companies were IPOing or just did an IPO.
I am not saying we are going into a tech bubble, but I think everyone should be concerned about the concentration of a handful of companies making up ~30% of the capitalization of the markets. If something goes wrong, it could create a real volatile situation.
Our Lean
A cloud has been hanging over the S&P and Nasdaq for over the last 6 sessions and we don’t know if it’s black or blue. Everyday the same rotation shows up — out of the NQ and into the YM and S&P — and it has been very pronounced. Is part of this selling tied to NVDA? I am sure it is, but I have to side with the bulls on this one.
The ES has been back-and-filling and with so many traders thinking about negative earnings, I think we are going up. I will be online for the number and if a good buying opportunity arises, I am taking it. As always — if I am wrong, I will have a stop in. Good luck today.
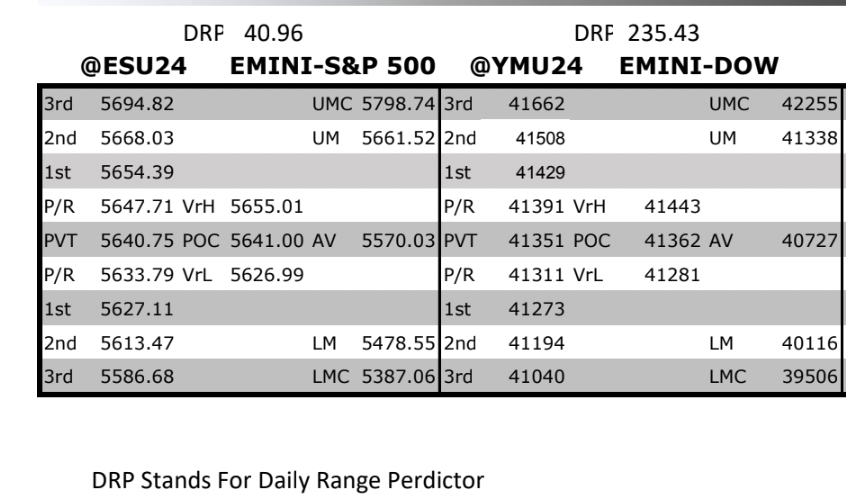
MrTopStep Levels:
MiM and Daily Recap
ES recap
The ES made a high of 5645.75 on Globex and opened Tuesday’s regular session at 5623.50. After the open, the ES traded at 5623.50, dropped to the low of the day at 5611.50 at 9:40, and then rallied 21.5 points to 5633.00 at 10:12. It then pulled back to 5624.25, before rallying to 5643.50 at 10:34. After a small pullback of 7.5 points, it rallied to 5649.50 at 11:09, then dropped 22.75 points to 5626.75. The ES then rallied to 5640.50 at 12:16 and sold off to 5627.00 at 12:44. Following this drop, the ES rallied to a lower high by one tick at 5649.25 at 2:04, then sold off to 5640.00 at 3:03, and rallied to 5645.25.
The ES traded 5645.75 as the 3:50 cash imbalance showed $1.7 billion to sell, and then traded at 5647.25 at the 4:00 cash close. It sold off to 5641.00 at 4:48, and ended at 5643.00, up 13.5 points or +0.24%. The NQ settled at 19,636.00, up 83.5 points or +0.43%.
In the end, after going up all night, the ES reversed, opened lower and basically went up most of the day. In terms of the ES’s overall tone, I think it acted well. In terms of the ES’s overall trade, volume was low at 974K contracts traded.
Technical Edge
-
NYSE Breadth: 42% Upside Volume
-
Nasdaq Breadth: 45% Upside Volume
-
Advance/Decline: 42% Advance
-
VIX: ~15.75
Guest Post Polaris Trading Group
Topic: Daily Trade Plan
Author: David D Dube’ (a.k.a. PTGDavid)
Website: https://polaristradinggroup.com/
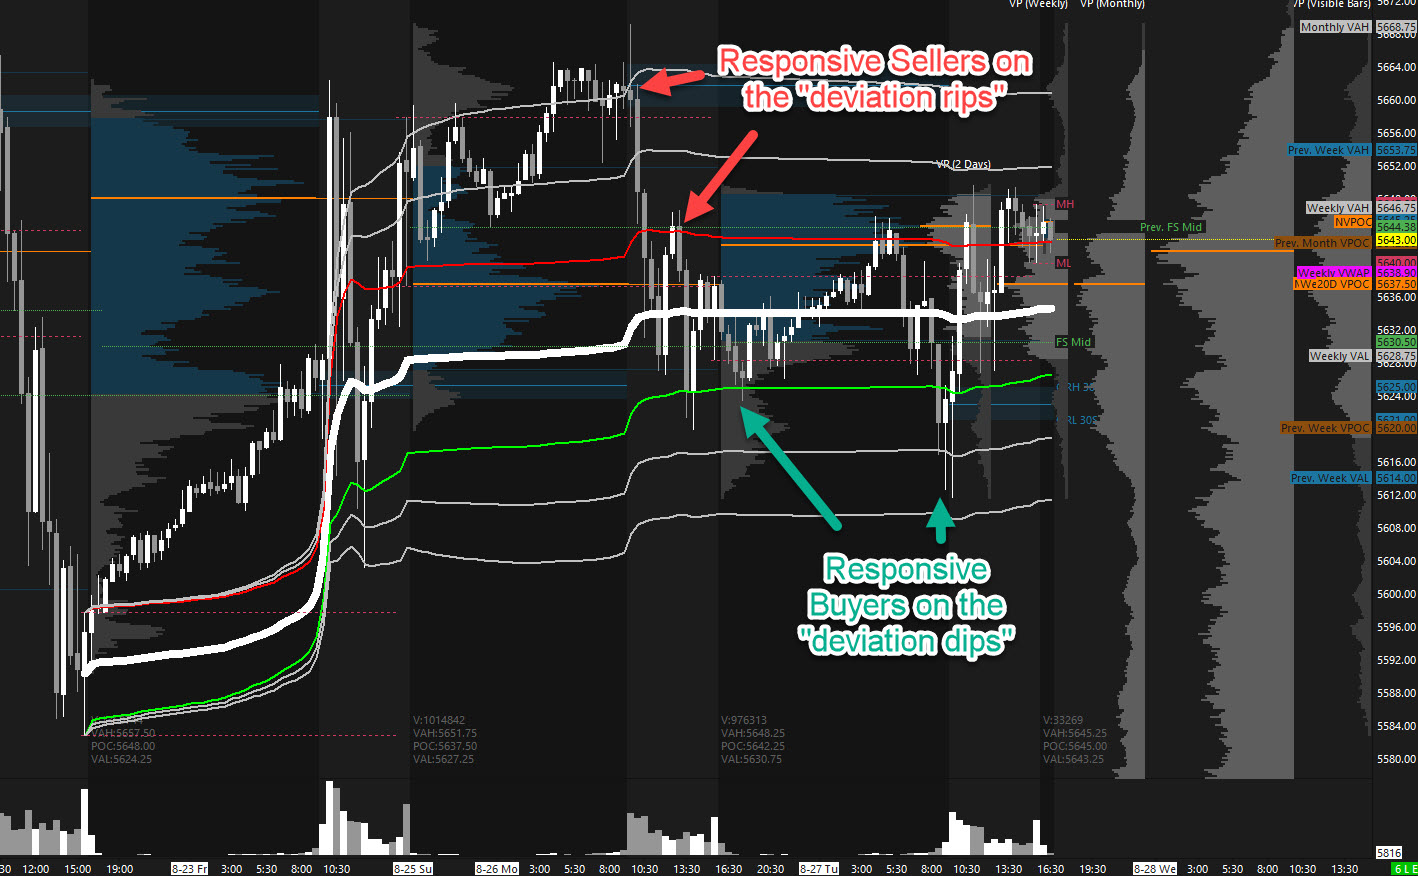
Prior Session was Cycle Day 2: Textbook (CD2) as price tested both the upside and downside zone edges outlined in the prior DTS Briefing 8.27.24. As price volatility continues to contract during this “end-of-summer” balancing phase, the key Fulcrum Level has been 5630 handle.
Member Libby71 pointed out that by utilizing the Anchored VWAP (video) from the August 22nd low price has defined the current balancing range beautifully.(see today’s chart screenshot). Range was 38 handles on 965k contracts exchanged.
…Transition from Cycle Day 2 to Cycle Day 3
This leads us into Cycle Day 3: Price is currently above the Cycle Day 1 Low (5619.75), so expectation is for satisfaction of the 3 Day Cycle statistic, which has a 90% historical tracking that P > CD1 Low on CD3. There continues to be high potential for price to break higher fulfilling cycle range objective (5675).
Our discipline of maintaining positioning that is aligned with market forces continues to serve us well, so stay the course.
As such, scenarios to consider for today’s trading.
Bull Scenario: Price sustains a bid above 5650, initially targets 5665 – 5675 zone.
Bear Scenario: Price sustains an offer below 5630, initially targets 5615 – 5605 zone.
PVA High Edge = 5648 PVA Low Edge = 5632 Prior POC = 5643
Thanks for reading…PTGDavid
Economic Calendar

For a more complete Economic Calendar see: https://mrtopstep.com/economic-calendar/
Comments are closed