Fed, Triple Witching in Focus This Week
The trend has been to buy the dips.
Follow @MrTopStep on Twitter and please share if you find our work valuable!
Every week, MrTopStep invites traders to an “Own the Close” contest where the closest guesstimate where the SPX will settle on Friday’s 4:00 cash close.
The winners get a free week’s access to the MrTopStep Chat and trading tools. Enter your guess now!
Our View
To me, the 5-day 210-point rally in the ES and the 1,072-point rally in the NQ make perfect sense. The PPT does not want any big selloffs or corrections before Wednesday’s rate cut. It’s all part of the Fed’s playbook — but that’s not stopping the anxiety surrounding the first rate cut since 2020 and the 50% chance that the Fed will cut rates by 50 basis points.
Everything looks fine, right?
After a long period of stocks trending higher and bonds seeing a big rally, things got spooked when the job reports started to weaken following the data revision that occurred on August 21 when the BLS said only 2.1 million payroll jobs were created during the year — 800,000 fewer jobs than previously reported — which has brought monthly job growth down from an outstanding 242,000 jobs to a decent 174,000 monthly jobs created during that period.
The question for traders is: Was the recent data a sign of things getting back to normal or a recession?
One thing is for sure, it’s not just going to keep going as-is forever, and who better to hear it from than JPMorgan Chase CEO Jamie Dimon, who laid out the “worst outcome” for America’s economic future, beyond recession. “The worst outcome is stagflation, and by the way, I wouldn’t take it off the table.”
This is the first time in American history that interest payments on the national debt have risen above $1 trillion. “So, it’s hard to look at [it] and say, ‘Well, no, we’re out of the woods.’ I don’t think so.”
I am not sure where Jamie got his $1 billion a day in interest when it’s $3 billion a day, but that doesn’t really matter; what matters is we are broke. I asked ChatGPT if the debt was broken down, and everyone in the US would owe $109,000. The offset and safe haven — gold — closed above $2,600 on Friday, and it still looks higher. Rick Rieder, chief investment officer for fixed income at BlackRock, said, “The markets have been on edge for the last month or two. You’ve seen bonds move rapidly from a sanguine view to recession.”
I really don’t know how this is all going to end, but the long-term prognosis isn’t good. That said, we are not here to fight city hall. If the ES is going up or down, I want to go for the ride.
Our Lean
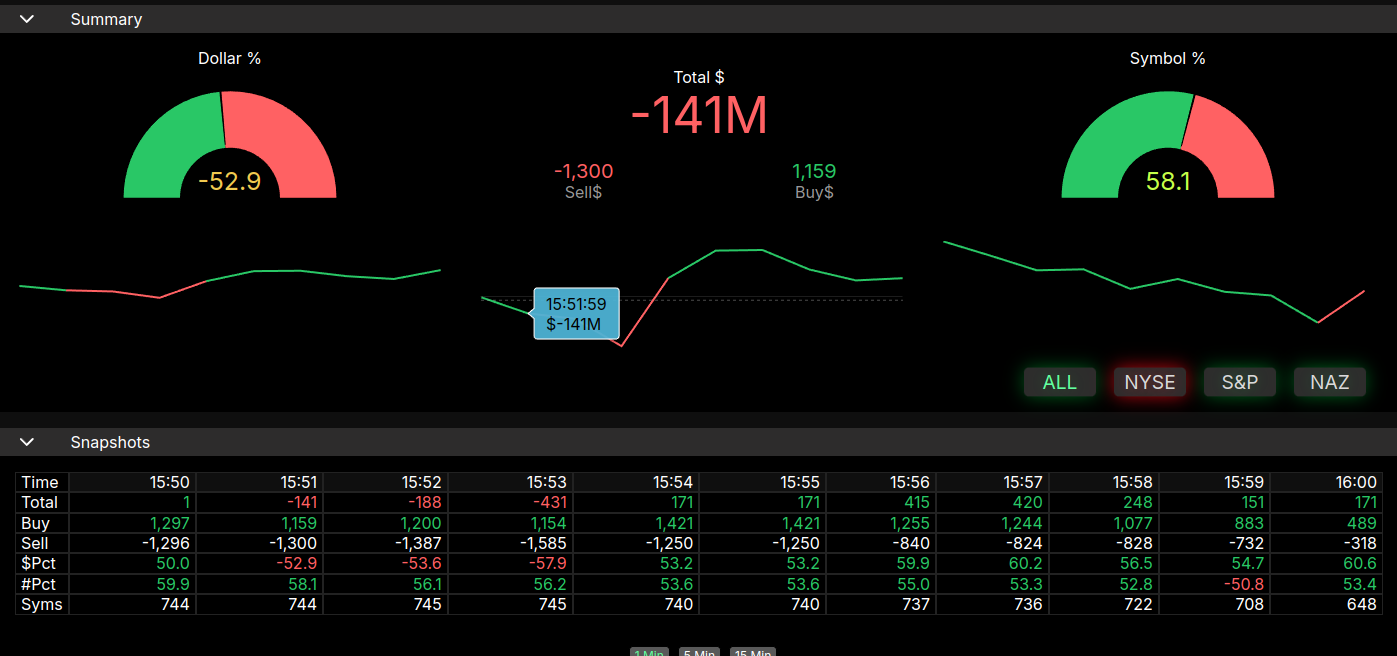
While all eyes will be on Jerome Powell’s press conference Wednesday and the path for further rate cuts, there are 13 economic reports mostly spread out from Tuesday to Thursday and are followed by the September Triple Witching on Friday. I think the main message over the last 5 days is that the buyers have shown up in force. I always say if you want to know where the S&P is going, follow the 3:50 imbalance meter.
It’s not perfect, but look how much the ES has gone up since the 3:50 imbalance meter started racking up over $23 billion to buy. A simple way to see what I am talking about is to mark your daily chart with the exact 3:50 buy or sell total. Don’t think that’s going to work like the latest example so quickly, but it will produce a roadmap that is pretty distinctive.
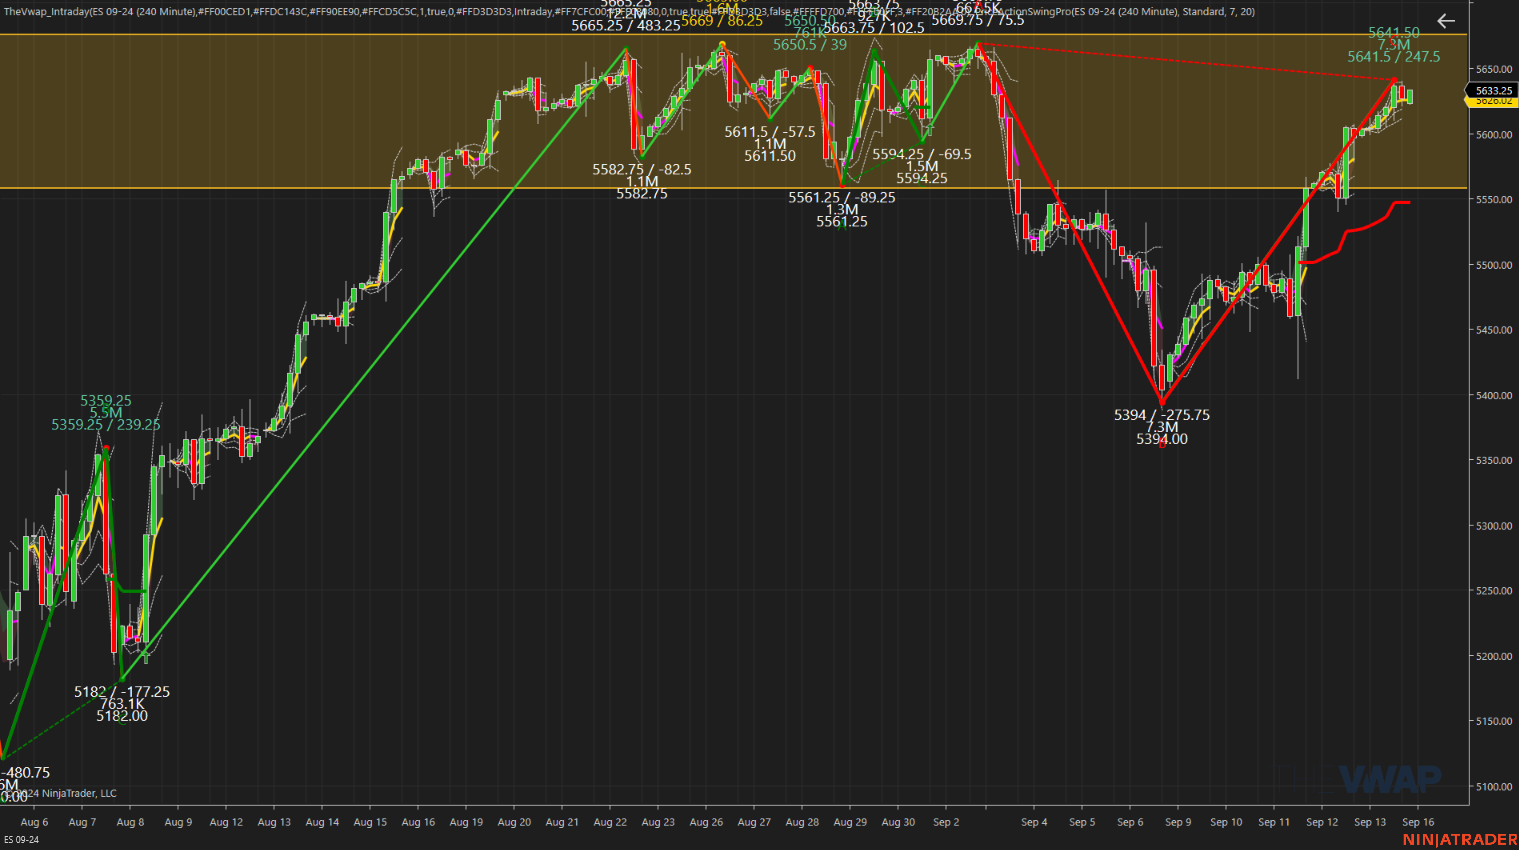
Our Lean: Do you know where we are? I am going to post the ES chart of all the highs at the 5670 area (below). I have said this before, there was a very well known trader from the original Market Wizards book by the name of Ed Seykota who said you are supposed to trade up to the event, but not the event. We all know that’s not how this goes today, everyone thinks they are going to miss the next big move.
With the futures roll going on and the Fed’s Wednesday-afternoon policy announcement, outright trading volume should fall unless we see a big drop. I still think buying the pullbacks is following the trend, especially if ES volume is low, but I also can’t rule out selling a rip. The question is simple: do the buyers step back and we start to see some early selling pre-Powell?
Lastly, on September 11 the ESU made an 11:50 am low at 5412.00 low that set off a 229.50 point, 2.5 day rally up to 5641.50 on Friday. The NQ made a September 8 low at 18,339.75 and its 2.5 rally up to on Friday afternoon netted 1,210 points.
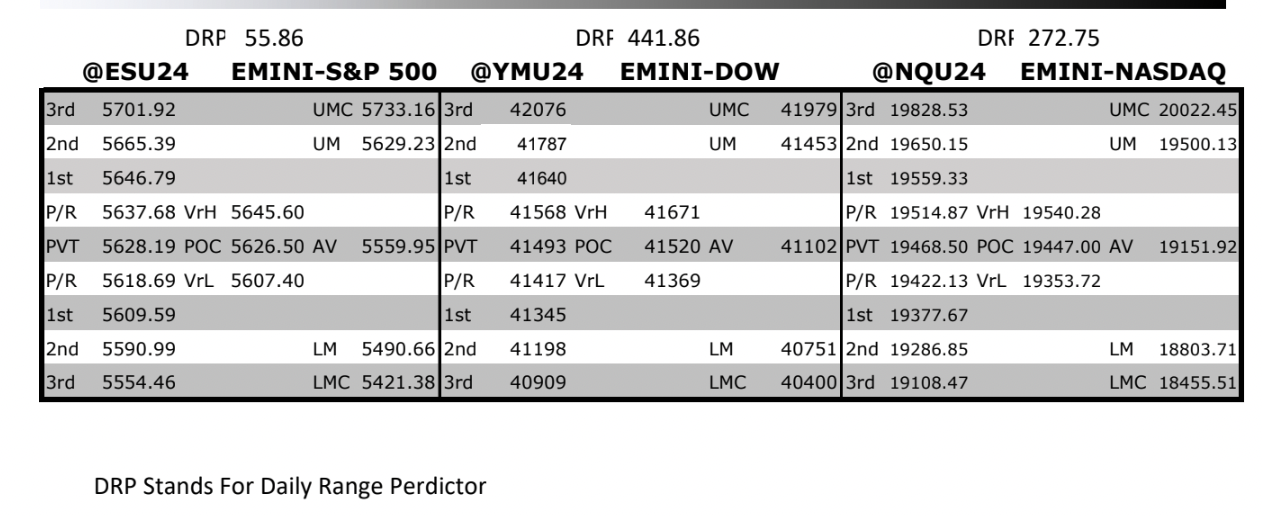
MrTopStep Levels:
MiM and Daily Recap
The ES made a low at 5601.75 and a high at 5617.75 on Globex and opened Friday’s regular session at 5612.25. After the open, the ES dropped 8.75 points to 5605.00, then rallied 29.75 points to a new high of 5634.75 at 10:27. It sold off 21.75 points (algobomb) to 5613.25 at 10:33, then rallied to 5636.50 at 10:45. It traded back down to 5624.50 and then rallied to 5640.50 at 12:03, before selling off 16.25 points to 5624.25. After the pullback, the ES rallied 17.25 points to a new high of 5641.50, then dropped 20.5 points to 5621.00 at 3:03, and rallied back to 5630.75 at 3:27. It sold off to 5623.25 at 3:42 and then rallied to 5631.75 at 3:47.
It traded at 5629 as the 3:50 cash imbalance showed $141 million to sell and then traded at 5630 on the 4:00 cash close. After 4:00, the ES drifted lower and settled at 5626.75, up 24.5 points or +0.44%. The NQ settled at 19,503.50, up 56.25 points or +0.29%. The 10-Year Note settled at 115.125, up 0.065 points or +0.18%. Crude oil (CLZ24) settled at 69.25, up 0.27 or +0.39%. Gold settled at 2,606.20, up 25.60 points or +0.99%. Bitcoin (BTCV4) settled at 60,605.00, up 1,590 points or +2.69%.
In the end, the powers that be are not letting up on the upside. In terms of the ES’s overall tone, it’s up 5 days in a row. In terms of the ES’s overall trade, 1.672 mil ESU traded and 879,977 ESZ traded making 792,032 in the outrights. When you deduct the algorithmic and HFT volume, that leaves a very low amount of volume and could be part of what we have seen so many algo bombs last week.
Technical Edge
-
NYSE Breadth: 85% Upside Volume (!)
-
Nasdaq Breadth: 70% Upside Volume
-
Advance/Decline: 84% Advance (!)
-
VIX: ~17
Economic Calendar

For a more complete Economic Calendar see: https://mrtopstep.com/economic-calendar/
Comments are closed