It’s Showtime for the FED
Here’s how I’m trading the day
Follow @MrTopStep on Twitter and please share if you find our work valuable!
Every week, MrTopStep invites traders to an “Own the Close” contest where the closest guesstimate where the SPX will settle on Friday’s 4:00 cash close.
The winners get a free week’s access to the MrTopStep Chat and trading tools. Enter your guess now!
Our View
As we go into today’s rate cut, it would be hard to say anything but bullish. It doesn’t really matter if it’s good or bad economic reports, the markets have and want to continue higher.
However, there is one thing in the way of it and it’s not the Fed — it’s the second half of September, the Triple Witching and the ‘end of the quarter’ rebalance.
Like I said yesterday, there is always an event. So, let’s talk about the rate cut. I think there is a good chance it’s a “sell the news” event, but I don’t think it will be the end of the rally. What the ES needs to do now is have a drop, back-and-fill for a bit and then start marching higher again.
I can’t disagree with a lot of what the bears have to say and I agree that something bad can happen to the stock market, but one of the things the bears have left out of the equation is that little three-letter word: FED!
It would be a big feather in the administration’s cap if going into the election the White House could say that inflation is over after 3 rate cuts.
Our Lean
I’m expecting a two-way trade for the first part of the day and a range expansion after the Fed headlines and Powell’s press conference at 2 pm ET and 2:30 pm ET, respectively. It’s showtime for the Fed and a 100 point ES range would not be out of the realm of possibilities.
Yesterday both the ES and NQ sold off after they gapped higher, but the bounce made a new high then reversed up to a new high and that’s when the risk-off selling started showing up. I’m going to take it easy this morning, sell some rips and buy some dips, and then shut down before the FED… today is going to be a take out the highs/take out the lows kinda day.

The PitBull’s handiwork
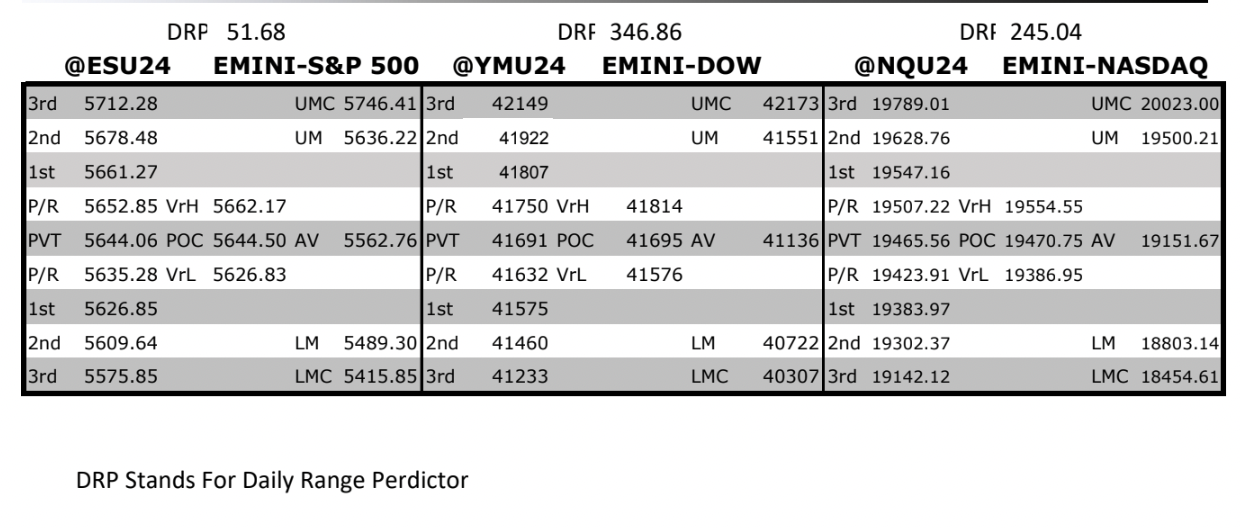
MrTopStep Levels:
Here’s a post from my friend Jeff Hirsch at Stock Trader’s Almanac:

S&P 500 stats
Since the S&P index futures began trading on April 21, 1982, stock options, index options as well as index futures all expire at the same time four times each year in March, June, September, and December. September’s quarterly option expiration week has been up 54.8% of the time for S&P 500 since 1982. DJIA and NASDAQ have slightly weaker track records with gains 52.4% of the time and 52.4% respectively.
However, the week has suffered several sizable losses. The worst loss followed the September 11 terrorist attacks in 2001. In the last twenty-one years, S&P 500 and NASDAQ are tied for best record during September’s quarterly option expiration week, up thirteen times, but NASDAQ has been down the last six straight. Friday had been firm with all three indices advancing every year 2004 to 2011, but S&P 500 has been down 11 of the last 12 and NASDAQ has been down 10 of the last 12 since.
S&P 500 Down 27 of 34 Week After September Quarterly Options Expiration, Average Loss 1.06%
The week after September options expiration week, has a dreadful history of declines most notably since 1990. The week after September quarterly options expiration week has been a nearly constant source of pain with only a few meaningful exceptions over the past 34 years. Substantial and across the board gains have occurred just four times: 1998, 2001, 2010 and 2016 while many more weeks were hit with sizable losses. In 2022 DJIA and S&P 500 declined over 4% while NASDAQ fell 5.07%.
Full stats are the sea-of-red in the tables here. Average losses since 1990 are even worse; DJIA –1.09%, S&P 500 –1.06%, NASDAQ –1.06%. End-of-Q3 portfolio restructuring is the most likely explanation for this trend as managers trim summer holdings and position for the fourth quarter.

Nasdaq stats
MiM and Daily Recap
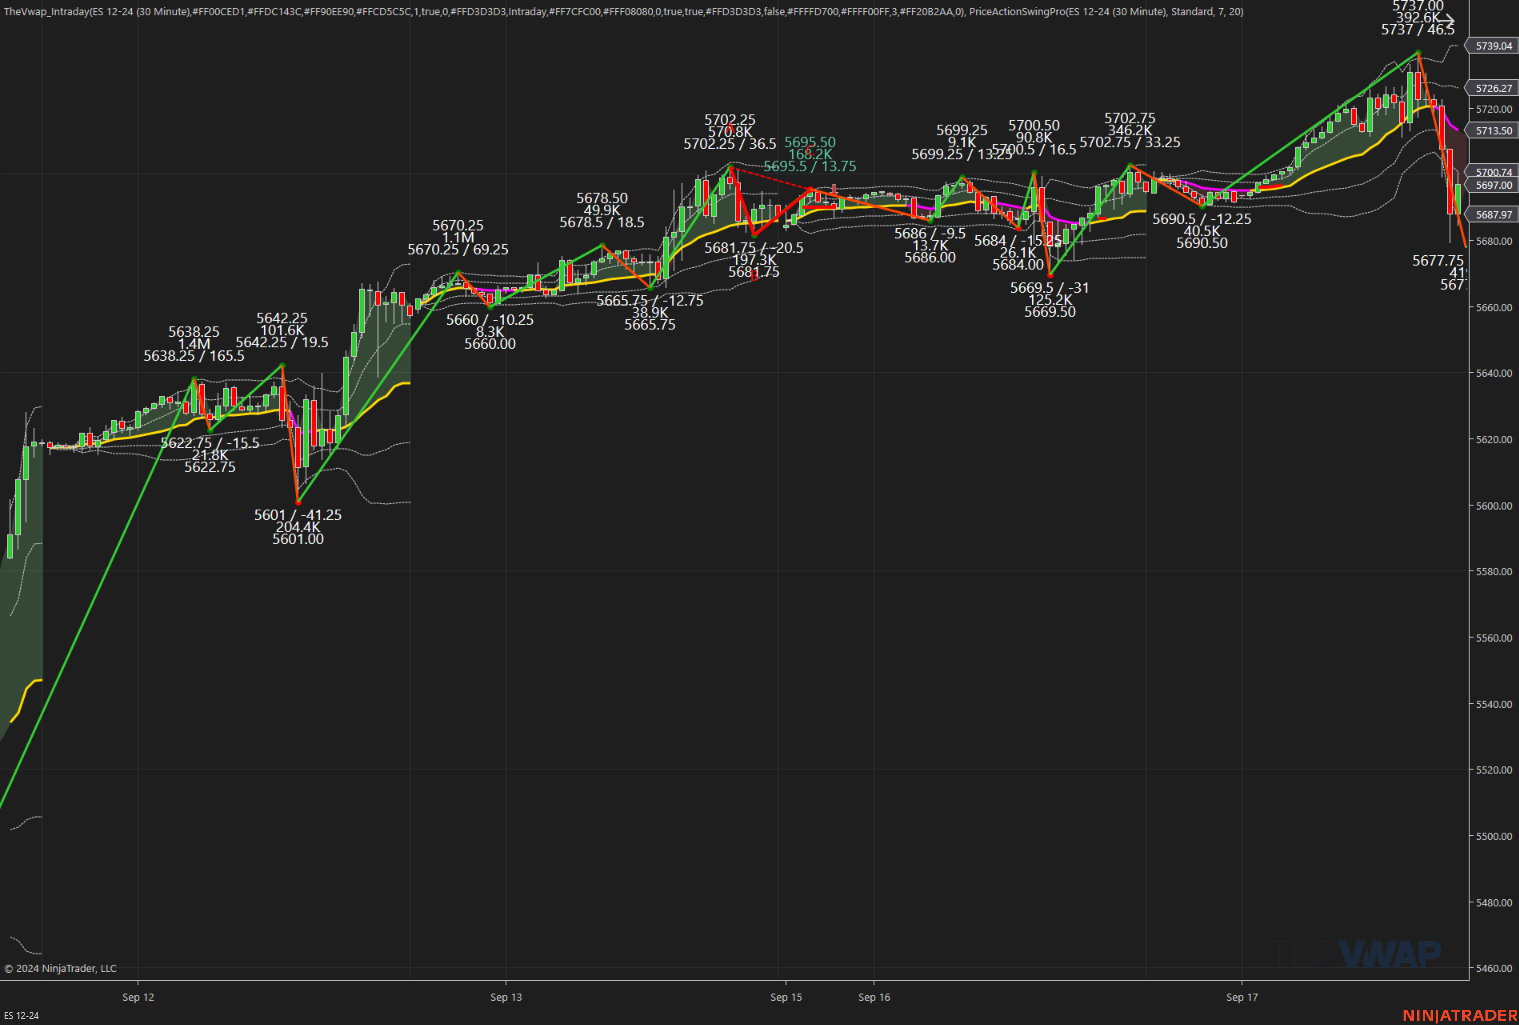
ES recap
The ESZ (December contract) traded up to 5726.75 just after the retail sales report beat expectations at 8:31, sold off 8.75 points down to 5718.00 at 8:36, rallied 8.5 points up to 5726.50 at 9:11, and opened Tuesday’s regular session at 5722. After the open, the ES traded 5718.25, rallied 8.75 points up to 5727.00 at 9:34, dropped 10.5 points down to 5716.50, and then rallied to a new high at 5733.50. It pulled back to 5721.00 and then rallied 16 points up to 5737.00 at 10:49. After the high, the ES sold off 57.75 points down to 5679.25 at 12:52 and then rallied 21.5 points up to 5700.00 at 1:28.
It dropped 23 points down to a new low at 5677.75 at 1:48 and then rallied up to 5702.00, 24.25 points off the low, before selling back down to 5683.25 at 2:52. It then rallied up to 5695.00 and traded 5694.75 as the 3:50 cash imbalance showed $1.8 billion to buy, trading up to 5702 on the 4:00 cash close. After 4:00, the ES rallied up to 5706.00 and settled at 5701.25, up 2 points or +0.04%. The NQ settled at 19,686.25, up 21 points or +0.11%, as benchmark Treasury yields ticked up to 3.641%, after settling Monday at 3.622%, the lowest level since June 2023.
In the end, the ES had a nice, early push up but the risk-off selling tied to today’s rate cut weighed in. In terms of the ES’s overall tone, it was a buy program early on and then the sell programs took over. In terms of the ES’s overall trade, volume was steady but at least 60% of the volume came from the ESU/ESZ spreads, with 1.73 million contracts trading overall.
Technical Edge
-
NYSE Breadth: 61% Upside Volume
-
Nasdaq Breadth: 63% Upside Volume
-
Advance/Decline: 61% Advance
-
VIX: ~17.75
Guest Post — Polaris Trading Group
Trade Plan for FOMC Day
Market Context:
-
Event: Federal Open Market Committee (FOMC) statement, followed by a press conference by the Federal Reserve Chair (JPOW).
-
Timing: The FOMC statement is released at 2:00 PM ET, and the press conference starts at 2:30 PM ET.
-
Pre-FOMC: Markets usually trade cautiously and in a narrow range leading up to the announcement.
-
Post-FOMC: The announcement and press conference introduce significant volatility. Markets tend to see sharp moves, whipsaws, and reversals as traders react to the statement and JPOW’s commentary.
-
Key FOMC Day Strategy Considerations:
-
Volatility Spike: Expect a significant increase in volatility post-announcement. Be prepared for sharp price swings, fake breakouts, and potential liquidity traps.
-
Patience: The best strategy is often to stay on the sidelines until after the initial volatility spike (post-2:30 PM) unless you’re highly experienced in trading fast-moving markets.
-
Price Action Guidance: Focus on key levels that are being tested and respected before and after the announcement.
Key Levels for FOMC Day:
-
Pre-FOMC Range:
-
Often, a range forms during the pre-FOMC session. The high and low of this range become important levels for post-announcement trades.
-
Pre-FOMC Resistance: The upper boundary of the range, potentially near 5735 (or wherever resistance forms).
-
Pre-FOMC Support: The lower boundary, possibly around 5696 or another key pivot.
-
-
FOMC-Driven Targets:
-
Upside Targets:
-
5735 (PVA High Edge) and 5750 (cycle extension if buyers dominate).
-
Above 5750, 5770–5780 is a potential zone if there’s a significant breakout.
-
-
Downside Targets:
-
5696 (PVA Low Edge) and 5670 (support zone).
-
Below 5670, 5650–5635 could be a stretch target on heavy selling.
-
-
Pre-FOMC Strategy (Before 2:00 PM):
-
Neutral Bias:
-
The market tends to trade cautiously before the FOMC, and liquidity can dry up.
-
Avoid large directional bets and trade within the pre-FOMC range.
-
-
Scalping Inside the Range:
-
Trade the pre-FOMC range with tight stops and small position sizing.
-
Look for price to respect resistance near 5735 and support near 5696 for potential mean-reversion trades.
-
-
Reduce Size: If you’re trading pre-FOMC, reduce your position size due to the potential for sudden movements.
Post-FOMC Strategy (After 2:00 PM):
Primary Strategy: Trade the Reaction, Not the Event
-
Avoid Initial Spike (2:00 – 2:30 PM):
-
The first few minutes after the announcement can be extremely volatile with wide price swings, false breakouts, and reversals. It’s often best to stay out and observe.
-
-
Identify Clear Direction (After 2:30 PM):
-
Once JPOW’s press conference begins, the market typically chooses a more sustained direction based on the Fed’s tone, economic outlook, or any surprises in the rate decision.
-
Bullish Scenario:
-
If price breaks above the pre-FOMC range and holds above key levels (e.g., 5735), look for long opportunities targeting the next resistance levels (5750, 5770).
-
Entry: After a clear break and retest of 5735 or other key pivot levels.
-
-
Bearish Scenario:
-
If price breaks below the pre-FOMC range and holds under 5696, short opportunities targeting 5670, then potentially 5650.
-
Entry: On a confirmed break and hold below 5696 or a key lower pivot after volatility subsides.
-
-
-
Watch for Reversals:
-
Often, the market may spike in one direction after the FOMC release and then reverse as traders digest the full implications. Be ready for potential V-shaped reversals after the initial move.
-
Plan: If the market shows a strong fake-out (e.g., breaks higher but immediately retraces back into the range), look for opportunities to trade in the opposite direction with tight stops.
-
-
Time-Based Consideration:
-
The most reliable moves often happen after the press conference, from 2:45 PM – 3:30 PM ET. This is when the market digests all the information and typically trends more smoothly.
-
Final Hour of Trading: The last hour of trading (3:00 PM – 4:00 PM) can see sharp continuation moves or violent reversals, depending on the market’s interpretation of the FOMC outcome.
-
Risk Management:
-
Position Sizing: Given the increased volatility, reduce position sizes to manage risk.
-
Stop Losses: Use wider stops than usual due to expected price spikes but avoid over-leveraging. Adjust your stop loss as the market picks a direction.
-
Risk-Reward: Look for setups with at least a 2:1 risk-to-reward ratio, given the potential for large moves.
-
Volatility Management: If the market becomes too erratic, it may be better to stand aside rather than chase the action.
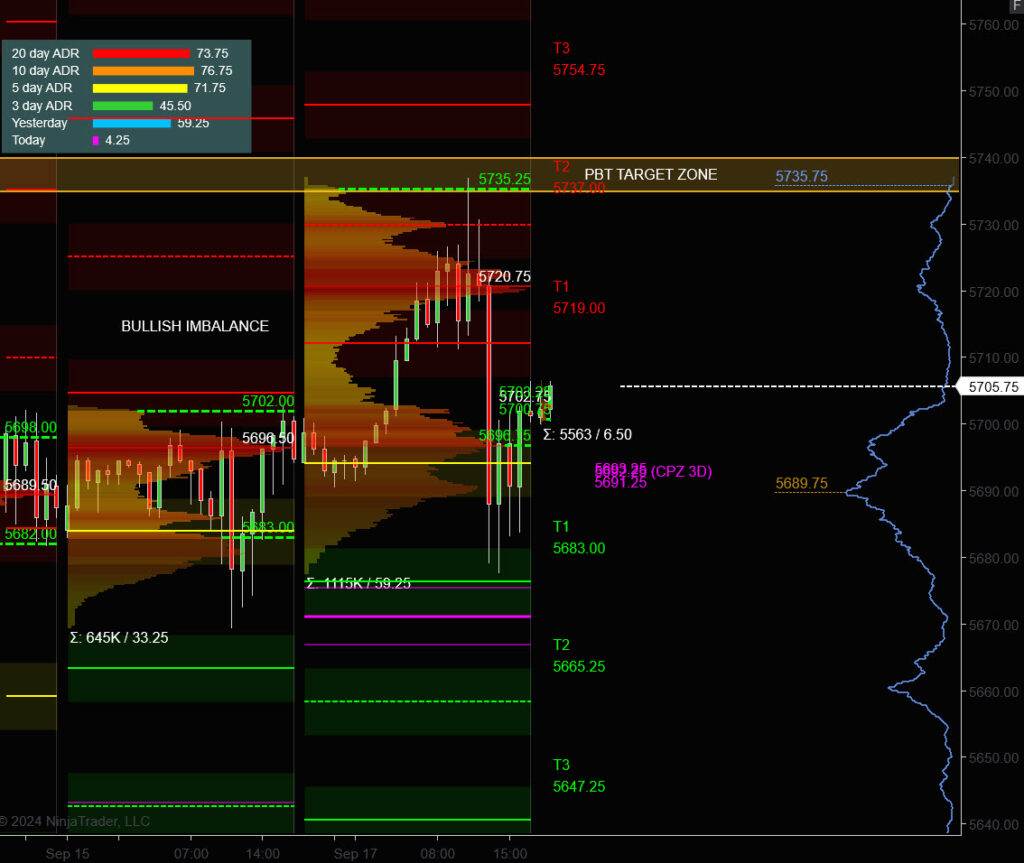
PVA High Edge = 5735 PVA Low Edge = 5696 Prior POC = 5720
ES Chart
Thanks for reading,
PTGDavid
Economic Calendar
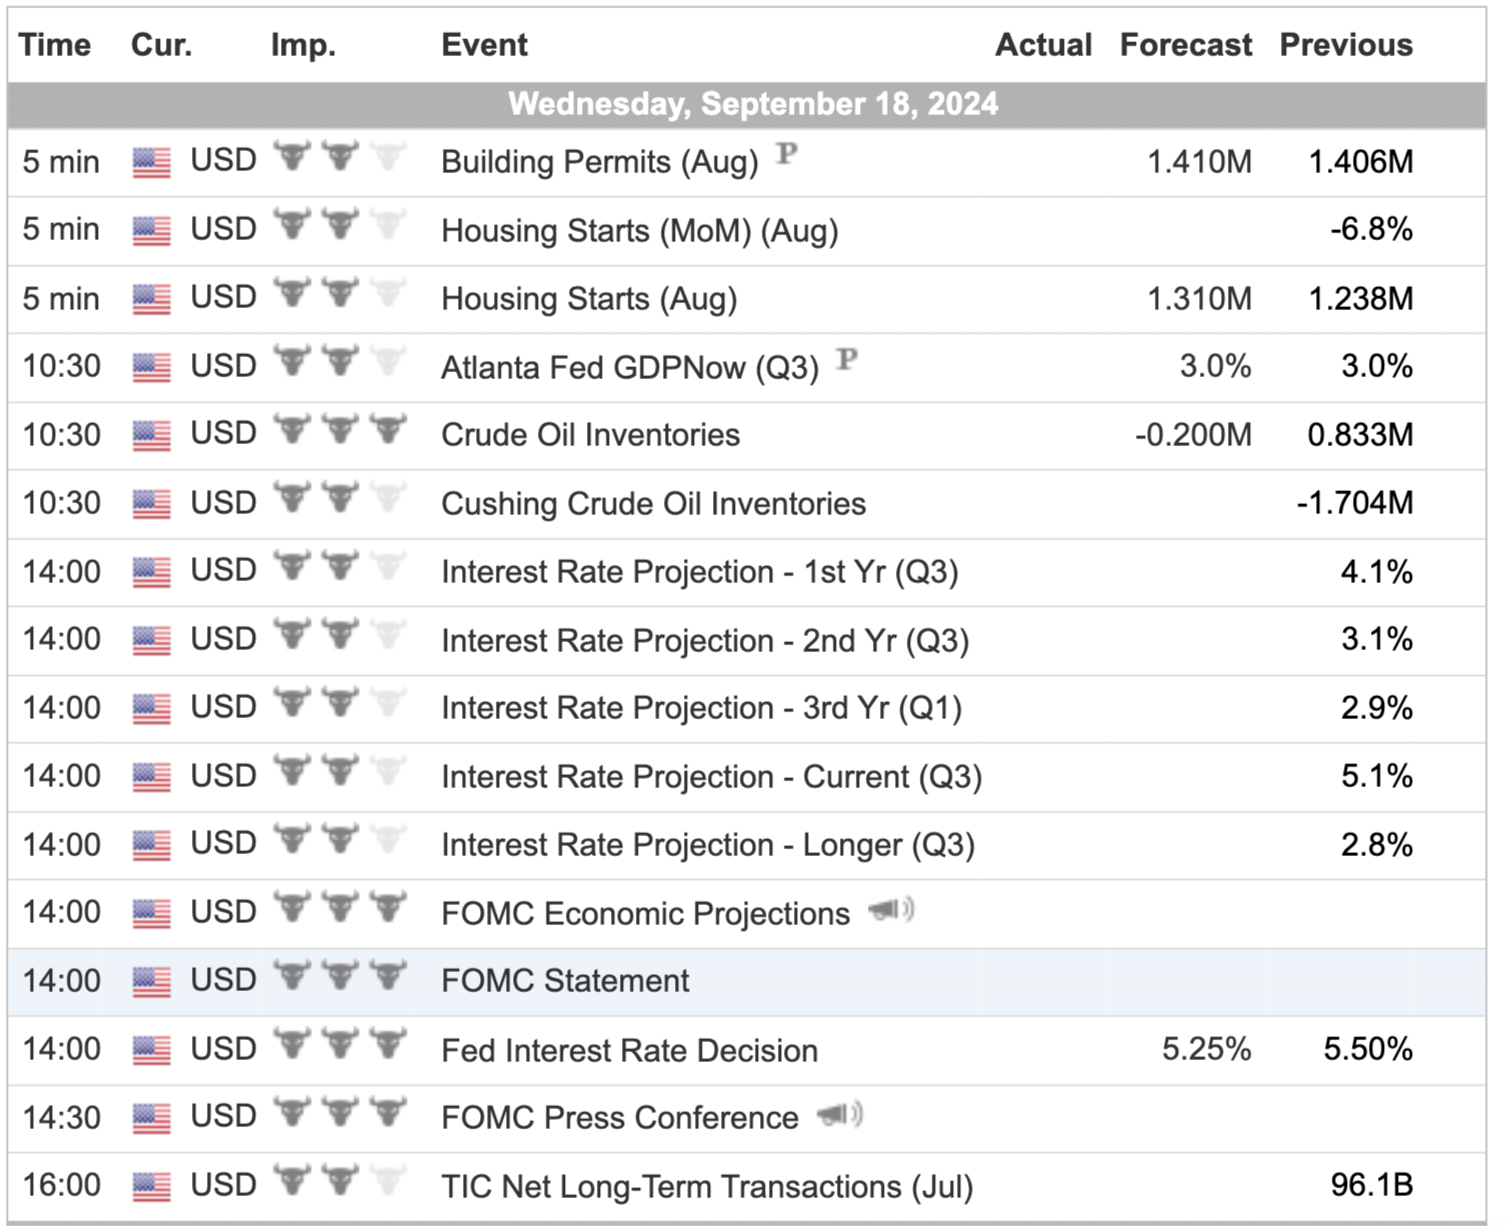
For a more complete Economic Calendar see: https://mrtopstep.com/economic-calendar/
Comments are closed