Bulls Take Control After Fed Goes Big
Stocks surge in Globex
Follow @MrTopStep on Twitter and please share if you find our work valuable!
Every week, MrTopStep invites traders to an “Own the Close” contest where the closest guesstimate where the SPX will settle on Friday’s 4:00 cash close.
The winners get a free week’s access to the MrTopStep Chat and trading tools. Enter your guess now!
Our View
I posted that there was a lot of stress in the air on Twitter, and it was a unanimous yes. It’s one thing waiting for a jobs number or a CPI number, but waiting on the first rate cut in four years is a much bigger deal. It’s 1:52, and the ES just rallied up to a new high and is falling back, and yes, there is stress in the air. I was wrong about the 0.50 bps cut. I did a tweet before the Fed headlines that everyone knows the Fed was behind the eight ball, and despite me not thinking the Fed would do it, they did. Am I surprised? Not really. Why? Because it’s an election year, and the Fed wants to lower rates two more times; at least they had the guts to do it. I didn’t get my hundred-point move, but I got 80.5 of it. I caught the rip higher and then got short. The only thing I can say is… they sold the news!
Our Lean
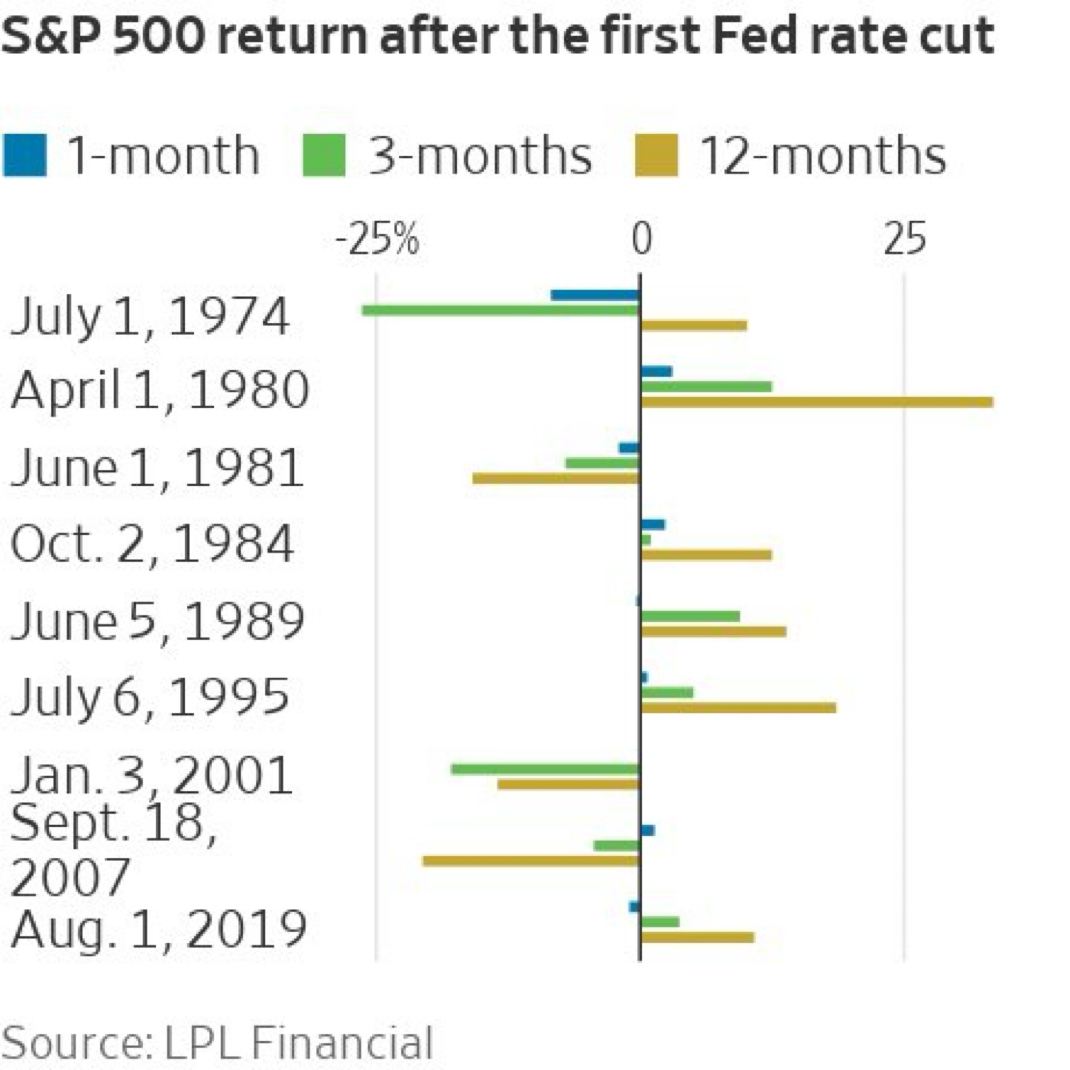
Historically the stock market rallies after rate cuts. The Federal Reserve’s rate cut is likely to be an overall positive for the stock market, at least over time. Based on the last nine major easing campaigns since the 1970s, the S&P 500 has generated 12-month average returns of 5.5% following the first cut, according to LPLFinancial (below). While Friday’s triple-witching stats and end-of-quarter rebalancing have not typically been kind to bulls, investors are cheering the Fed’s outsized rate cut.
Our Lean: The bulls are in control and we’re set for a strong open. After an indecisive finish to Wednesday’s session, today’s big overnight rally has likely trapped a lot of shorts. If the opening gap-up fades, I’d like to try buying the dips. On the upside, my levels were 5715, 5727, 5739, 5749, 5768, 5775 — but we’re already at the top of that range before the open. If the ES is weak going into 11:00 look for a bounce.
MiM and Daily Recap
ES Recap
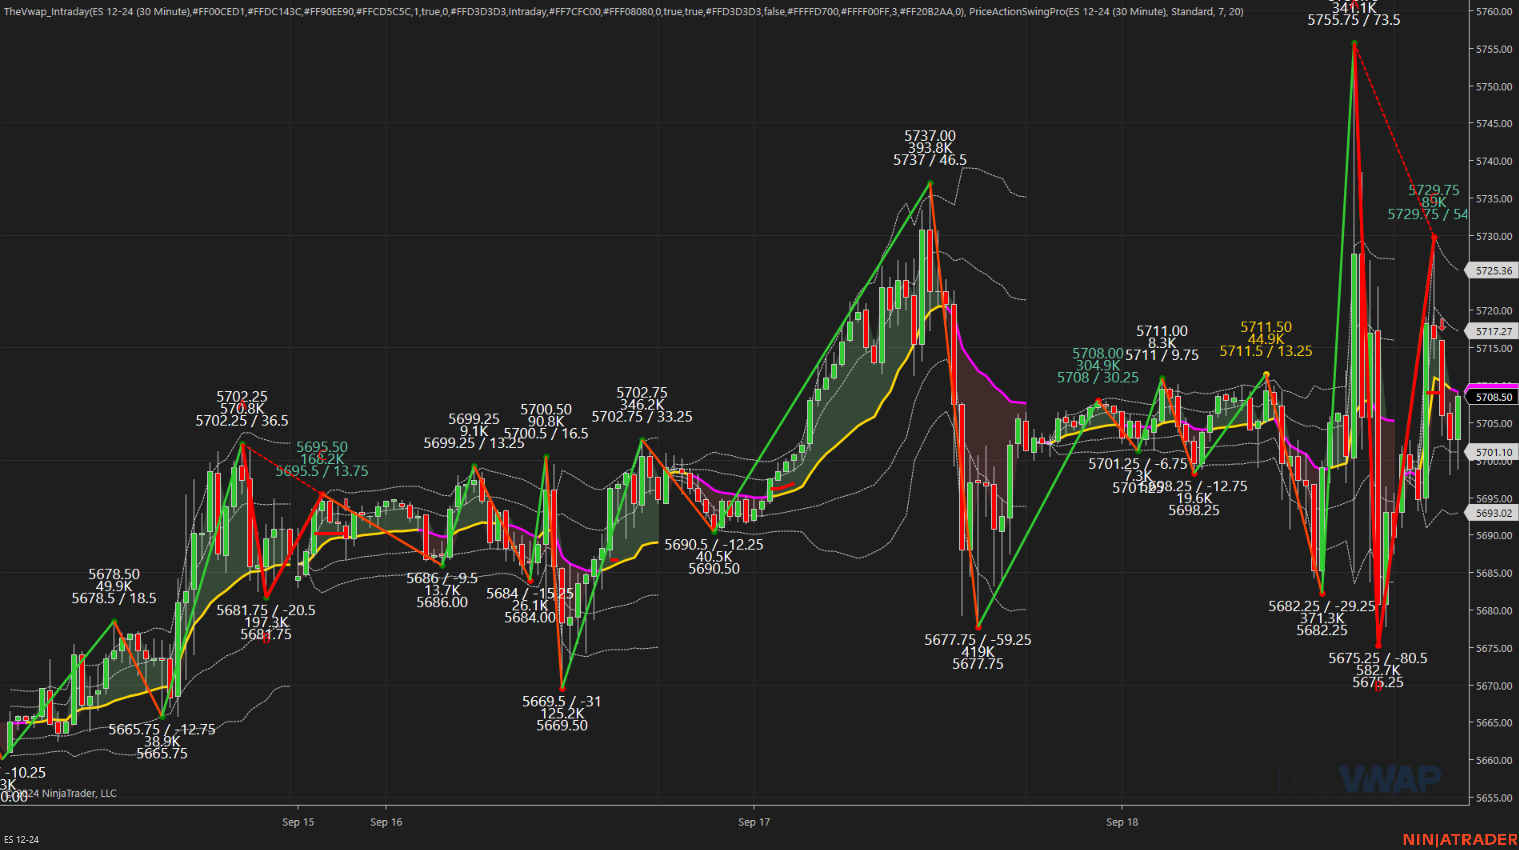
The ES rallied up to 5711.50 on Globex and opened Wednesday’s regular session at 57. After the open, the ES traded up to 5709.25 and then sold off down to 5694.75 at 9:52. It rallied 8.25 points to 5704.50, sold off 9.75 points down to 5694.75, rallied up to 5702.25, sold off down to 5690.75, and then rallied 12 points up to 5702.75 before selling off 15.5 points down to 5682.25 at 12:06. After the low, the ES rallied 23.75 points to 5706.00 at 12:58, pulled back to 5698.75 at 1:27, and then rallied as the Fed headlines started hitting the tape, reaching 5712.00 at 1:30 with news that the Fed cut 50 bps.
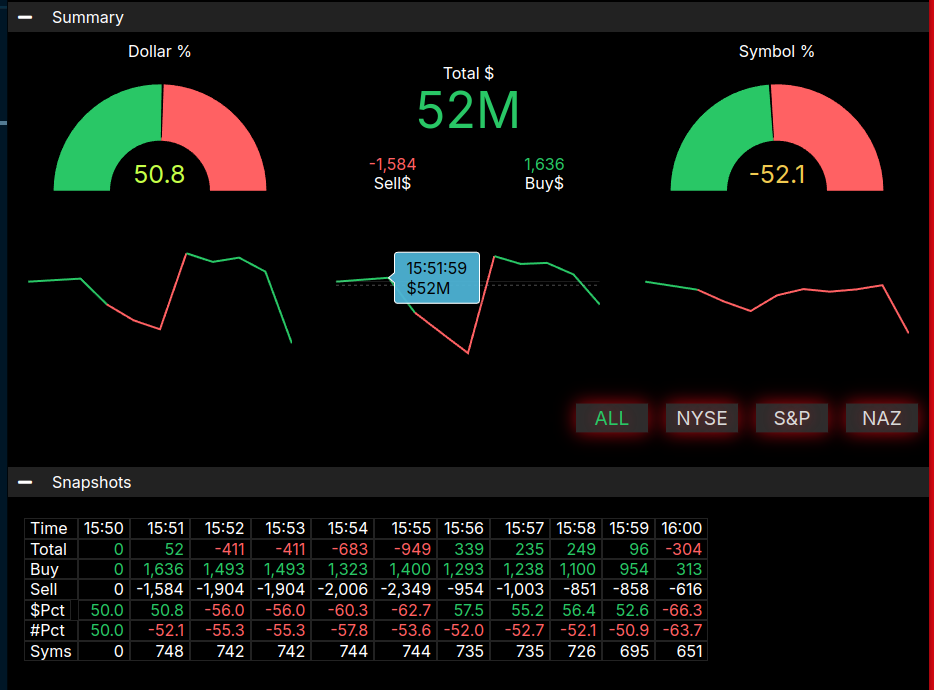
After the high, the ES sold off 27 points down to 5685.00 and then rallied all the way up to 5755.75 at 2:03, a 55-point rip. After the Fed high, the ES sold off 56.25 points down to 5683.75 at 3:06, rallied 43 points up to a lower high at 5726.75, and then sold off 46.50 points down to 5680.25 at 3:45. It traded at 5697.25 as the 3:50 imbalance showed $50 million to buy, sold off to 5675.25 at 3:51, and then traded at 5678.25 on the 4:00 cash close. After 4:00, the ES traded up to 5696.50 and settled at 5689.75, down 20.25 points or 0.36%, while the NQ settled at 19,632.75 on the 5:00 futures close.
In the end, we expected a volatile session and we got one, with plenty of two-way flow. In terms of the ES’s overall tone, it acted strong at first, then closed near flat as indecision set in after Powell’s remarks. In terms of the ES’s overall trade, volume was low during the first four hours and doubled after the headlines hit, with 1.72 million contracts trading overall.
Technical Edge
-
NYSE Breadth: 45% Upside Volume
-
Nasdaq Breadth: 50% Upside Volume
-
Advance/Decline: 48% Advance
-
VIX: ~16.50
Guest Post — Dan at GTC Traders
It’s a Bubble: Part Four – Qualitative Euphoria
For the last three weeks in this series, we have been unpacking a statement from a few months ago …
“For both predetermined quantitative and qualitative reasons, we believe that we are in the late stages of a longer-term stock market rally; and are in the beginning stages of a stock market bubble. When this happens, our portfolio mandate switches us to play what Poker players would call a very ‘nit’ game. In other words, all of our programs become very … tactically tight. Smaller position sizes.”
For the last three weeks, we have been specifying what we mean by that statement.
First, we covered valuations. Demonstrating that we are at the quantifiable extreme upper range of stock market valuations. Despite any of his public claims, we firmly believe this is the reason why Warren Buffett (as well as our own portfolio) is maintaining such elevated levels of cash.
Second, we covered the fact that indices, in terms of price (not value), are at an extreme upward standard deviation; which we have typically seen since 2019 and 2000.
Third, last week we explained that in the last few years, month-over-month upside deviations on returns have been increasing dramatically.
And then, most importantly, that all of the above quantifiable factors are occurring at the same time.
But for the last three weeks, we have been discussing Quantitative measurements on value, price and deviations. Let’s talk for a minute about Qualitative factors.
Quantitative vs. Qualitative
However, first it is important to note the difference between Quantitative data, and Qualitative factors. Quantitative financial metrics are hard numbers and data that can be measured and analyzed, like a company’s earnings, stock prices, and the downside and upside deviations around such prices.
On the other hand, qualitative factors are more subjective. How strong and reputable is a company’s brand image? What are the emotions and perceptions around a company’s given stock? What is the tone of the Social Media discussions around a particular topic? Qualitative insights provide context that numbers alone may miss, but they are inherently subjective.
Qualitative Euphoria
So what we say next should be taken with the understanding that it is our own qualitative, subjective read of market sentiment at the moment.
If you set the permanent “doom crowd” aside (they are every-present) over the last 8 months? Primarily from the ‘retail’ crowd, I keep hearing that same ol’ refrain I heard in 1999, and in 2007.
“This time it’s different”
It is the same bullish euphoria you have seen in every market bubble since man started selling sticks to one another.
It consistently and constantly the belief that ‘this time is different’. And ‘the market will never go down again’. You see this attitude develop at the peak of every longer-term stock market rally.

I have just recently received phone calls from friends and family who are not in the market or traders …
“Is now a good time to buy Nvidia?”
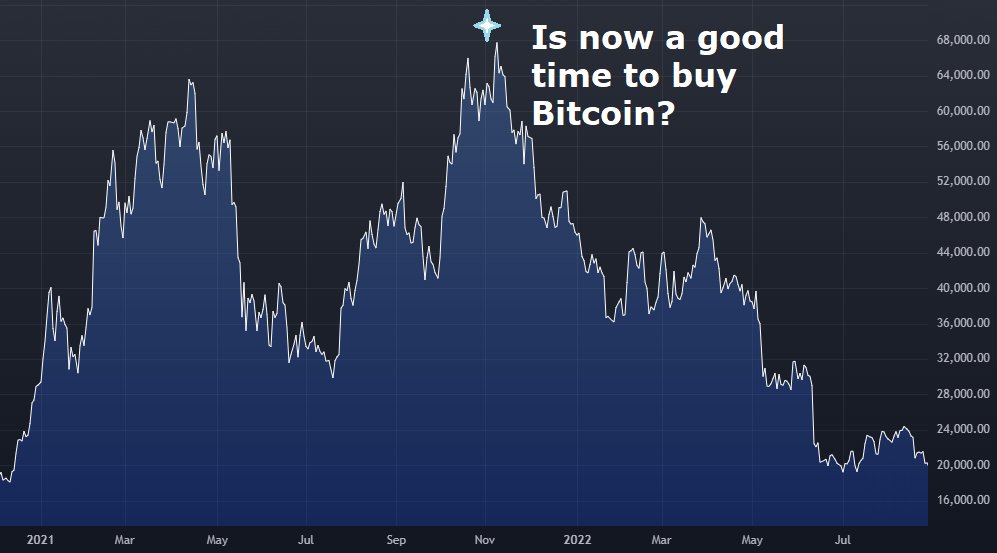
The same sort of phone calls I received in November of 2021 by family members asking:
“Is now a good time to buy Bitcoin?”
The common justification is that somehow … someway …
“This time around, it’s different than 2000 or 2007”
No.
It’s not.
Again, a Multi-Variate View
So let’s review our multi-variate, now four part separate variables we’ve examined in recent weeks.
-
We are at the quantifiable extreme upper range of stock market valuations.
-
The indices, in terms of price (not value), are at an extreme upward standard deviation, a trend we have typically seen since 2019 and 2000.
-
Upside deviations in returns have been increasing dramatically in recent years.
-
At the same time, we see qualitative signs of market euphoria.
In conclusion, we believe we’re in the final stage of a long-term stock market rally, and both quantitative and qualitative indicators suggest we’ve entered a stock market bubble.
Until next time, stay safe … and trade well …
Economic Calendar
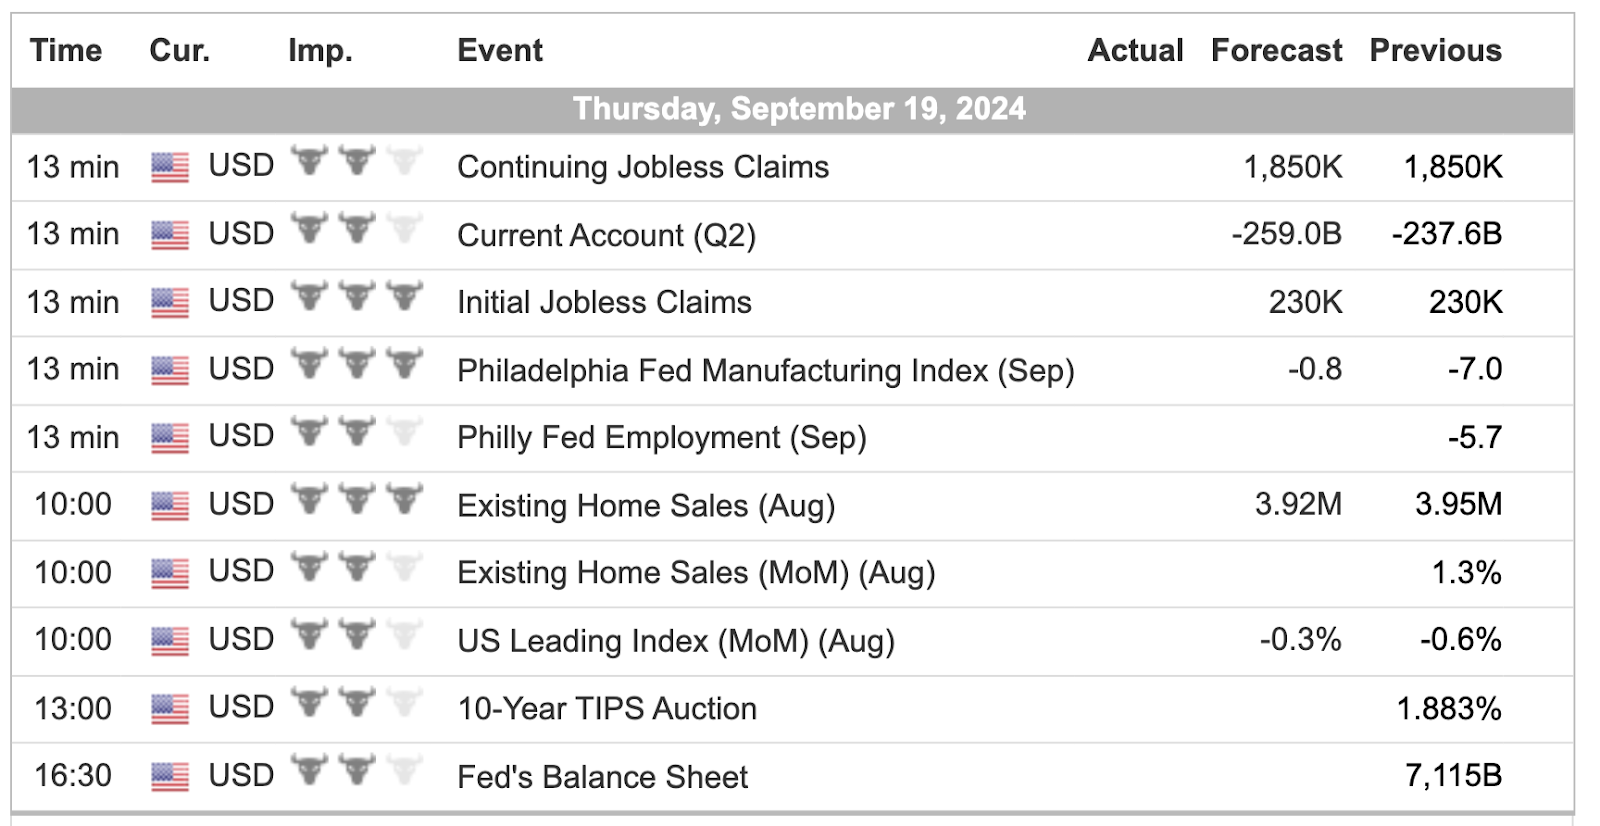
For a more complete Economic Calendar see: https://mrtopstep.com/economic-calendar/
Comments are closed