“Thin to Win” Prevails as ES Hits New Highs
It was the 41st record high of the year.
Follow @MrTopStep on Twitter and please share if you find our work valuable!
Every week, MrTopStep invites traders to an “Own the Close” contest where the closest guesstimate where the SPX will settle on Friday’s 4:00 cash close.
The winners get a free week’s access to the MrTopStep Chat and trading tools. Enter your guess now!
Our View
I don’t know how to explain it, but I got this weird feeling that things just can’t keep going like they are…Did you see gold? It traded up to $2,689.35, oil jumped and so did the S&P and Nasdaq. I tried to paint a less negative picture in yesterday’s Lean for 3 reasons:
-
Monday’s low held and put in a “higher low” from last Friday’s low
-
Low volumes leading to a “thin to win” type of tape
-
Too high of expectations for the negative seasonal stats
I still think there will be some down moves coming, but right now the ES just made its 41st all time high backed by bellwether Nvidia climbing 4%.
How bad can it be?
Our Lean
The tone of yesterday’s lean was less pessimistic because of? Thin to Win!!! I know that sounds funny, but this is what happens when the ES volume falls to ~1 million contracts a day and trust me on one thing: Volume — or lack thereof — matters!
I didn’t get the back-and-fill at lower prices like I said because the ES needed to go higher and that’s what it did. Yes, the range expanded — it couldn’t get any smaller than the 23.5 points from Monday. I could list the econ reports and Fed speak but you know what? None of it matters because the ES and NQ do the same thing everyday:
They close weak, rally on Globex, sell off after the 9:30 open, make a low and then rally. But by that time, everyone that was long is now short and the ES just chops along with the late NQ weakness until the boys with the better seats show up late. They have nailed down their front running to the final minutes of the day and after the bell.
Our Lean: If the ES gaps higher, I would be inclined to sell the early rallies and buy the pullbacks. If the ES opens lower, I am buying the early weakness.
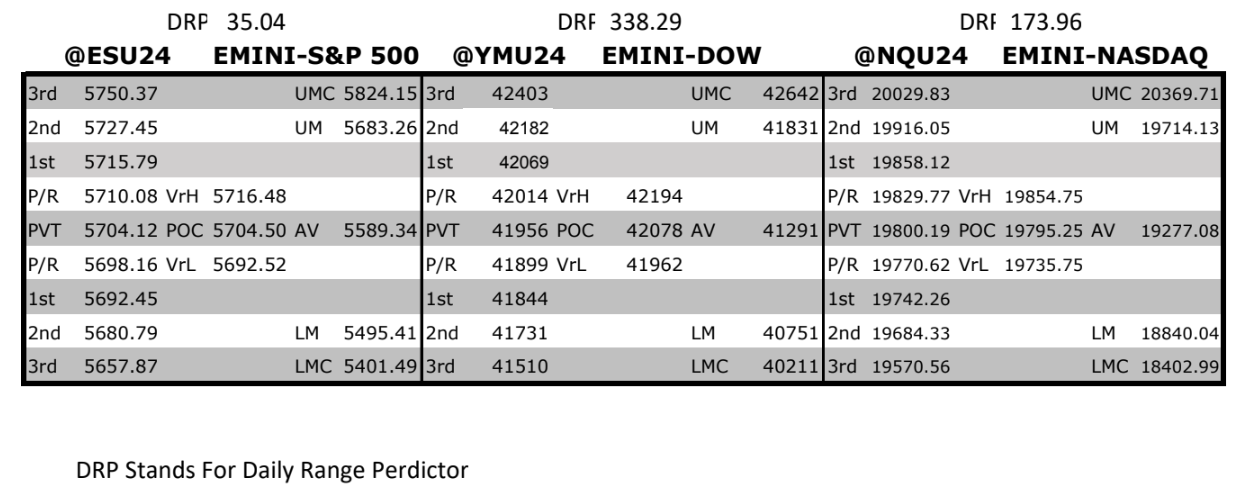
MrTopStep Levels:
MiM and Daily Recap
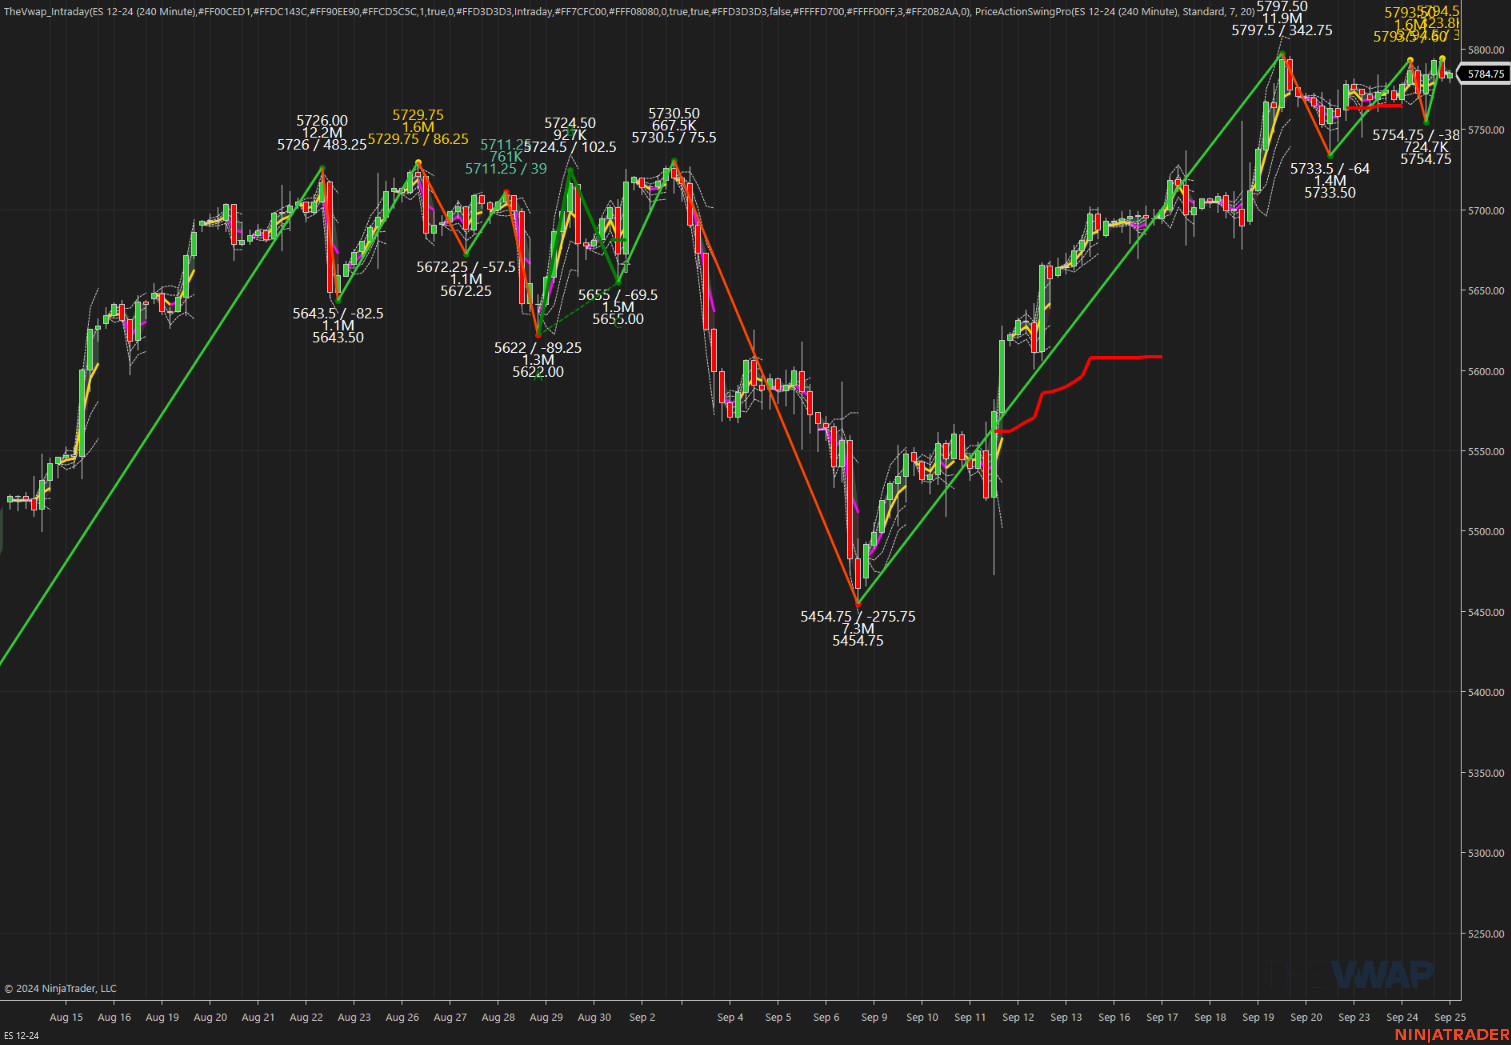
ES Recap
The ES rallied up to 5793.00 on Globex and opened Tuesday’s regular session at 5784.25. After the open, the ES rallied up to 5786.75 and then sold off 32 points down to 5754.75 at 10:42. It then rallied 35.75 points up to 5790.50 at 11:57, pulled back to the 5781.75 level at 12:27, and rallied 9.5 points up to a new day high at 5791.25. The ES traded back down to 5782.00 at 1:00 and then rallied up to a lower high at 5789.50 at 1:36. It dropped 6.75 points down to 5787.00 at 3:27, rallied up to 5787.75 at 3:49, and traded 5786.25 as the 3:50 imbalance showed $400 million to sell. It traded 5792.50 on the 4:00 cash close.
After 4:00, the ES sold off down to 5788.50 at 4:07, and then some buy imbalances started showing up, which pushed the ES up to 5793.75. It settled at 5792.75, up 18 points or +0.31%. The NQ settled at 20,185.25, up 122.25 points or +0.61%. Oil climbed to a two-week high on China stimulus, and Bitcoin jumped 980 points or +1.55% to $64,340.00.
In the end, despite the negative seasonals and consumer confidence falling to a three-year low, the ES and NQ rallied on Globex and on the day session. In terms of the ES’s overall tone, it was firm but there were a lot of two-way programs going on into the close. In terms of the ES’s overall trade, volume was higher at 1.113 million contracts traded.
Technical Edge
-
NYSE Breadth: 65% Upside Volume
-
Nasdaq Breadth: 74% Upside Volume
-
Advance/Decline: 60% Advance
-
VIX: ~15.50
-
Hit its September low of 15.27 in yesterday’s session
-
Guest Post — PTGDavid @ Polaris Trading Group
Prior Session was Cycle Day 1: Normal CD1 as price declined establishing a new cycle low at 5754.75, which we will use as this cycle’s performance benchmark. This session was Day 4 of the consolidation phase post FED as price traversed our core range (5745 – 5785) as outlined in previous Daily Trade Strategy Briefings. Range was 39 handles on 1.013M contracts exchanged.
For a more detailed recap of prior trading session click on this link: Trading Room RECAP 9.23.24
…Transition from Cycle Day 1 to Cycle Day 2
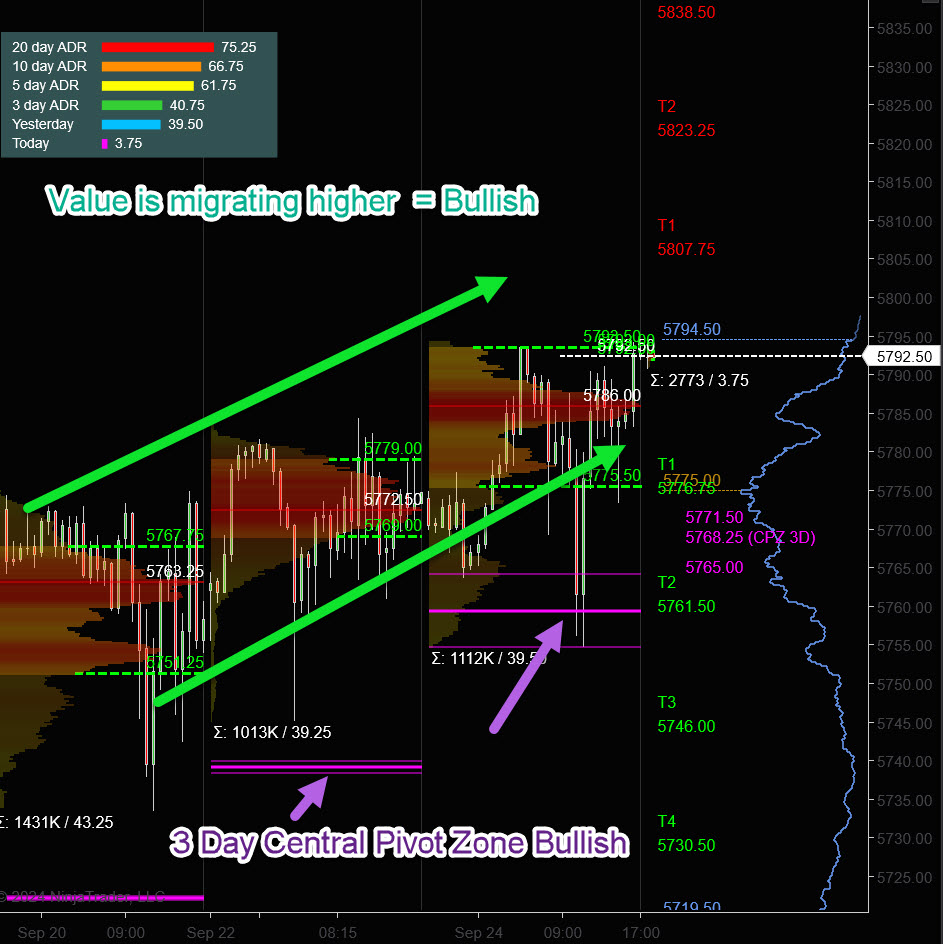
This leads us into Cycle Day 2: Value has been migrating higher (see chart below) during this consolidation phase, which by conventional wisdom favors an upside resolution and continuation of the uptrend. Key pivot (5770) is a critical hold on any pullback within multi-day range. Ideally, for continuation breakout higher, price should hold above 5785 with fresh new aggressive buying volumes. So we will remain patient and vigilant for the proper structural conditions to support retest of All-Time Highs.
Typically markets ebb and flow from Contractionary to Expansionary periods. The next expansionary phase will develop, so we need to be prepared for when it does. I have noted some level ideas for the next expansion, which is meant to be an overview guide.
Expansion Trigger Level?
The key level to watch for an expansion trigger would be 5785 on the upside. This was noted as a resistance zone that bulls have struggled to clear.
If price action breaks above 5785 and holds, it could act as a trigger for expansion and a potential rally to higher levels, with multiple upside targets staggered between 5800-5820 or higher, depending on momentum.
On the downside, if price breaks below 5755, which is the lower boundary of larger range, it could trigger a downward expansion, with potential targets between 5720-5700.
So, the critical trigger levels for expansion:
-
Upside: Break and hold above 5785.
-
Downside: Break below 5755.
Our discipline of maintaining positioning that is aligned with market forces continues to serve us well, so stay the course.
As such, scenarios to consider for today’s trading.
Bull Scenario: Price sustains a bid above 5785, initially targets 5805 – 5810 zone.
Bear Scenario: Price sustains an offer below 5785, initially targets 5770 – 5765 zone.
PVA High Edge = 5793 PVA Low Edge = 5775 Prior POC = 5786
ES Chart (Profile)
Thanks for reading…PTGDavid
Economic Calendar
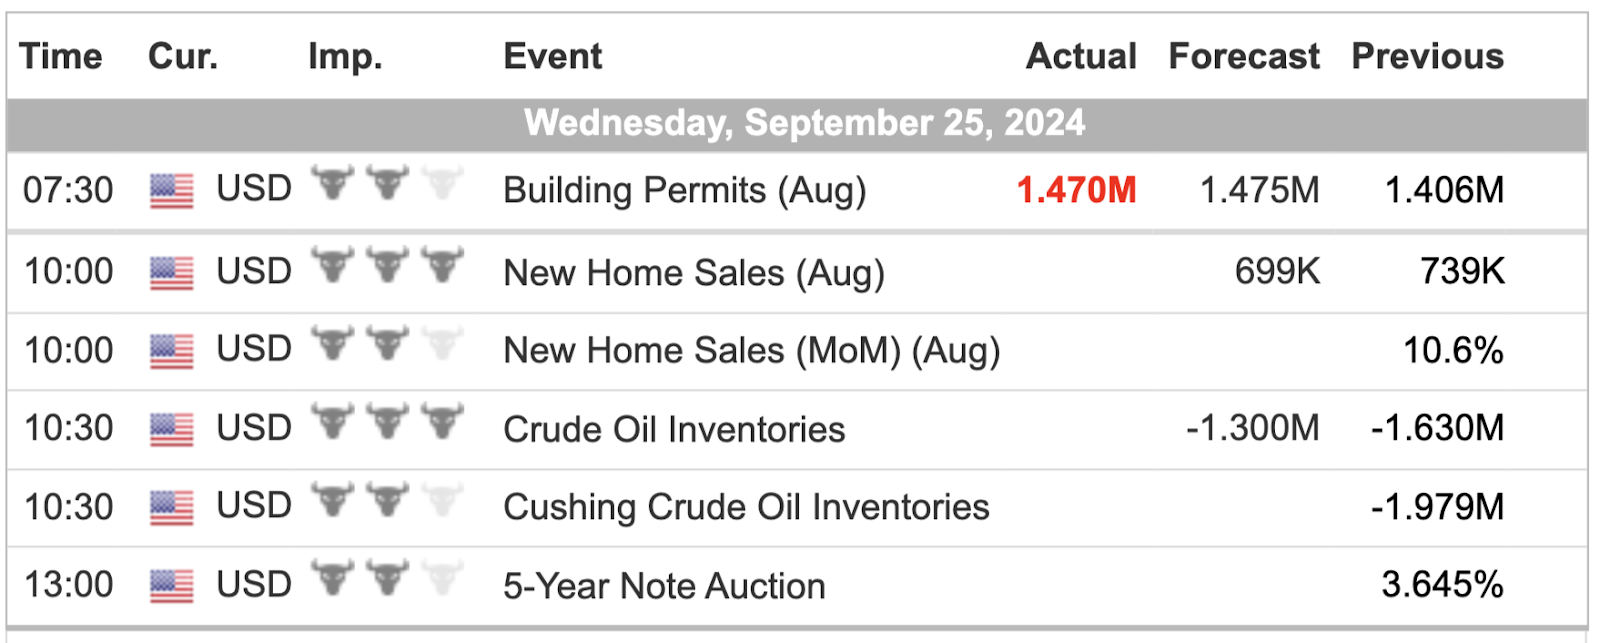
For a more complete Economic Calendar see: https://mrtopstep.com/economic-calendar/
Comments are closed