These Same Patterns Keep Repeating (for now)
The S&P has rallied a long way in a short period
Follow @MrTopStep on Twitter and please share if you find our work valuable!
Every week, MrTopStep invites traders to an “Own the Close” contest where the closest guesstimate where the SPX will settle on Friday’s 4:00 cash close.
The winners get a free week’s access to the MrTopStep Chat and trading tools. Enter your guess now!
Our View
Over the last 11 sessions, the ES has rallied 386 points from its low up to a recent high of 5798.75. From the low on August 5, the ES is up more than 675 points (or 13%).
No matter how you look at it or what anyone says, the markets have come a long way and continue to overlook an array of negative news. I have said this before, but I am not just the PitBull’s friend; I am his street-smart consigliere, and he has been very straightforward about what he thinks of the stock market — and it isn’t good.
He said he got out of all his stock positions today, and if the S&P keeps going up, he’s okay with that (I don’t doubt that). He said that everyone is long without a care in the world and that October is coming, which scares him right now.
According to @HandelStats, the ES has only been down one month in the last nine months, and the stats show there is going to be another down month. Why not “spooky October”? He finished by saying that the election is frightening. And lastly, he asked me, “What happened to the volume?”
Our Lean
Here are a few takeaways from the overall price action of the ES and NQ: In most cases, when the ES and NQ close weak, they rally on Globex. If the ES and NQ gap higher, they usually sell off on the open and we look for a drop to buy and get long off of and hold for a push back up, while starting to look for daily NQ selling to show up.
That’s what we have mainly been seeing for the last 2 to 3 weeks. Oh yeah, and the buy-the-ES-at-3:59 trade sometimes actually sets up the Globex rally. But — and there is always a “but” — I think yesterday we started to see part of the end of the Q3 rebalance, and you can see it in the futures net changes: The ES settled at 5783.25, down 8.75 points or -0.15%; the NQ settled at 20,242.00, up 74.25 points or +0.37%; the YM settled at 42,255.00, down 332 points or -0.78%; and the RTY settled at 2,220.00, down 26.50 points or -1.18%.
Our Lean: Follow the patterns I just wrote about. It’s 10:26 PM, and the ES just traded at 5799.25. Now this morning it’s 20 handles above 5800 as tech rallies on the back of Micron’s results. Like I have said all week, low volumes and “thin to win” have taken over. While it won’t last forever, it’s the environment we have right now and so far, the patterns we just talked about continue to play out. Stick to them for now and remember to always use a stop.
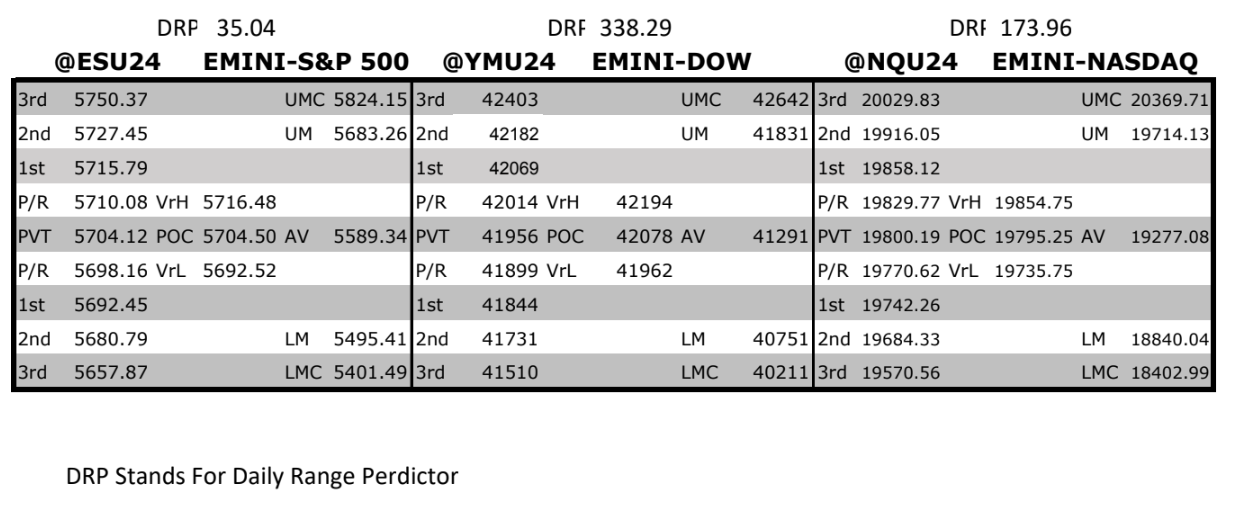
MrTopStep Levels:
MiM and Daily Recap
ES Recap
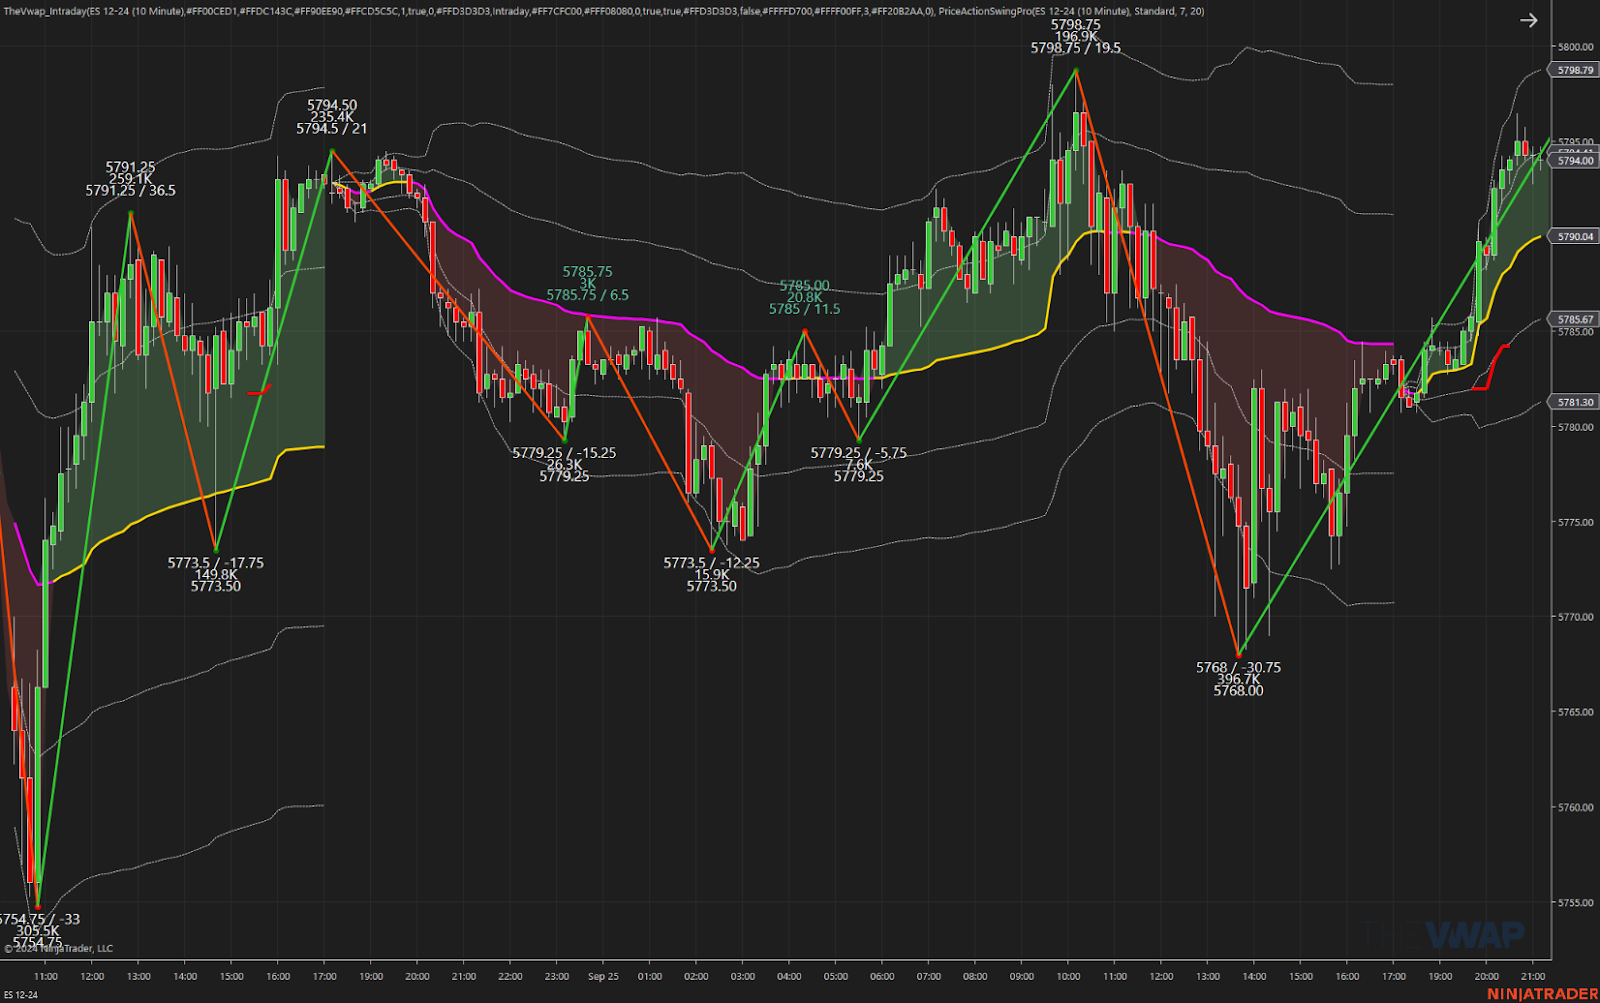
The ES traded up to 5792.50 on Globex and opened Wednesday’s hump day trade at 5790.50. After the open, the ES shot up to 5798.00, sold off 10 points down to 5788.00 at 9:43, and then rallied 10.75 points up to 5798.75 at 10:08. After the high, the ES sold off 13.75 points down to 5785.00 at 10:51, then rallied 8.5 points up to 5793.50, and dropped 23.5 points down to 5768.00 at 1:36. After the low, the ES rallied 15 points up to 5783.00, sold off down to 5769.00 at 2:18, and then moved back up to a 5782.00 double top at 3:06. That’s when the next wave of NQ selling showed up, pushing the ES back down to 5772.75 at 3:40. It then traded up to 5777.25 and at 3:50 traded at 5776.50 as the cash imbalance showed $154 million to buy. Some ES buying occurred, and it traded 5780.75 on the 4:00 cash close.
After 4:00, the ES traded up to 5784.50 at 4:15, sold off down to 5780.75, rallied up to 5782.00, and settled at 5783.25, down 8.75 points. It made its third new all-time high in the last three sessions. The NQ settled at 20,242.00, up 74.25 points or +0.37%. The YM, which made two new all-time contract highs on Monday and Tuesday, settled at 42,255.00, down 332 points or -0.78%. The RTY settled at 2,220.00, down 26.50 points.
In the end, it was another day of going up early and then down. In terms of the ES’s overall tone, there was a heavy day of rotations. In terms of the ES’s overall trade, volume was lower: 126k traded on Globex and 874k traded on the day session for a total of 973k contracts traded, the lowest volume since July 3 when the volume dropped to 801k (which was a half-day in the markets).
Technical Edge
-
NYSE Breadth: 30% Upside Volume
-
Nasdaq Breadth: 46% Upside Volume
-
Advance/Decline: 28% Advance
-
VIX: ~15.25
Guest Post — Dan at GTC Traders
It’s a Bubble: Part Five – Performance
For the last four weeks in this series, we have been unpacking a statement from a few months ago …
“For both predetermined quantitative and qualitative reasons, we believe that we are in the late stages of a longer-term stock market rally; and are in the beginning stages of a stock market bubble. When this happens, our portfolio mandate switches us to play what Poker players would call a very ‘nit’ game. In other words, all of our programs become very … tactically tight. Smaller position sizes.”
In previous weeks we expounded on the statement … “For both predetermined quantitative …. reasons, we believe … “. We quantitatively described …
-
The last time valuations were this piqued, was 2000, the end of 2019 … and now.
-
The extreme sigma, or standard deviations we find ourselves in, in terms of pure price.
-
Upside deviations in Index returns have exploded in magnitude in recent years.
Just as one would expect to find as a stock market bubble begins.
When we said … “For … qualitative reasons ….”; last week we explained our observations in the sentiment of recent stock market euphoria.
Great.
But what do we mean by … “our portfolio mandate switches us to play what Poker players would call a very ‘nit’ game.”
Portfolio Mandate and Performance
A portfolio mandate is a set of guidelines that dictates how any manager directs their trades. It defines the parameters for risk tolerance, asset allocation, and specific investment strategies, allowing a manager to respond effectively to changes in the market. A specific framework helps ensure that our investment decisions align with overall objectives; while remaining flexible enough to adapt to market realities. Many Private Proprietary Firms, Family Offices and larger firms operate to a given portfolio mandate; that they set for themselves.
Our mandate tells us that when we see what we have described in the last five weeks, to proceed in a very conservative manner.
Now, if we can switch to discussing performance for a brief time.
As our ‘pinned tweet’ states on our X / Twitter profile? We do not think that many newer and aspiring retail traders truly understand performance. And we’re not even talking about how to form a grid, performance statistics such as Sharpe and Sortino, or anything like that.
We mean … even understanding what ‘good’ performance looks like, or simply how much patience, and how long it can take to determine ‘good performance’. Too often, newer traders cry “under-performance” without really understanding what under-performance even is. Or worse yet, attempting to cry “under-performance” with a very brief time frame, like a year.
For example ..
What if a trader could attain an average of only 0.90% return each and every month; and at the same time … that performance has very minimal monthly drawdown that rarely exceeds 7% and usually hovers around the 2% range? Would that be ‘good’ performance?
Many might say ‘no’. That one would need much higher monthly return numbers.
Well, such performance looks a little something like this …
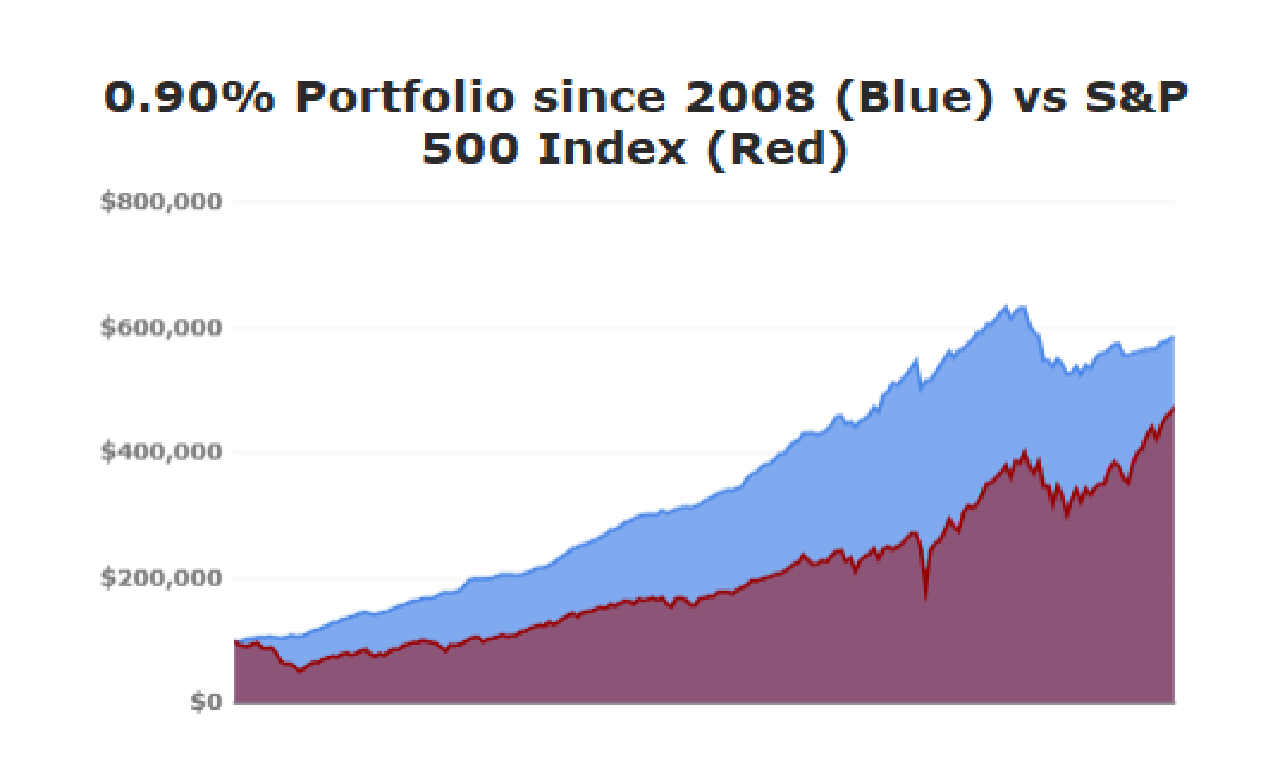
The point being? Is that with patience, and an understanding of performance? What may not sound like ‘impressive’ performance can actually turn out to be quite stellar. After all, the S&P 500 Index only averages 0.94% per month. If an individual can simply get a handle on their losses and drawdown numbers? Out-performance of the S&P 500 over the long-haul becomes the natural result.
This is something Danny posted recently on their Twitter feed, and I think it bears repeating …
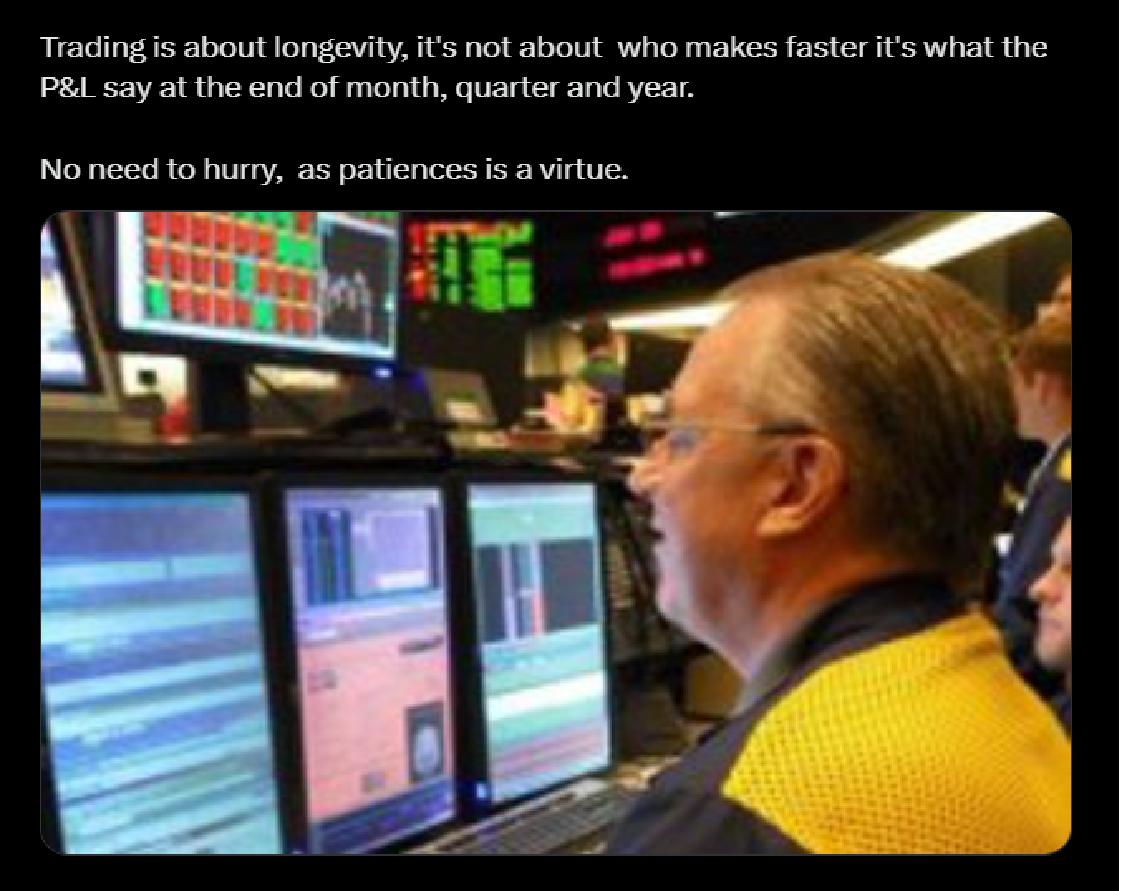
“Trading is about longevity, it’s not about who makes faster. It’s what the P&L says at the end of the month, quarter and year. No need to hurry, as patience is a virtue”
When a new or aspiring trader truly understands the above? Outstanding progress can be made. Look at the above graph of returns. There are many shorter time periods within that graph, wherein the S&P 500 Index outperformed.
The key word is … shorter time periods.
Over the long haul, out-performance takes place. Thus, why we have no problem playing a very tactically ‘nit’, conservative ‘game’ at the moment; in what we believe is a stock market bubble.
Taking a quantitative look at under-performance and out-performance is something we can take a closer look at next week. For now?
Until next time, stay safe … and trade well …
Economic Calendar
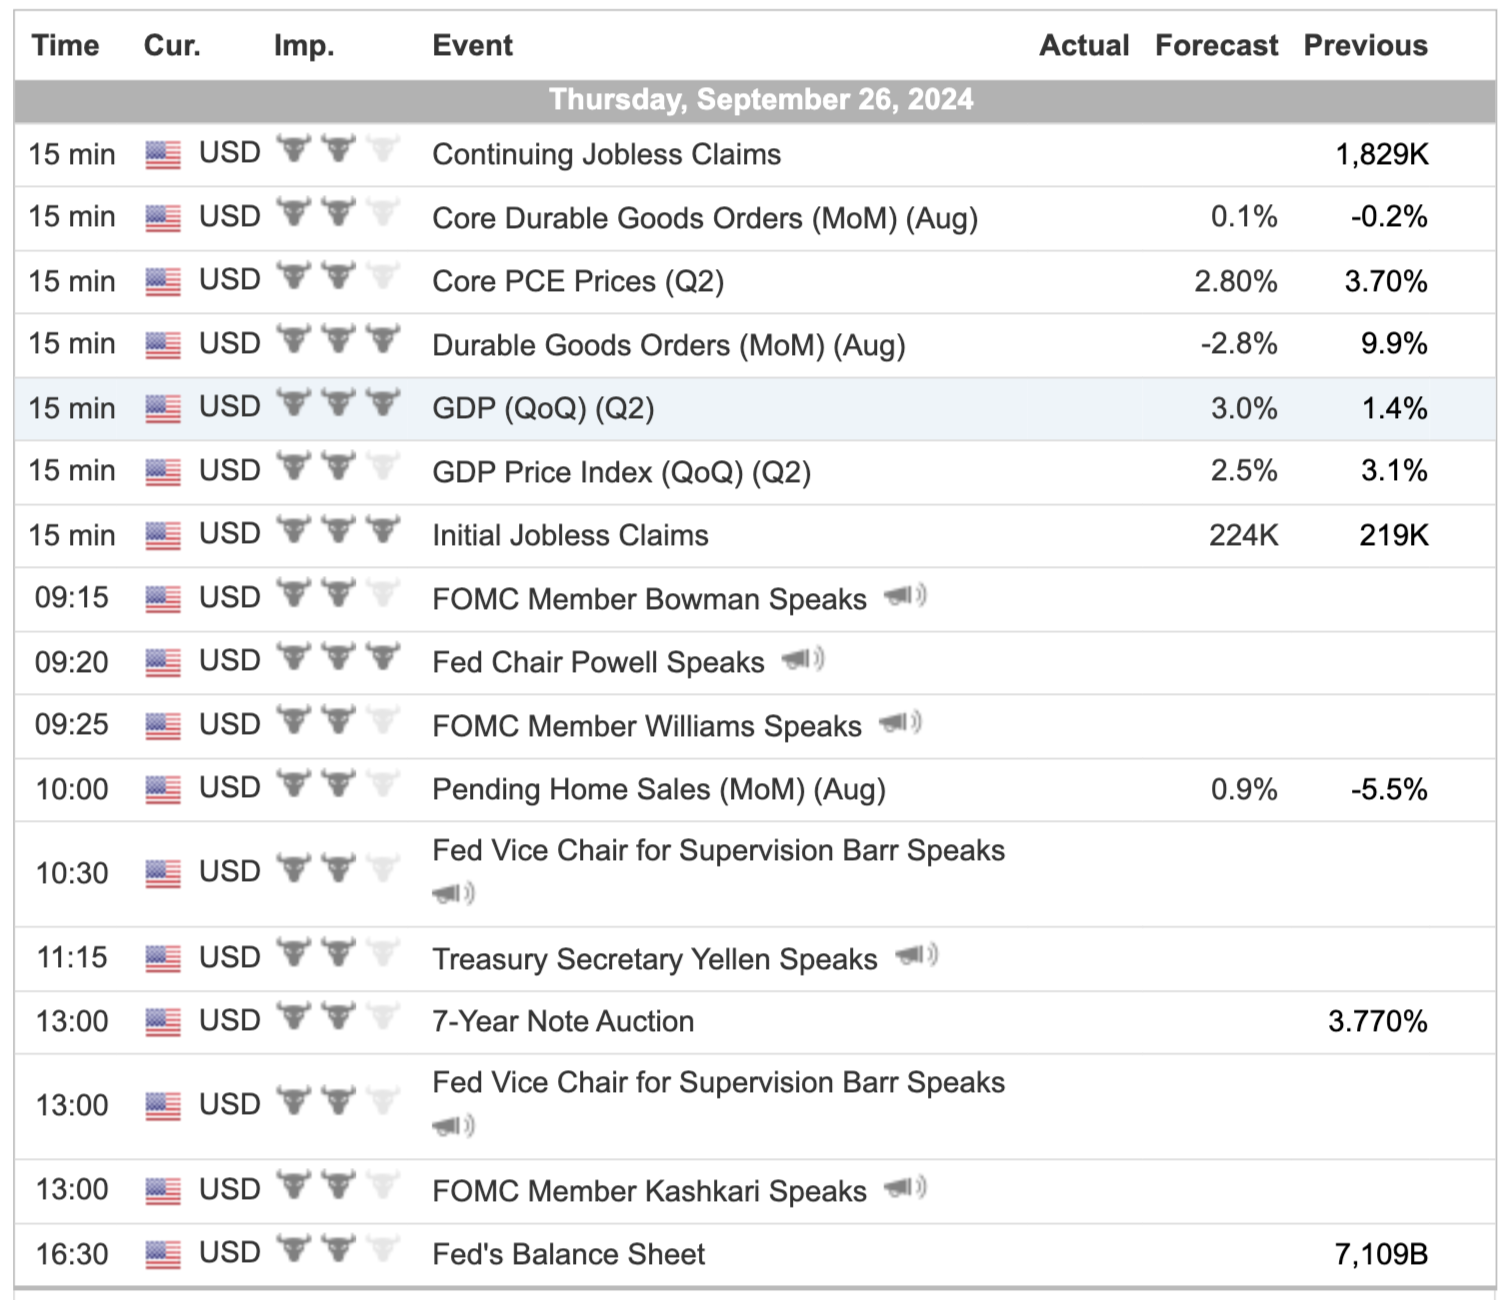
For a more complete Economic Calendar see: https://mrtopstep.com/economic-calendar/
Comments are closed