This post goes out as an email to our subscribers every day and is posted for free here around 2 PM ET. To get your real-time copy, sign up for the free or premium version here: Opening Print Subscribe.
All Hands On Deck
Follow @MrTopStep on Twitter and please share if you find our work valuable!
Our View
From China telling some of its tech companies to halt orders of Nvidia’s H200 GPUs, to Trump’s plan to dictate the terms of Venezuela’s government, control oil, and sell significant oil barrels following Maduro’s capture, to the ongoing talk about acquiring Greenland, with military use not ruled out, the markets had a lot to digest.
Add to that the potential clash with Vladimir Putin after the U.S. seized a Russian-flagged tanker, and new steps to implement a ban on large institutional investors from purchasing single-family homes, and it’s no surprise the markets got spooked.
Like I’ve said many times: Welcome to 2026, the year of volatility!
Our View
Like I have said many times, no one knows for sure what the markets are going to do, but my question is: how long can the markets go up without a major correction?
My own opinion: the ES has rallied 4,840 points or 222.63% from the March 2020 low of 2174. Has it gone too far? Like I’ve always said, I’m not an economist or Wall Street analyst, and I’m not smarter than you. I’m just an old floor guy from the S&P pit who has been part of every market decline since 1980, and I think there are red flashing lights.
I don’t know when the next crash is coming, but I do know that timing is everything. I don’t know one trader who doesn’t dream about catching it when it happens. It’s not if, it’s when.
As famous trader Peter Lynch said:
“Far more money has been lost by investors trying to anticipate corrections, or trying to time the market, than has been lost in the corrections themselves.”
Our Lean
I didn’t like the way the markets closed, and today I could see further selling with increased risk on FRYday. I flattened out last night and want to get a good look at the price action.
Our lean: I’m not ruling out a pop or rally—but it could be a buyer-beware time.
Market Recap:
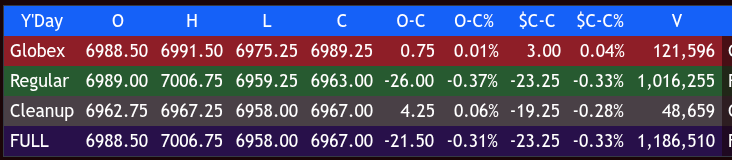
The ES traded down to 6975.25 on Globex and opened Wednesday’s regular session at 6989.00. After the open, the ES traded 6984.00, rallied up to 6998.25 at 9:45, sold off down to 6976.25 at 10:35, rallied up to 6995.25 at 11:00, pulled back under the VWAP down to 6986.00 at 11:25, and then rallied up to a 7006.75 double top at 12:20.
It sold off down to 6987.00 at 1:25, rallied back up to a lower high at 6998.25 at 1:50, sold off down to 6981.25 at 2:15, did a small back and fill, and traded up to 6988.50 at 2:35. That’s when the sell programs started to hit as the YM made new lows and sold off down to 6959.25 at 3:41. It then rallied up to 6964.75 at 3:48, traded 6963.00 as the 3:50 cash imbalance showed $1.2 billion to buy and rallied up to 6966.25, sold back off down to 6960.00 at 3:55, and traded 6963.00 on the 4:00 cash close.
After 4:00, the ES slowly crept up to 6967.25 and settled at 6967.00, down 24.50 points or -0.35%. The NQ settled at 25,838.75, up 16.75 points or +0.06%, and the YM settled at 49,239.00, down 482 points or -0.79%, after being up 3 sessions in a row or up a total of 1,385 points.
In the end, the ES rallied up to 7006.75 but weakened as multiple late headlines hit the tape. I warned in the chat that I didn’t think it was a good idea to get long above 7000.00 the first time up, as “everyone” got long into the rally.
In terms of the ES’s overall tone, it acted well in the first part of the day, but late-day weakness in the NQ and the headlines helped push the index markets back down. In terms of the ES’s overall trade, volume was low and slightly lower than Tuesday’s trade at 1.187 million contracts traded.
On Tap
The economic schedule picks up as we go into the end of the week.
Thursday:
-
8:30 am: Initial Jobless Claims, U.S. Trade Deficit, and U.S. Productivity
-
4:00 pm: U.S. Consumer Credit
Friday:
-
9:45 am: U.S. Employment Rate, U.S. Hourly Wages, U.S. Hourly Wages YoY
-
Also: Housing Starts, UMich Consumer Sentiment
-
1:35 pm: Richmond Fed President Tom Barkin speaks
MiM
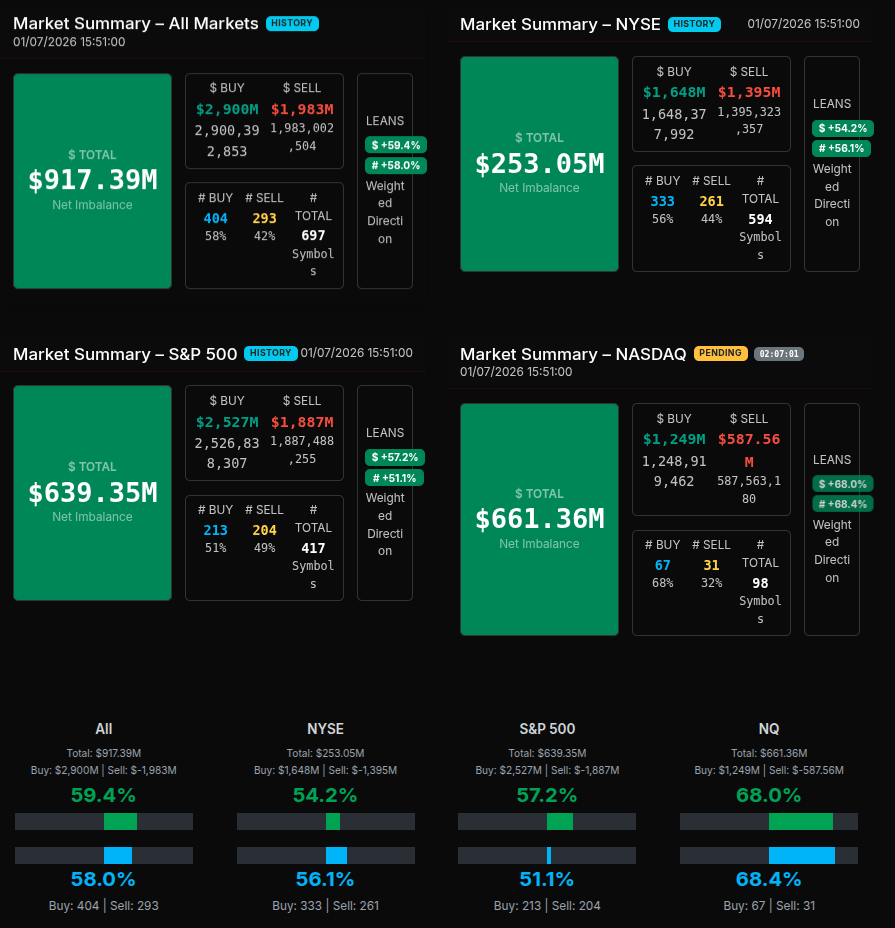
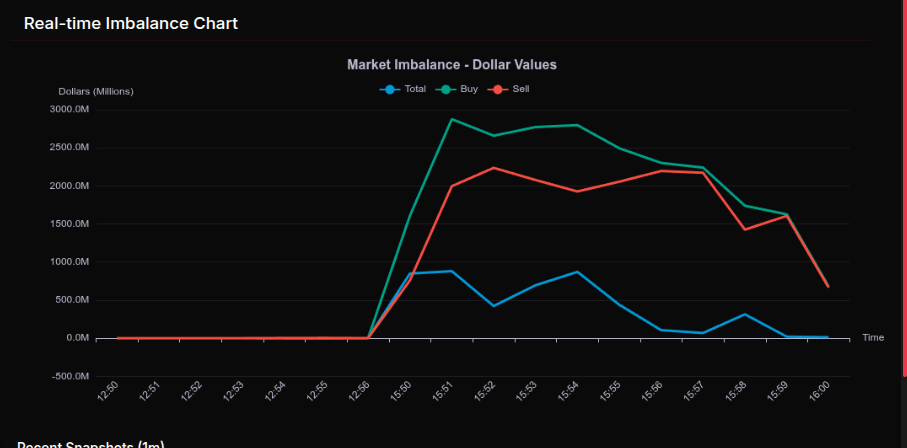
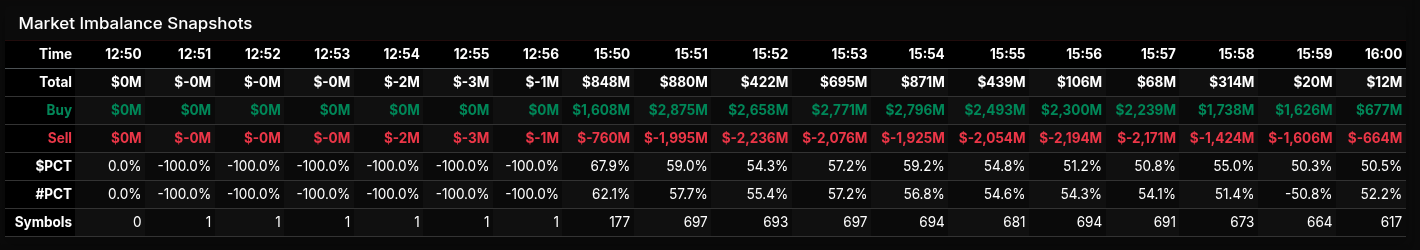
The Market-on-Close auction developed into a clearly buy-skewed session, but the path was anything but linear. Early prints ahead of 3:50 ET were essentially dormant, with negligible imbalance signals until the first meaningful snapshot hit at 15:50. At that point, total imbalance jumped sharply positive, driven by a surge in buy programs that set the tone for the remainder of the auction.
From 15:50 through roughly 15:55, buy dollars expanded aggressively, peaking near $2.8B while sell interest also climbed, keeping the tape volatile. This created a classic MOC push-pull: headline net imbalance stayed positive, but internal rotation was evident as sell programs chased strength rather than capitulating. After 15:55, buy pressure began to fade incrementally, though it remained dominant into the close, allowing the auction to finish with a firm net buy imbalance.
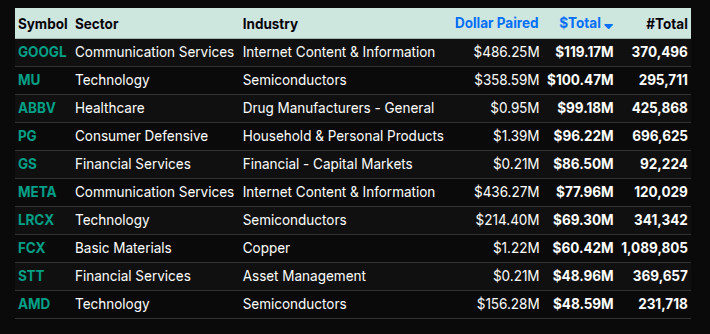
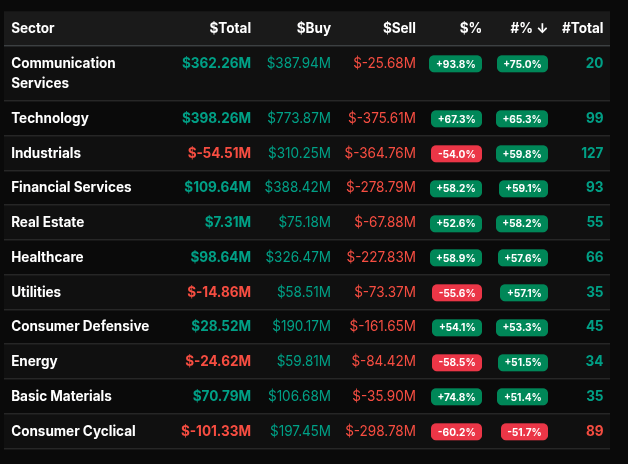
Sector behavior confirmed a mix of wholesale buying and rotation. Communication Services and Technology stood out with strong positive dollar totals and percentage leans well north of 66%, signaling institutional-scale demand rather than passive rebalancing. Technology, in particular, saw heavy participation across mega-cap software and semiconductor names, reinforcing its role as the primary buy vehicle. Financial Services and Healthcare also posted solid positive leans, but closer to the 50–60% range, suggesting more rotational flow rather than outright accumulation.
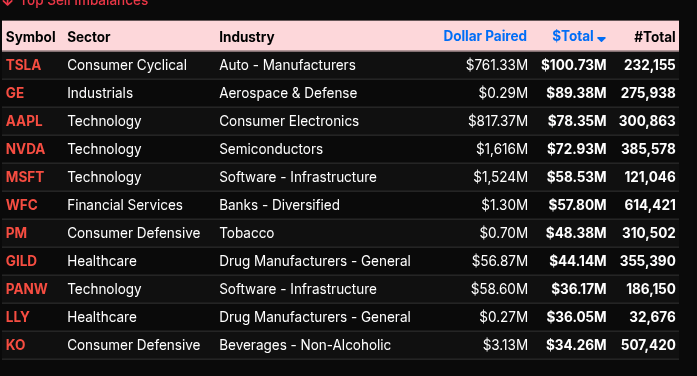
On the sell side, Consumer Cyclical and Industrials were notable drags. Both sectors posted deeply negative totals with percentage leans beyond -50%, pointing to more decisive distribution. Energy and Utilities also leaned lower, though their smaller dollar magnitudes suggested secondary reallocation rather than a broad exit.
Single-stock imbalances reinforced this narrative. Large buy interest clustered in mega-cap tech and communication names, while select industrial and cyclical symbols absorbed persistent sell pressure. By the final print, the auction resolved with a clear net buy bias across All Markets, the S&P 500, and especially Nasdaq, where the percentage lean approached the upper end of the range—evidence that growth and tech leadership remained firmly in control into the close.
Guest Posts:
Dan @ GTC Traders
Everything Is Great … Until It Isn’t
As I have been perusing the ol’ ‘interwebs’ as of late, I have noticed that trader, after economist, after commentator has been pointing to an expansion in economic activity in the United States, and why we ‘don’t really need to pay attention to valuations’ due to expansive growth in the U.S. economy.
Now, to be sure? The underlying assumptions and variables to any valuation model, from intrinsic to relative value, can change. And therefore what was ‘overvalued’, without much dip in the nominal price, can transform into ‘fair value’, or even ‘undervalued’.
Regardless, getting back to my point. I thought this week it might be useful to remind ourselves why lagging indicators … are called lagging indicators.
By definition, many such metrics … be they corporate profits, GDP, or headline unemployment rates … are metrics that look into the past. And as such, they cannot tell us how a complex, chaotic future will actually unfold.
One History Lesson of Many
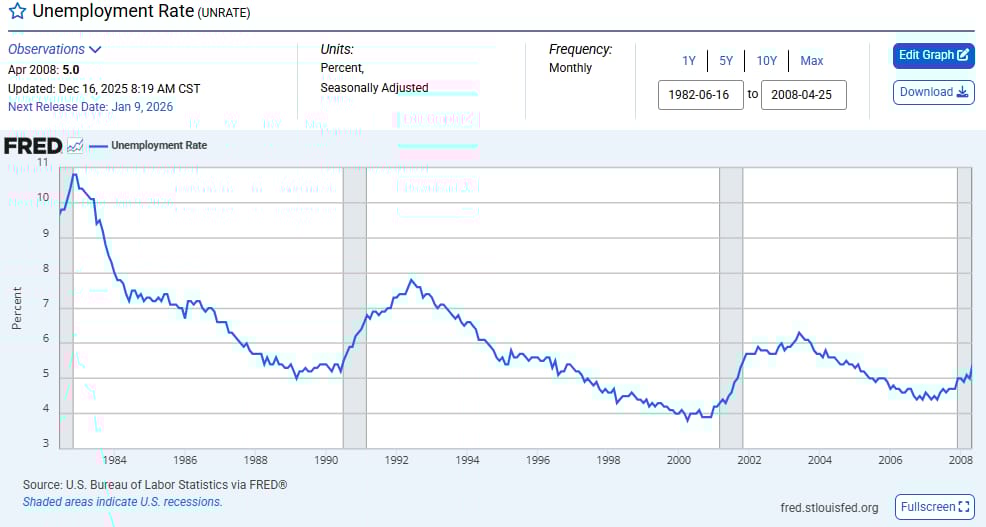
In the months leading up to the 2008 financial crisis, the dominant economic indicators told a comforting story. Growth was slowing … but still positive. Unemployment was rising … but not alarming. Corporate earnings were weakening … but far from catastrophic. And best of all? Equity Valuations still appeared quite attractive to overall earnings. One could have made an argument that the overall market to some extent was still somewhat undervalued.
Unemployment Rate up to May of 2008
“The Buffett Indicator” up to May of 2008
(Total US Stock Market Capitalization to GDP Ratio)
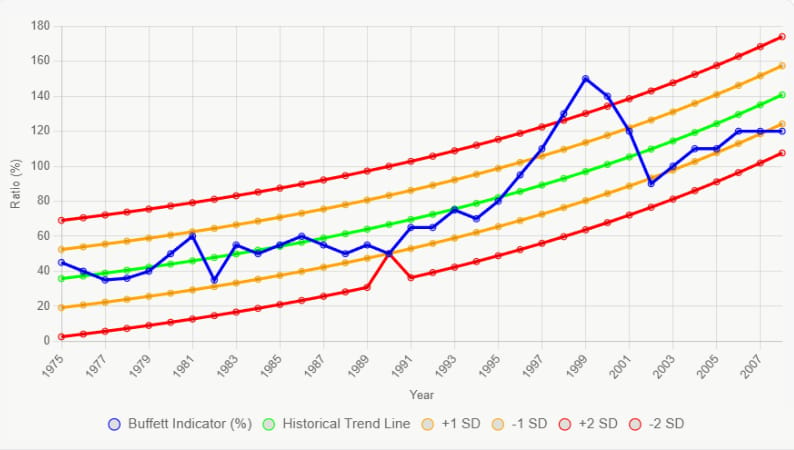
By the standard macroeconomic scorecards relied upon by economists, policymakers, and investors, the U.S. economy in early to mid-2008 appeared bruised … but intact. Mid-cycle. But still growing.
And then, all at once … it wasn’t.
This disconnect between what the data suggested and what ultimately occurred is not a historical curiosity. 2008 is not a ‘one off statistical outlier’. It is a structural feature of financial crises. In hindsight, it’s quite easy to watch ‘The Big Short’ and laugh at those ‘blindly unaware’ as to what was about to occur. The problem is that the tools most commonly used to assess “economic health” are largely blind to the mechanisms that actually cause systemic failure.
The problem was not economic activity. The problem was balance sheets.
In 2008, vast portions of the financial system were built on opaque assets tied to linear risk modeling assessment. As long as confidence held, the machine ran smoothly. When confidence wavered and the ‘players at the table’ began to question their counter-party risk? It was too late. The world was already over-leveraged 120:1.
GDP didn’t register it. GDP couldn’t register this. None of this showed up in employment reports. None of this showed up in output figures.
This led to my particular mantra when examining promising, econometric data: “everything is great … until it isn’t”. Which is simply an acknowledgment of the understanding that lagging traditional economic indicators will always fail at massive turning points.
They have to. They are lagging by design.
Employment falls after demand collapses. Earnings decline after funding dries up.
GDP contracts after balance sheets have already been impaired. By the time these indicators flash red … the crisis is no longer approaching. It has already arrived.
Just … Be Aware
We have long maintained that equity markets appear meaningfully overvalued. That view isn’t based on a single data point, nor on short-term economic momentum, but on a collection of structural considerations that guide how we manage portfolios.
That said, we readily acknowledge a simple truth. No one knows what the future holds.
The assumptions contained within any valuation framework, whether intrinsic or relative, are not static. They evolve. And as those inputs change? Valuations can adjust without requiring a decline in nominal prices. What appears overvalued today can, over time, become fairly valued through growth in earnings, cash flows, or broader economic capacity.
Put more formally, markets can grow into their valuations.
This possibility should not be dismissed. But neither should it be assumed.
The difficulty, as history repeatedly demonstrates, is that lagging econometric data often reinforces confidence precisely when valuations are most stretched. Growth may appear durable. Employment may remain resilient. Yet those signals are describing where the economy has been … not where it is going.
We do not claim to know how this resolves.
But when optimistic economic data is weighed against stretched valuations, it is worth remembering a lesson markets relearn repeatedly.
Everything is great … until it isn’t.
Technical Edge
Fair Values for January 8, 2026
-
S&P: 40
-
NQ: 173.65
-
Dow: 227.76
Daily Breadth Data 📊
For Wednesday, January 7, 2026
-
NYSE Breadth: 28% Upside Volume
-
Nasdaq Breadth: 56% Upside Volume
-
Total Breadth: 52% Upside Volume
-
NYSE Advance/Decline: 36% Advance
-
Nasdaq Advance/Decline: 46% Advance
-
Total Advance/Decline: 43% Advance
-
NYSE New Highs/New Lows: 137 / 41
-
Nasdaq New Highs/New Lows: 242 / 72
-
NYSE TRIN: 1.35
-
Nasdaq TRIN: 0.66
Weekly Breadth Data 📈
For the Week Ending Friday, January 2, 2026
-
NYSE Breadth: 47% Upside Volume
-
Nasdaq Breadth: 52% Upside Volume
-
Total Breadth: 50% Upside Volume
-
NYSE Advance/Decline: 43% Advance
-
Nasdaq Advance/Decline: 38% Advance
-
Total Advance/Decline: 40% Advance
-
NYSE New Highs/New Lows: 136 / 86
-
Nasdaq New Highs/New Lows: 225 / 521
-
NYSE TRIN: 0.84
-
Nasdaq TRIN: 0.56
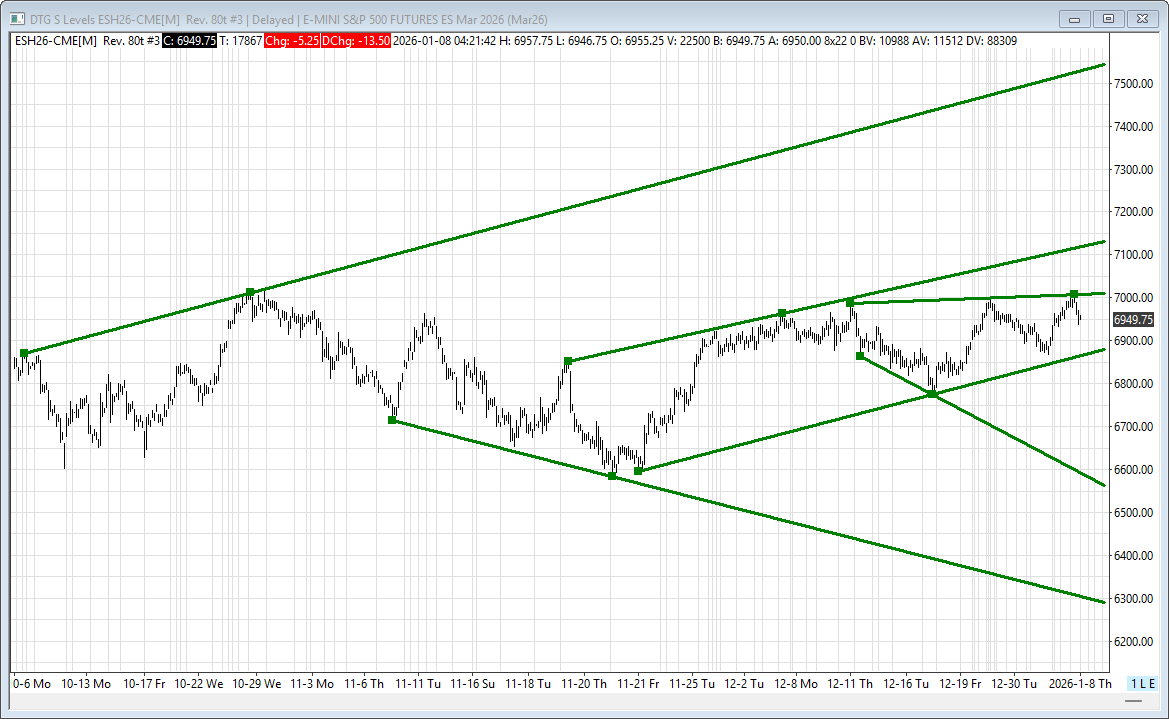
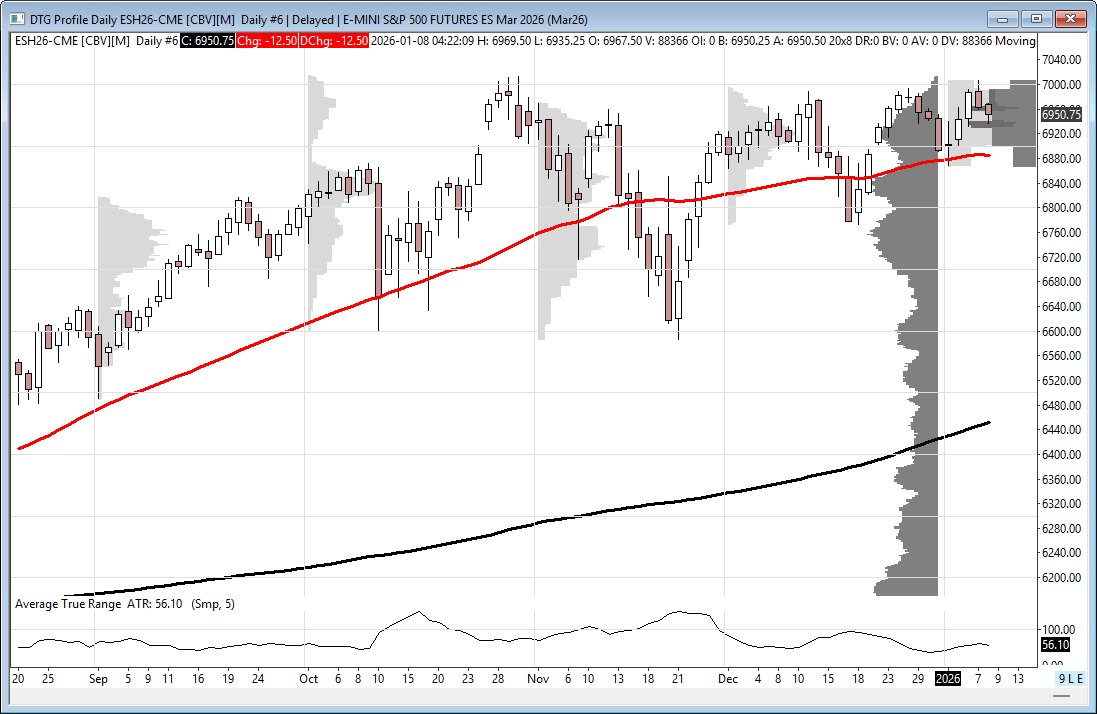
BTS Levels:
ESH2026
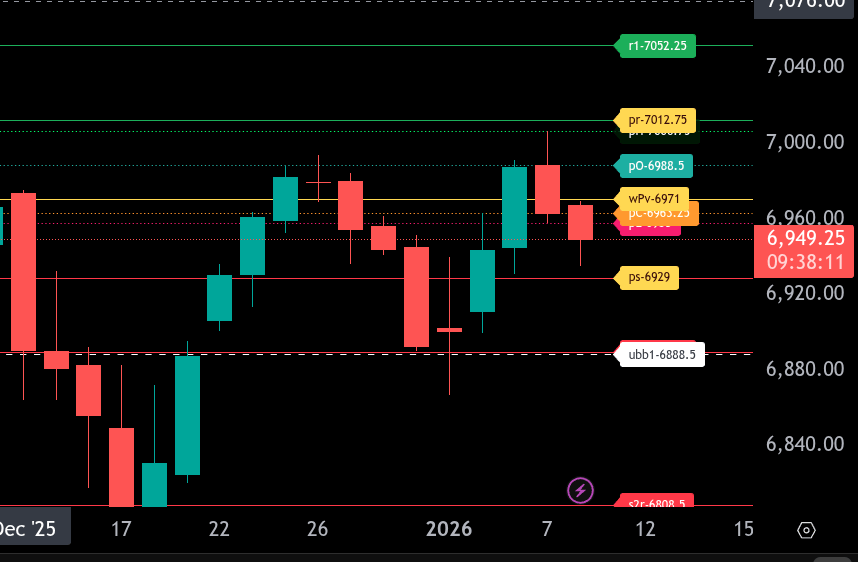
The bull/bear line for the ES is at 6971.00. This remains the key pivot for today’s trade. Acceptance back above this level would stabilize price action and open the door for rotation higher, while failure to reclaim it keeps pressure to the downside.
ES is currently trading around 6949.00, holding below the bull/bear line and below prior value. As long as price remains under 6971.00, sellers have control. Initial downside targets sit at 6958.00 and 6929.00, which is the lower range target for the session. A clean break below 6929.00 exposes the overnight base near 6888.50.
On the upside, resistance comes in first at 6988.50, followed by 7006.75. The upper range target is defined at 7012.75, with an extension toward 7052.25 if buyers regain 6971.00 and hold above it.
Overall, the ES bias remains bearish below 6971.00. Bulls need sustained trade back above the bull/bear line to shift momentum and target the upper range, while continued failure below keeps the focus on testing 6929.00 and potentially lower.
NQH2026
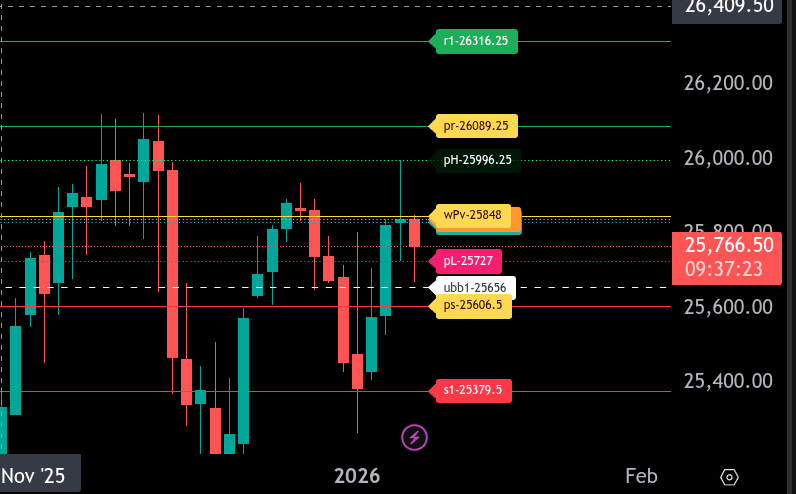
The bull/bear line for the NQ is at 25,848.00. This level is the key pivot for today’s session and defines short-term directional bias.
NQ is currently trading below the bull/bear line, keeping the tone bearish while below 25,848.00. Acceptance below this level opens the door for further downside toward 25,727.00 and then 25,656.00. A sustained break below 25,656.00 targets 25,606.50 as the lower range target for the session.
On the upside, first resistance comes in at 25,996.25, followed by 26,089.25, which is the upper range target. A reclaim and hold above 25,848.00 would shift momentum back to the upside and put these higher levels in play.
Overall, bias remains bearish while below 25,848.00. Bulls need a clean reclaim of the bull/bear line to negate downside pressure and re-engage the upper range targets.
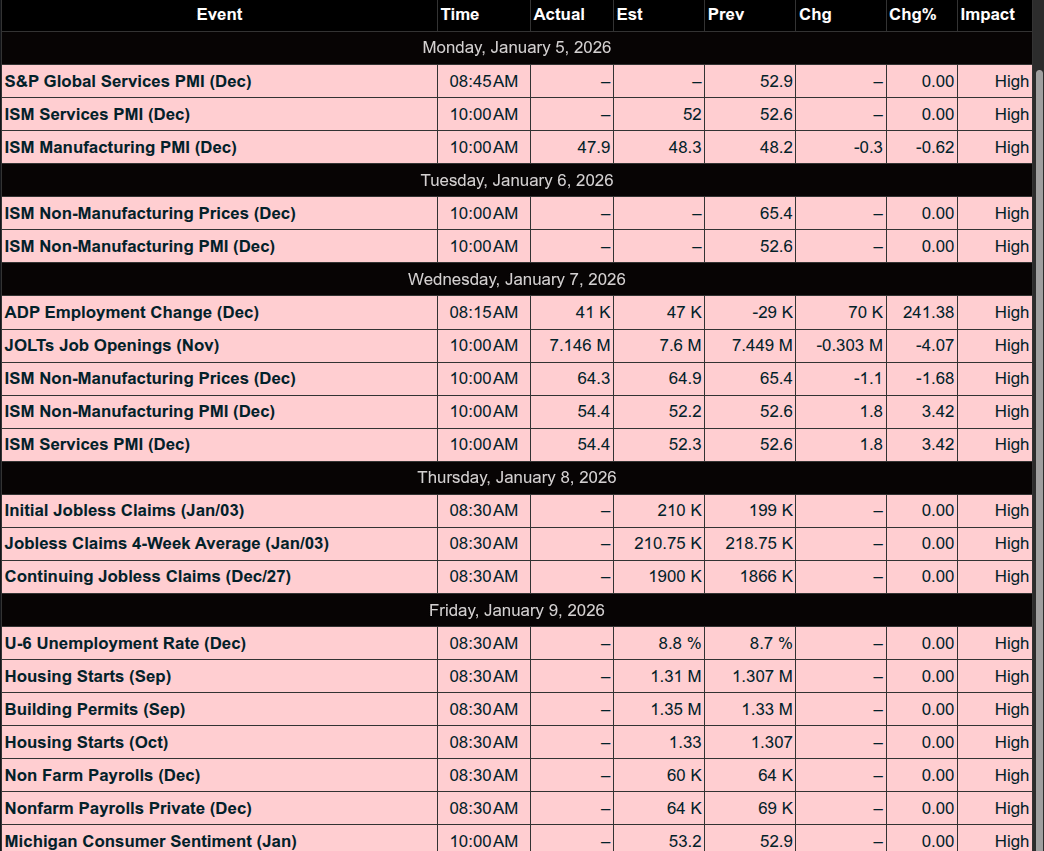
Economic Calendar Today
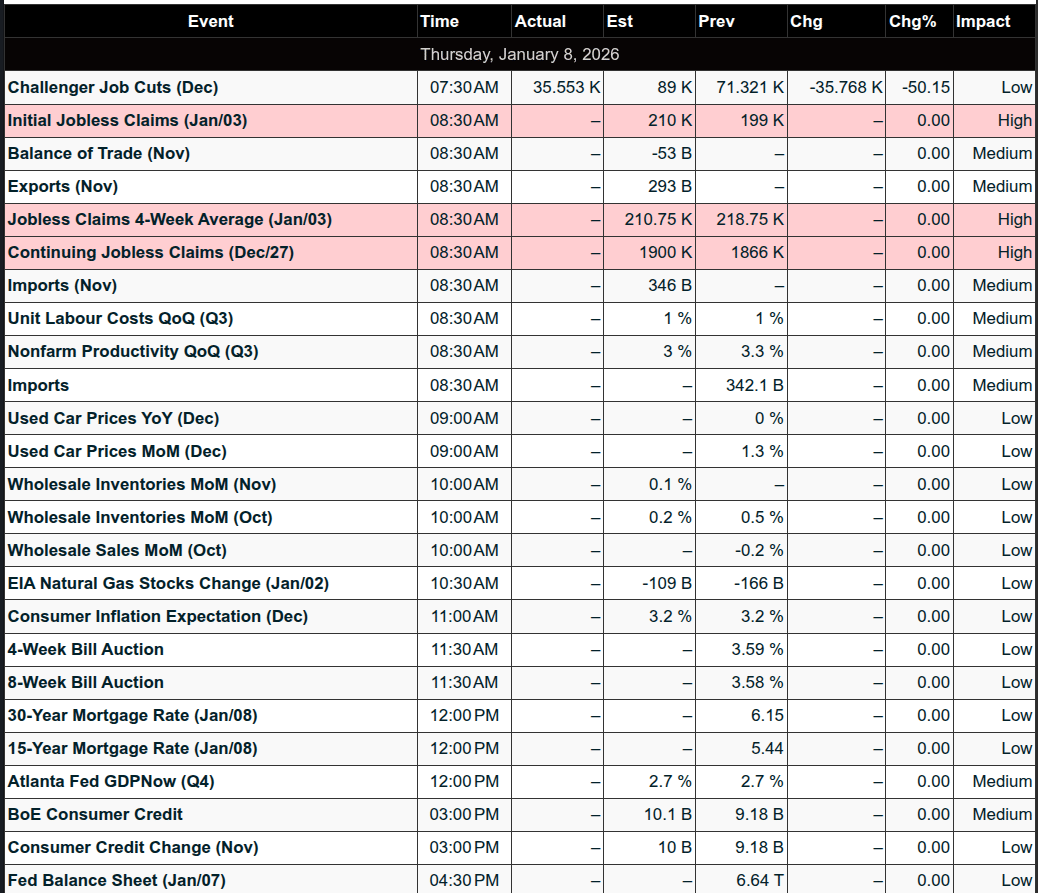
This Week’s High Importance
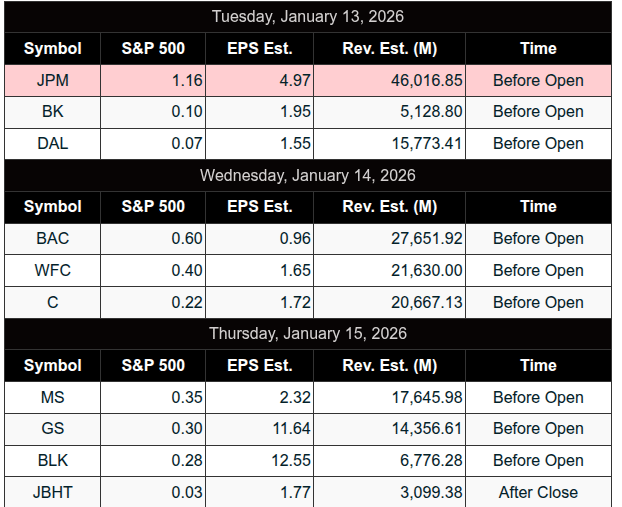
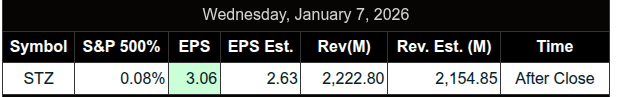
Earnings:
Recent
Trading Room News:
PTG Room Summary – Wednesday, January 7, 2026
The trading day unfolded within the framework of a Cycle Day 2, with PTGDavid noting that rhythms were developing in a typical fashion until a mid-morning disruption occurred.
Positive Trade Highlights
-
Cycle Day 2 structure played out as expected early on, providing traders with solid rhythm-based setups.
-
Afternoon Bearish Breakdown: A key trade opportunity developed late in the day with a decisive break below the 6985 “Line in the Sand”, which triggered downside targets at 6970 → 6965 → 6955, all outlined in the Daily Trade Strategy.
-
PTGDavid emphasized the importance of respecting the pivot and being patient to let price confirm direction—a critical takeaway that reinforced disciplined execution.
-
Notable Events & Lessons Learned
-
Mid-morning spike (around 10:40 AM) caused confusion but was later attributed to geopolitical news: China requesting tech firms halt orders for NVIDIA H200 chips.
-
The event was not tied to economic data, reinforcing the importance of staying plugged into global news flows during trading hours.
-
Member question from PeterN led to a valuable discussion on filtering low-probability trades within the DV strategy—highlighting trader development and the importance of avoiding impulsive entries.
Key Takeaways
-
Discipline around pivot levels and trade edges paid off, especially in the afternoon bearish move.
-
News-driven volatility can emerge unexpectedly; knowing how to react (or not overreact) is part of the professional mindset.
-
Filtering trades based on probability and impulsivity is essential to long-term success—traders were encouraged to continue refining their edge.
Overall, a structured and educational trading day with a well-defined opportunity in the afternoon session and strong lessons in news awareness and trade filtering
DTG Room Preview – Thursday, January 8, 2026
Stocks & Index Action
-
The S&P 500 and Dow hit fresh intraday highs before sliding to lower closes, ending multi‑day strength as markets digest geopolitical and data drivers. Recent sessions showed record highs in major indices on energy/geo shock optimism, but stocks have softened in late trade.
Geopolitical Energy Pressure
-
The U.S. is asserting control over Venezuelan oil production “indefinitely,” including seizing sanctioned tankers. This has lifted energy sector sentiment but also sparked broader market caution.
-
Major U.S. oil companies are cautious; they want “serious guarantees” from Washington before committing to Venezuela investment.
Supreme Court & Policy Risk
-
A key Supreme Court ruling on tariffs is due Friday, with potential implications for trade policy and government revenue foundations.
Data Calendar
-
December jobs report Friday gets extra focus due to recent government data disruptions.
-
Today’s notable releases: Unemployment Claims, Nonfarm Productivity, Unit Labor Costs, Trade Balance, Wholesale Inventories, Consumer Credit.
Volatility & Positioning
-
Market volatility has trended higher in early 2026. Short‑term ranges are expanding, with ES 5‑day average moves growing. Bullish bias into today’s Unemployment Claims persists on thinner overnight flows.
Technical Ranges (ES)
-
Resistance: 7012/09s, 7122/27s, 7542/47s
-
Support: 6870/75s, 6565/60s, 6285/80s
-
The ES remains in a short‑term uptrend channel near key longer‑term range tops.
Commodities Watch
-
Gold & Silver rebalancing flows may trigger significant futures selling as indexes adjust positions; silver could see heavy liquidation if rebalances occur.
Tech & CES Themes
-
CES 2026 headlines continue to highlight AI, advanced chips, robotics across major OEMs. Google is integrating Gemini AI into Google TV; Samsung showcased the Galaxy Z Trifold with AI features, and Nvidia, AMD, Intel, and Qualcomm rolled out next‑gen chips and physical AI platforms. Robotics partnerships (e.g., Hyundai + Boston Dynamics) are gaining traction.
Earnings to Watch Premarket
-
Acuity (AYI), RPM International (RPM), and TD SYNNEX (SNX).
Affiliate Disclosure: This newsletter may contain affiliate links, which means we may earn a commission if you click through and make a purchase. This comes at no additional cost to you and helps us continue providing valuable content. We only recommend products or services we genuinely believe in. Thank you for your support!
Disclaimer: Charts and analysis are for discussion and education purposes only. I am not a financial advisor, do not give financial advice and am not recommending the buying or selling of any security.
Remember: Not all setups will trigger. Not all setups will be profitable. Not all setups should be taken. These are simply the setups that I have put together for years on my own and what I watch as part of my own “game plan” coming into each day. Good luck!
This post goes out as an email to our subscribers every day and is posted for free here around 2 PM ET. To get your real-time copy, sign up for the free or premium version here: Opening Print Subscribe.
Comments are closed