This post goes out as an email to our subscribers every day and is posted for free here around 2 PM ET. To get your real-time copy, sign up for the free or premium version here: Opening Print Subscribe.
Annie, Load the Tape — The ES Ain’t Dead Yet”
Follow @MrTopStep on Twitter and please share if you find our work valuable!
Our View
Annie… get your guns out—the S&P is going to new highs.
After a Trump dump and withering close, the ES rallied 57 points up to 6741.00 on Globex. It traded 6732 in Wednesday’s regular session, popped up to 6742.50, sold off down to 6724.00, and then rallied 42.75 points up to 6766.75 at 10:10 a.m.
After the high, the ES traded back down to 6755.75 at 10:21, made a lower high at the 6764.25 level, and then traded down to the 6740.25 level at 11:21. Then this tape bomb went off:
Tough language from Chinese Commerce Secretary — “China vows corresponding measures to Trump 100% tariffs,” per CNBC.
The ES sold off 105.25 points down to 6651.50 at 1:15. And guess what happened next? The ES rallied, trading up to 6721.50—up 70 points from the low—then sold off down to the 6703 level at 3:48. It traded in the 6709 as the 3:50 cash imbalance showed $1.3 billion to sell, sold off down to 6695.75 at 3:54, and traded up to 6724.50 on the 4:00 cash close. It settled at 6715.00, up 28.50 points or +0.43%. The NQ settled at 24,924.50, up 162 points or +0.65% on the day.
In the end, it was another rough and tumble session.
In terms of the ES’s overall tone, it rallied sharply, pulled back, and then got hit by another round of headline-news algo selling. Sellers got sucked into selling at low prices, and then we got a big buy program—standard fare for what we’ve been seeing since last Friday.
In terms of the ES’s overall trade, volume was pumping all day: 1.67 million traded during the day session, and a total of just under 1.95 million contracts across both sessions.
On Tap
-
Richmond Fed President Tom Barkin (8:00 AM ET)
-
Fed Governor Stephen Miran (9:00 AM ET)
-
Fed Governor Christopher Waller (9:00 AM ET)
-
Fed Governor Michelle Bowman (10:00 AM ET)
-
Richmond Fed President Tom Barkin (12:45 PM ET)
-
Fed Governor Stephen Miran (4:15 PM ET)
-
Richmond Fed President Tom Barkin (4:30 PM ET)
Our View
While all this crazy shit was going on, a ransomware attack disrupted MuniOS.com, a critical platform for distributing municipal bond offering documents in the $4.3 trillion U.S. municipal securities market. The site has been offline for several days, impacting state and local government finance operations and highlighting vulnerabilities in public sector infrastructure.
Meanwhile, the Beige Book mentioned “elevated uncertainty” and growing recession fears among consumers, contributing to market anxiety. U.S. banks borrowed $6.5 billion from the Federal Reserve’s Standing Repo Facility (SRF) on Wednesday, central bank data showed, and repurchase rates rose—suggesting tightness in meeting funding obligations with a large net Treasuries settlement due this week. It was the biggest daily borrowing from the Fed since the COVID-19 pandemic, excluding end-of-quarter periods.
I always say I’ve seen everything, but things are coming unhinged.
These markets take a licking but keep ticking. And the reason for that? This week, Powell openly acknowledged the rising downside risk to unemployment, sending a very dovish signal that the central bank is preparing to ease monetary policy. In his speech to the National Association of Business and Economics, he spoke about the Fed’s balance sheet, but then shifted gears, saying the labor market is weakening faster than previously thought, that inflation is not the only threat, and that policy may finally need to “take another step toward a more neutral stance.” That’s what pushed the Dow from down 600 to up 400 points on the day.
I don’t know if the Fed has the firepower it did during the credit crisis, but this is exactly what Trump wants: lower rates. And that means a higher stock market.
Tidbits from Goldman Sachs
Earnings season kicks off this week, led by major banks
Q2 recap: Consensus +5% YoY; delivered +11%, with 81% beating estimates.
Q3… Takeaways from 100 Years of Data:
-
October ranks among the choppiest months for equities.
-
On average, October 26 marks the Q4 low for the S&P 500.
-
October 27 marks the Q4 low for the Nasdaq 100.
-
Late-October dips typically set up powerful year-end rallies.
-
Strong years heading into Q4 typically have stronger moves into year-end.
All too many times, I’ve seen big rips in late October… that’s why they call October “The Bear Killer.”
Today marks the PEAK blackout window. Blackout typically begins ~2 weeks before quarter-end and ends a day or two after Q3 earnings. August saw strong executions during the open window.
EventVestor:
-
U.S. authorizations have surpassed $1.297T (fastest pace on record) for the Russell 3000; could reach $1.5T by year-end.
-
Assuming a 90% execution rate = $1.35T actual executions (a record).
-
S&P 500 companies have seen $1.064T in authorizations YTD.
Keep an eye on this dynamic after Q3 results.
Buyback math:
-
~$1.35T of VWAP executions over 251 trading days ≈ $5.3B of implied daily buyback demand.
-
Nov–Dec are historically the strongest buyback execution months for U.S. corporations.
-
I expect corporates to fill their authorizations by the end of 2025.
-
Blackout window ends on November 1st.
Our Lean
Look at this: out of the last 10 sessions, the up-a-day / down-a-day pattern only skipped 1 session, on October 10. If you take out the October 11 low at 6540, the range has basically been 6680 to 6750 over the last two weeks.
According to @HandelStats, if the S&P closes lower on the day of the Beige Book, the S&P is up 85% of the time the next day, but that was when the futures were down.
Our lean: I think the pattern is pretty set in stone: rally early, sell off, and rally again. I think we will go higher today, but I also can’t rule out further tape bomb drops.
I know there’s potential for more downside, but over the years, this up-a-day / down-a-day price action is generally bullish / back and fill.
From Stock Trader’s Almanac @AlmanacTrader Jeff Hirsch
After October’s Volatility Peak, Markers Best 3-Month Period Begins
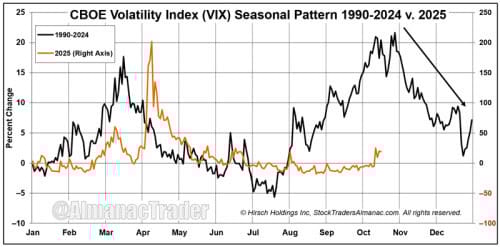
Historically, the CBOE Volatility Index (VIX) tends to reach its seasonal high in the month of October. This may be due to the fact that the two worst-performing months of the year, August and September (by average performance), precede it. And even though August and September were positive this year, VIX began trending higher after hitting a seasonal low in the second half of August. VIX’s seasonal pattern can be seen in the accompanying charts.
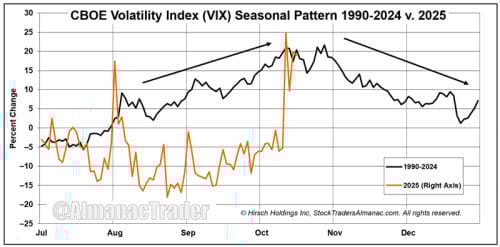
In order to gain a better view of this year versus VIX’s historical trend, we have zoomed in on the second half of the year, allowing 2025, through today’s close (October 15), to be plotted on the same scale. After spiking last Friday, VIX has retreated modestly, but its historical trend suggests there is potential for another jump in volatility before October comes to an end. Afterwards, VIX has generally begun to decline as the Best Consecutive 3-Month Span, November through January, gets underway. S&P 500 has averaged 4.4% since 1950 during the 3-month period, while NASDAQ has produced a 6.2% average gain since 1971.

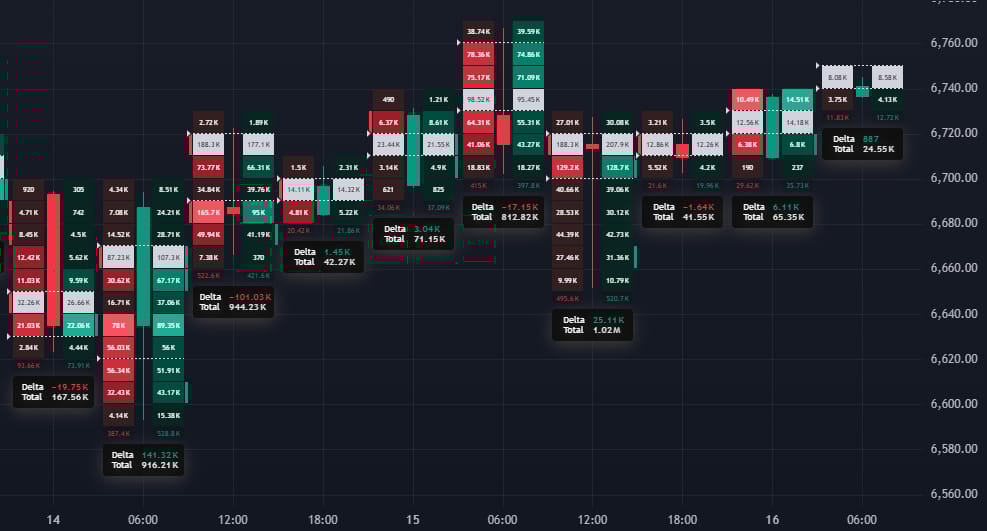
MiM and Daily Recap
Intraday Recap
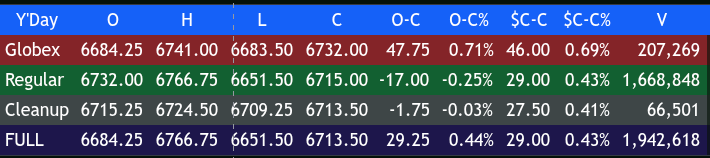
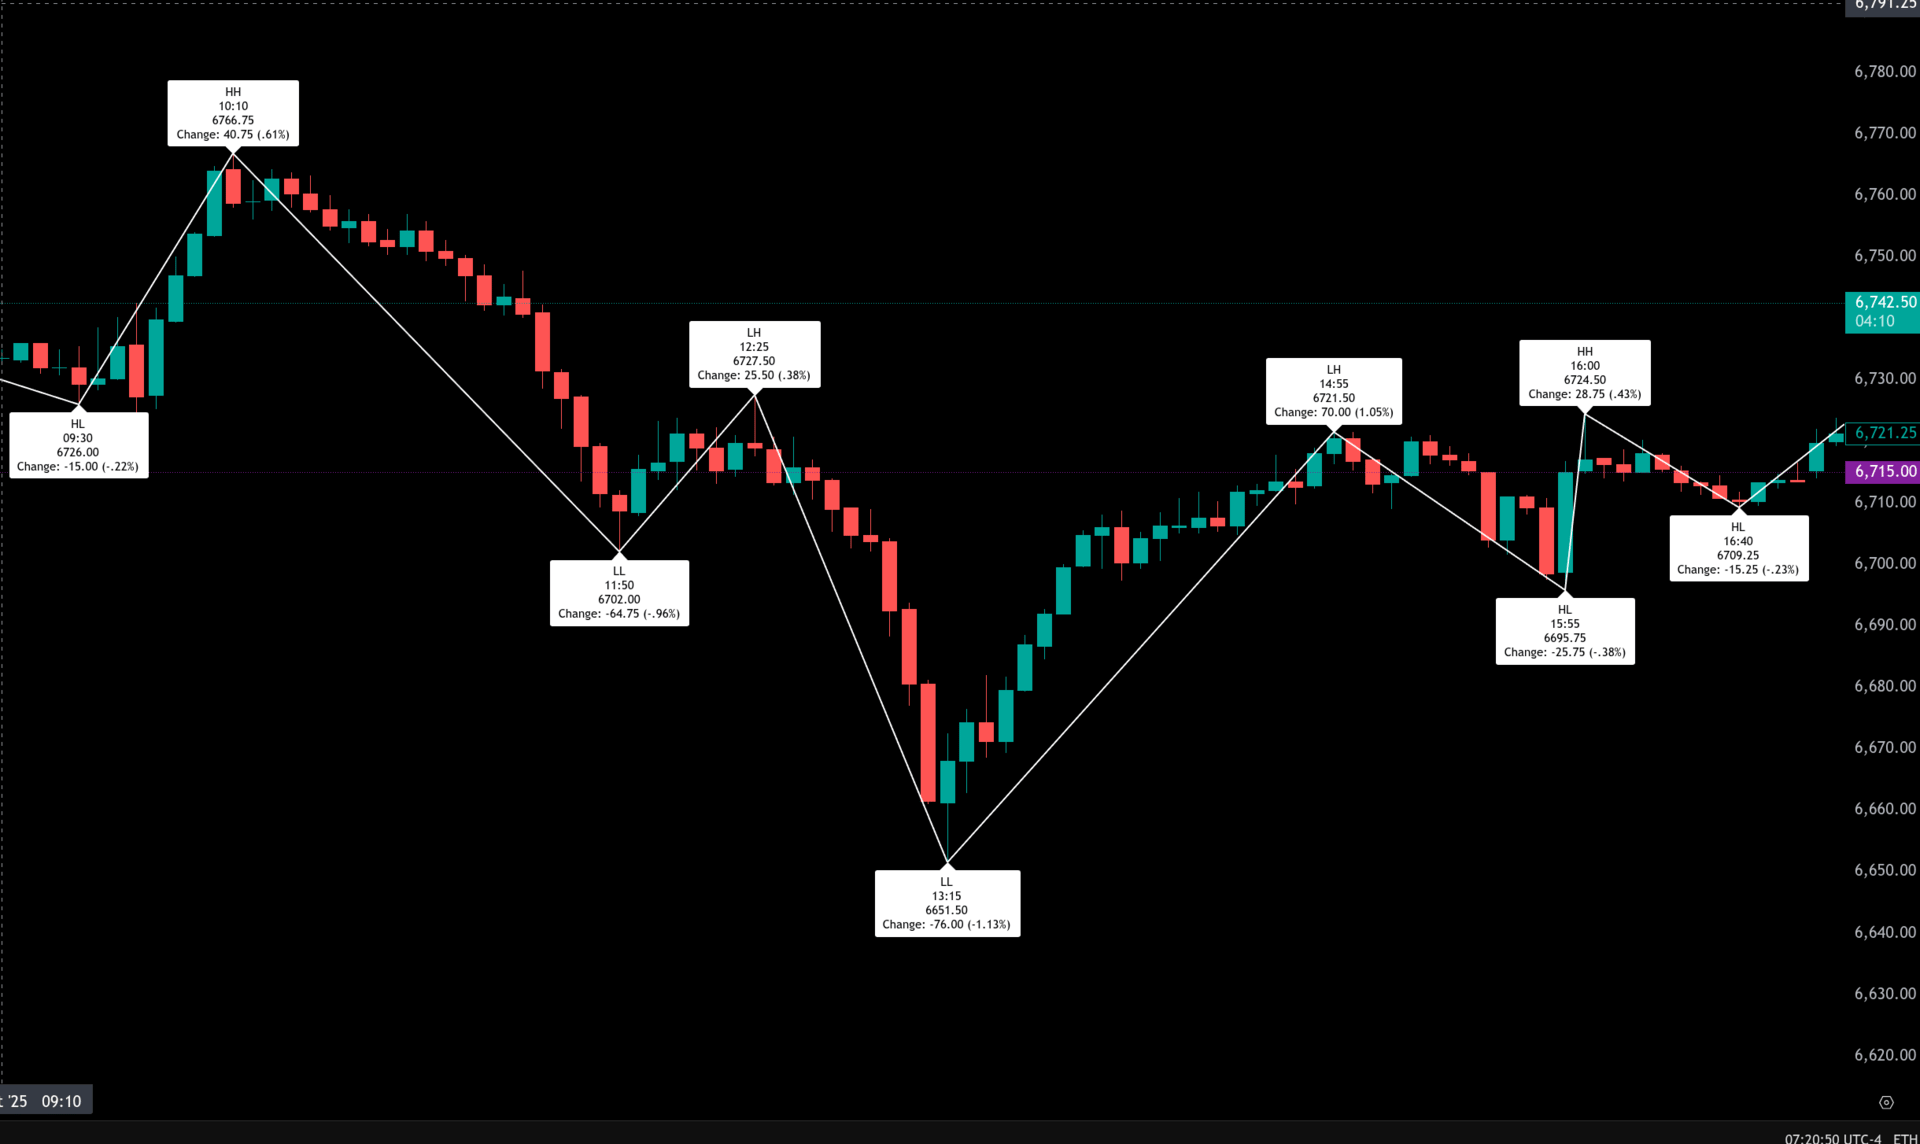
The S&P 500 futures (ESZ25) opened Wednesday’s Globex session at 6684.25 and quickly firmed, lifting to 6699.00 at 19:20 ET before a modest pullback to 6683.50 at 20:10. Buyers regained control into late evening, driving a steady climb to 6705.50 by 22:20, then dropping to 6691.75 at 23:10 before pushing higher again through the early morning hours. The overnight trend remained constructive, and by 08:25 ET the ES printed a Globex high of 6741.00, marking a gain of 56.75 points (+0.85%) from the prior day’s settlement.
The regular session began on a softer tone at 6732.00. Buyers initially pushed the index to 6766.75 at 10:10, marking the session high, before momentum turned lower. A sharp reversal took the ES down to 6702.00 by 11:50, a 64.75-point (-0.96%) drop from the morning high. The midday bounce lifted prices to 6727.50 at 12:25, but that rally failed to hold, leading to another leg down to a new low at 6651.50 by 13:15 — the day’s intraday floor and a full 115.25-point swing from the morning peak.
After the early afternoon washout, buyers mounted a meaningful rebound, propelling ES back to 6721.50 at 14:55. A brief pullback to 6695.75 at 15:15 gave way to another push up to 6724.50 by 16:00, just before the cash close. The ES settled the regular session at 6715.00, down 17.00 points (-0.25%) from the open but up 29.00 points (+0.43%) from the prior day’s close. Total regular session volume reached 1.67M contracts, with full-session volume just under 1.95M.
In the brief cleanup session, the contract traded narrowly between 6709.25 and 6724.50 before finishing at 6713.50. The combined full-session range stretched from 6651.50 to 6766.75 — a 115.25-point span — closing the day higher by 29.25 points or +0.43% from Tuesday’s settlement.
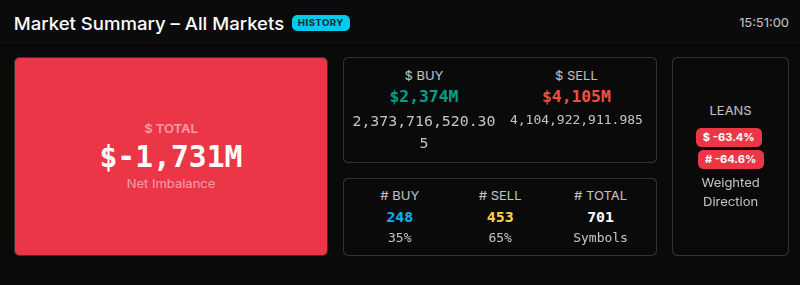
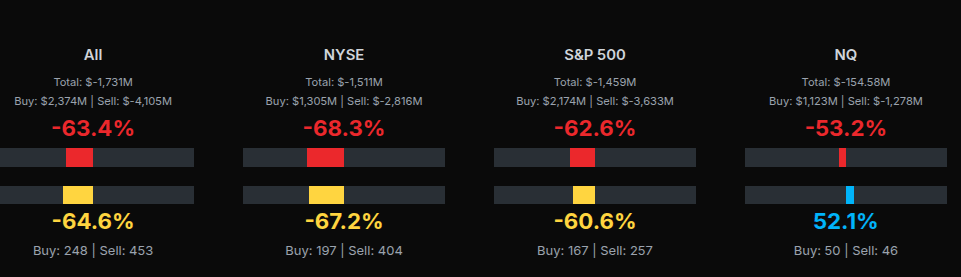
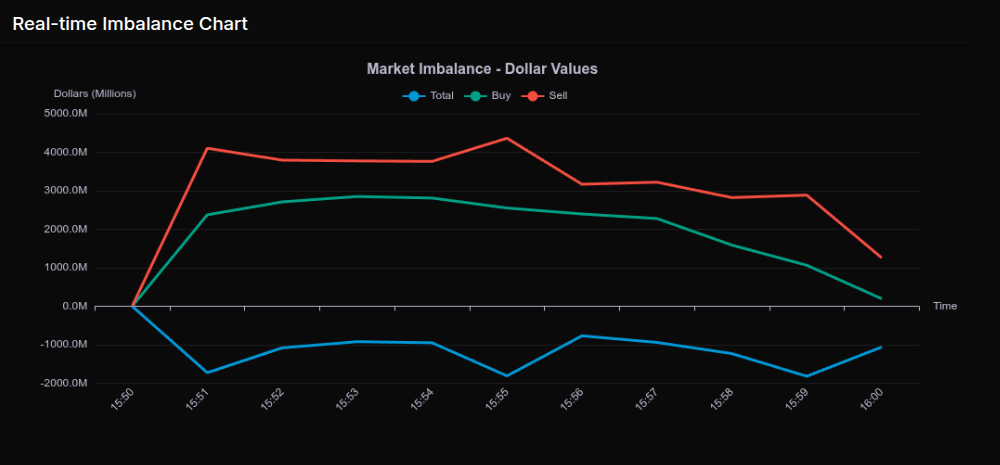
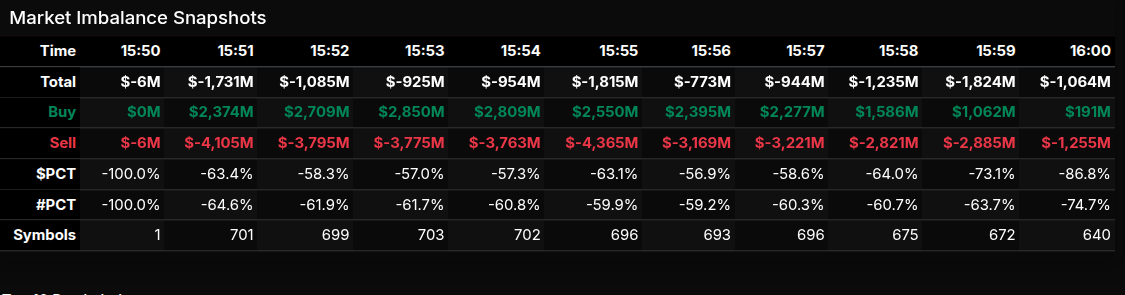
Market tone turned cautious late in the day as the Market-on-Close (MOC) data revealed a significant sell imbalance of $1.73 billion, with 65% of total symbols on the sell side. NYSE and S&P 500 components each showed strong sell leans, registering -68% and -63% respectively, indicating broad-based afternoon selling pressure. The imbalance peaked at 15:51 with $4.1B to sell versus $2.37B to buy, maintaining negative breadth through the close.
Sector flows confirmed the defensive rotation: Utilities and Energy registered modest net buys of +$94M and +$1M respectively, while Technology (-$352M), Healthcare (-$386M), and Financials (-$345M) led the downside. Despite the closing weakness, the ES maintained its week-to-date advance, with buyers stepping into each intraday washout. Overall sentiment leaned mixed-to-bearish into the close, as the strong MOC sell imbalance capped the day’s recovery and hinted at continued volatility ahead. Overnight support holds near 6790–6792.
Guest Posts:
Dan @ GTC Traders
Not Out of the Woods Yet
We don’t view ourselves out of the woods with this market correction quite yet.
As many know, we run an Equity Income Hybrid Core Program as part of the GTC Sample Portfolio. A number of assets, paying a monthly income. It has been doing quite well this year. Though the objective is not the return (being Fixed Income), it’s returns are north of 7% this year, and we have not seen drawdowns worse than -0.77% since inception. Which is outstanding for an equities based program. That is despite the tariff tantrum earlier in the year.
How have the drawdowns been so low?
We hedge off all of the assets by beta weighting the deltas of the assets we hold for income, and short the S&P during downturns.
With the recent market volatility? We don’t consider ourselves out of the woods just yet.
We’ll be looking to a very simple market structure on the active ES contract ( or associated other S&P 500 derivatives )…
The October 14th lows. If we see those lows being taken out with some conviction?
It’s quite a simple matter. We then just beta-weight the deltas to the S&P 500 (most trading platforms will do all the math automatically for you nowadays) for the assets held in the Equity Fixed Income Portfolio? And begin with a 50% hedge to those assets.
Again … until we make new highs? We don’t view ourselves as out of the woods yet, and we are keeping a strict eye with alerts set on those October 14th lows.
Until next time, stay safe … and trade well …
Technical Edge
Fair Values for October 16, 2025
-
S&P: 39.65
-
NQ: 168.53
-
Dow: 203.47
Daily Breadth Data 📊
For Wednesday, October 15, 2025
-
NYSE Breadth: 56.5% Upside Volume
-
Nasdaq Breadth: 62.7% Upside Volume
-
Total Breadth: 62.1% Upside Volume
-
NYSE Advance/Decline: 61.3% Advance
-
Nasdaq Advance/Decline: 59.4% Advance
-
Total Advance/Decline: 60.1% Advance
-
NYSE New Highs/New Lows: 137 / 24
-
Nasdaq New Highs/New Lows: 314 / 58
-
NYSE TRIN: 1.09
-
Nasdaq TRIN: 0.86
Weekly Breadth Data 📈
For the Week Ending Friday, October 10, 2025
-
NYSE Breadth: 37.4% Upside Volume
-
Nasdaq Breadth: 52.1% Upside Volume
-
Total Breadth: 47.1% Upside Volume
-
NYSE Advance/Decline: 19.3% Advance
-
Nasdaq Advance/Decline: 30.4% Advance
-
Total Advance/Decline: 26.3% Advance
-
NYSE New Highs/New Lows: 313 / 149
-
Nasdaq New Highs/New Lows: 814 / 274
-
NYSE TRIN: 0.39
-
Nasdaq TRIN: 0.39
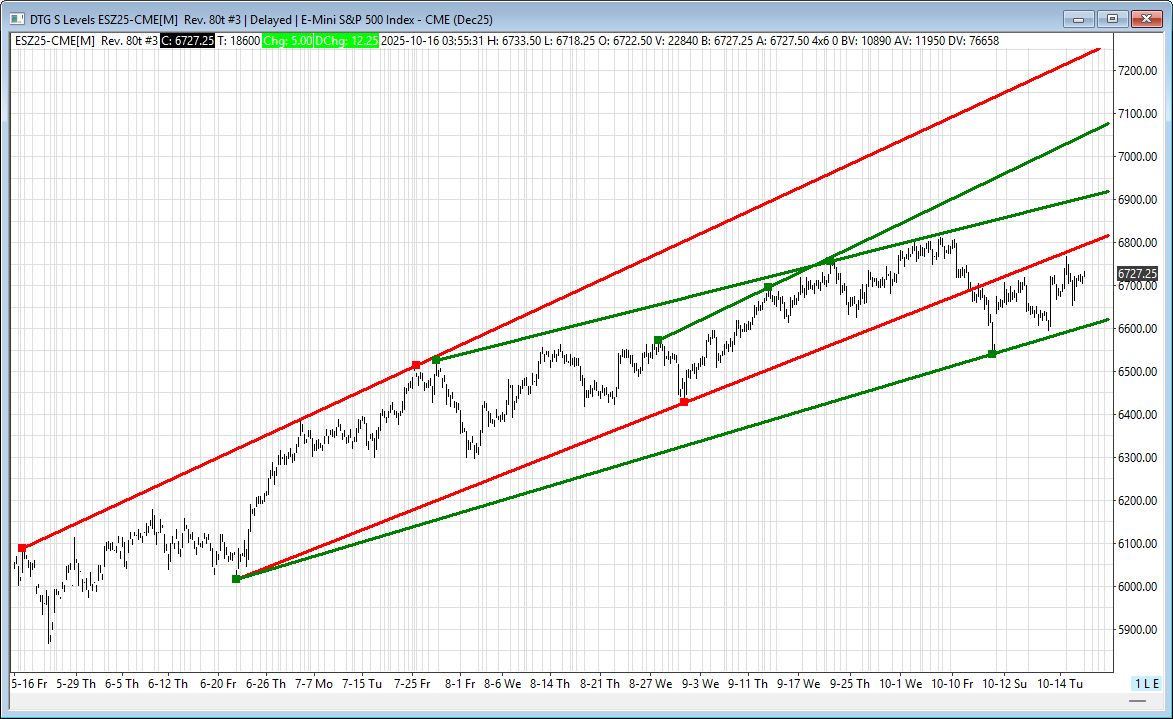
BTS Levels:
ESZ2025
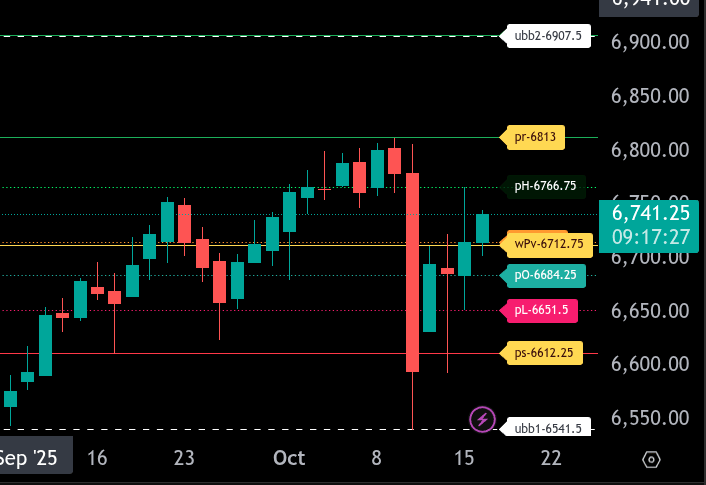
The bull/bear line for the ES is at 6712.75. This level represents the key pivot for today and determines whether the bias favors buyers or sellers. Trading above this mark indicates a potential continuation higher, while holding below suggests further downside pressure.
ES is currently trading around 6741.75, showing strength above the bull/bear line. If buyers can sustain momentum above this level, the next upside target is 6813, which aligns with the upper range target. Beyond that, resistance stands near 6907.50, which would represent a significant upside extension.
On the downside, initial support sits at 6684.25 (previous open), followed by 6651.50 (previous low). The lower range target for today is 6612.25. A break below that level could open the door toward 6541.50 and deeper downside at 6517.75, where buyers may attempt to defend.
Overall, the near-term tone is constructive while ES holds above 6712.75, but a failure back below that pivot would likely trigger a retest of support levels. Expect volatility to remain elevated given the recent wide intraday ranges.
NQZU2025
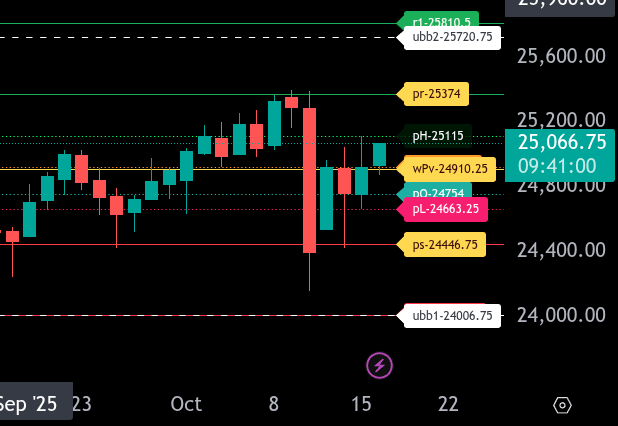
The bull/bear line for the NQ is at 24,910.25. This is the key pivot for today’s session. Trading above this level favors bullish continuation, while sustained trade below suggests weakness could return.
Currently, NQ is trading near 25,068.50, showing early strength above the bull/bear line. If buyers can maintain control above 24,910.25, upside targets are 25,374.00, which is today’s upper range target, and 25,810.50.
On the downside, if NQ fails to hold above the bull/bear line, first support appears at 24,754.00, followed by 24,663.25. The lower range target at 24,446.75 is the key support level to watch — a break below this could accelerate selling pressure toward 24,006.75.
Overall, the near-term bias remains cautiously bullish while holding above 24,910.25, but traders should be ready for volatility around this pivot as the market digests recent moves.
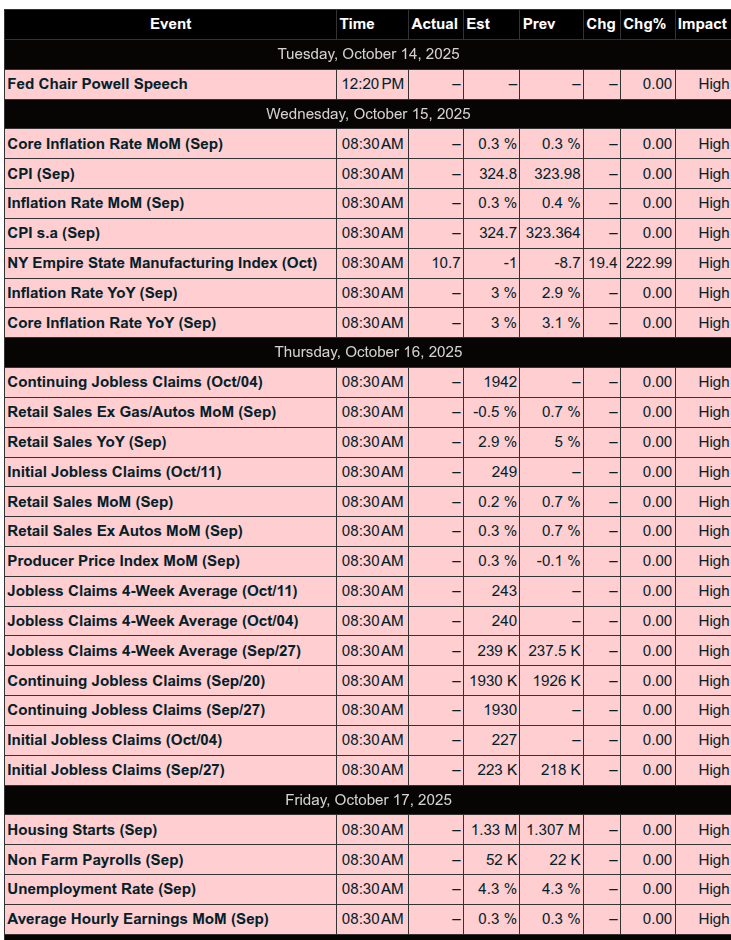
Calendars
Economic Calendar Today
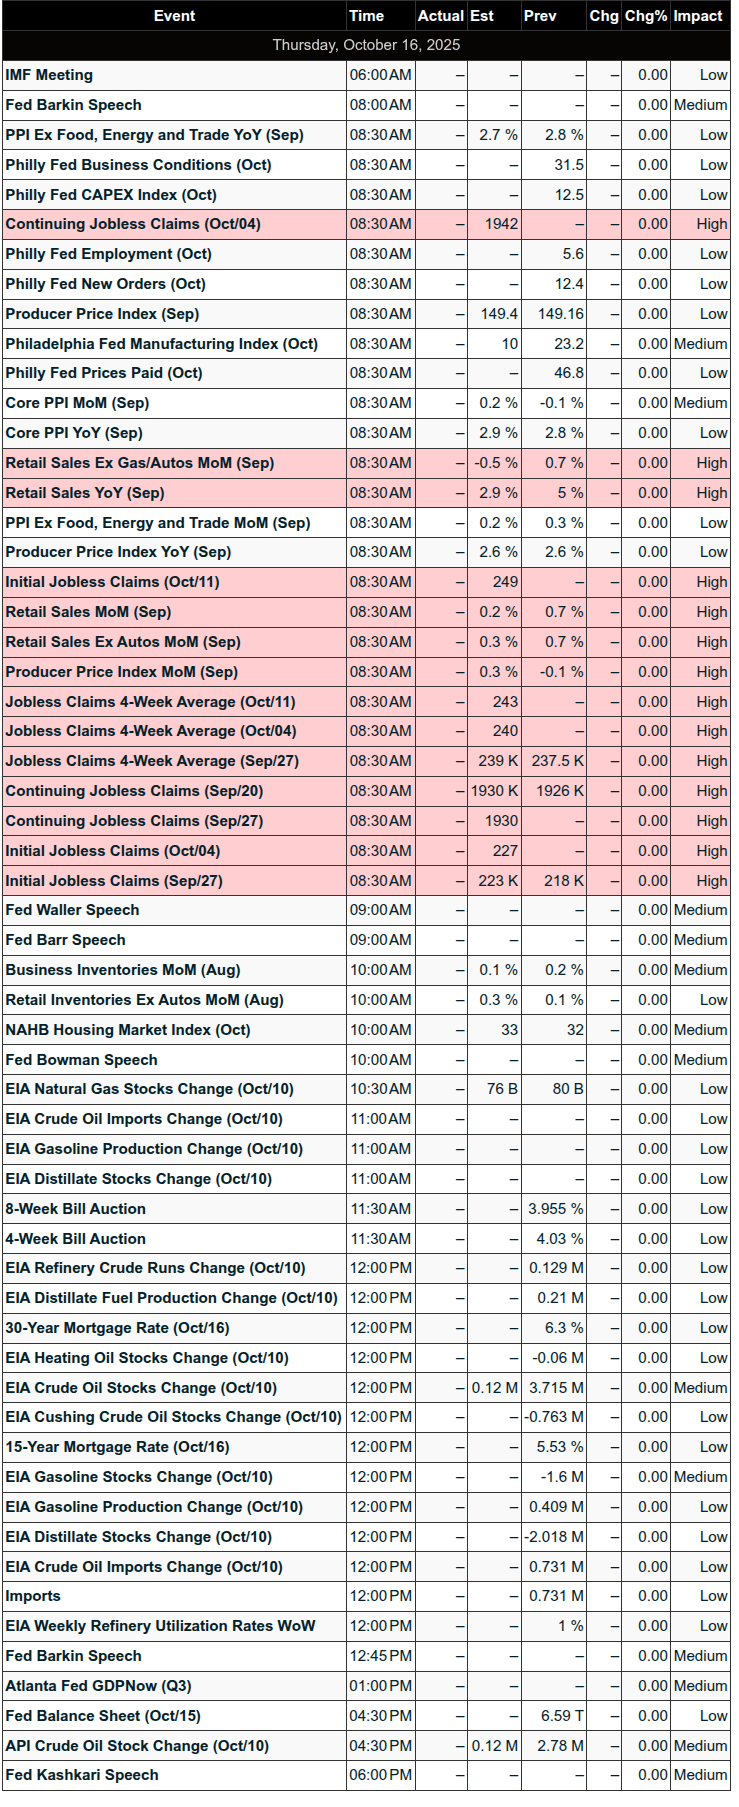
This Week’s High Importance
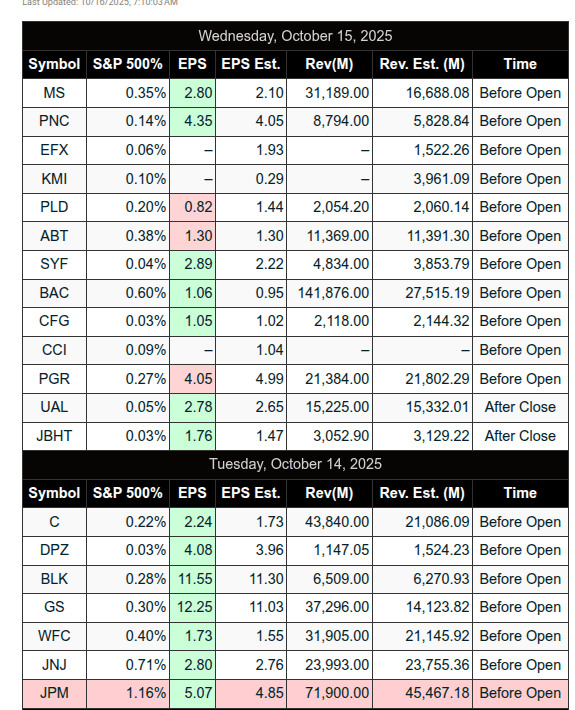
Earnings:
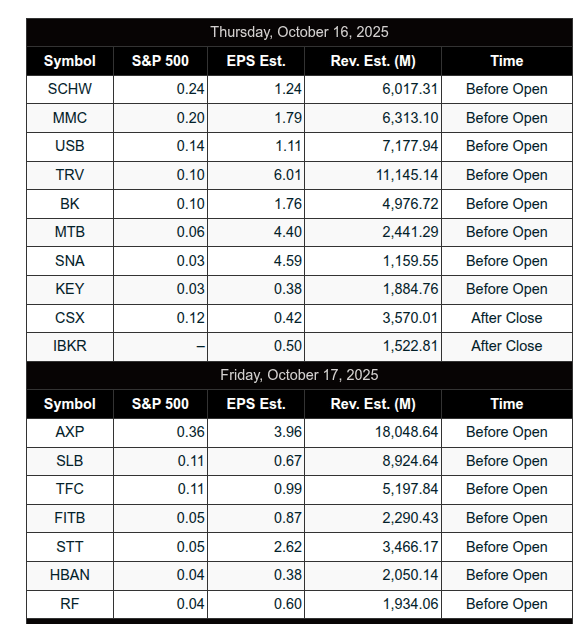
Released
Trading Room News:
Polaris Trading Group Summary: Wednesday, October 15, 2025
Yesterday’s session in the PTG Trading Room, led by PTGDavid, featured a strong mix of technical strategy execution, textbook pattern recognition, and some impressive trade calls — particularly around the CD1 / S3H cycle pattern and the Money Box reversals. Traders displayed strong discipline and adaptability in what was a volatile, opportunity-rich environment.
Market Themes & Structure
-
Opening Tone:
-
The day started with prep links and risk reminders. Manny and others laid out early fade setups near the lower balance zone (ES 6741–6745), with confluence from SPX levels.
-
Early emphasis was on observing for rejection and confirmation through delta shift and volume.
-
-
Cycle Day & Timing Guide (S3H/CD1):
-
Manny called out the S3H/CD1 pattern early — characterized by an early rally that fades.
-
The clock played out near-perfectly, with price respecting expected time pivots.
-
-
A10 Long Setup:
-
PTGDavid initiated a long lean early, calling attention to the PH 22.50 level as key.
-
The A10 long triggered around 9:58 AM with excellent scaling opportunity — Bruce F confirmed all targets hit on the OR move.
-
Some missed this due to conflicting signals or hesitation, a lesson in trusting the system setups.
-
-
Powerful Mid-Morning Reversal:
-
From 10:55 AM, the CD1/S3H pattern showed its teeth: early strength faded hard into the Money Box reversal zone, which David nailed precisely.
-
Crude oil targets were also fully fulfilled mid-morning.
-
-
Manny’s Execution Masterclass:
-
Though he missed the A10, Manny adapted brilliantly, shorting S6752s based on structure and CD1 insights.
-
His cover near ES 6724 was spot-on, earning praise and leading to one of his best intraday trades ever.
-
He emphasized probing with micros — a valuable lesson for newer traders learning how to get in without full conviction initially.
-
-
Late-Day Action:
-
Afternoon session showed balanced action around VWAP, with some traders calling for rip setups after dips.
-
PTGDavid noted a $1.7B MOC sell imbalance, which led to a last-minute “FU setup” into the close — catching many off-guard.
-
The day ended with a classic PTG mix of humor and insight (“Smash n Grab”, “grab and got smashed”).
-
Key Positive Trades & Wins
-
A10 Long around 6724: Multiple traders confirmed hitting all targets on this clean setup.
-
Money Box Reversal: David’s textbook reversal call aligned with the CD1 pattern — great structure-based trade.
-
Manny’s S6752 Short to 6724: A lesson in patience and pattern trust. Excellent management and a new personal best.
-
Crude Oil Shorts: Full target hit on the short side, as called out by David.
Lessons & Takeaways
-
Pattern Recognition: Trust in well-established cycle patterns like CD1/S3H paid off today. Knowing the likely rhythm helped with trade selection and patience.
-
Stay Flexible: Manny highlighted the importance of shedding bias (“I almost didn’t short”) in a market that demanded adaptability.
-
Micros for Probing: A valuable technique shared was starting with micros to build conviction before scaling — lowers risk while sharpening the read.
-
Clock Awareness: Intraday timing windows were respected remarkably well — another tool to reinforce or hold back trade conviction.
-
Profit Perspective: Manny’s analogy comparing a trade win to an Uber driver’s effort reframed trade results in a helpful way, especially for newer traders.
Final Notes
-
The session reflected top-tier trade planning, clear communication, and a great mix of technical precision and camaraderie.
-
Despite a few missed entries or trades that didn’t follow through, the room stayed focused, positive, and aligned with the broader strategy.
-
As PTGDavid noted, volatility remains elevated — and that’s exactly the type of environment where PTG strategies thrive.
DTG Room Preview – Thursday, October 16, 2025
Affiliate Disclosure: This newsletter may contain affiliate links, which means we may earn a commission if you click through and make a purchase. This comes at no additional cost to you and helps us continue providing valuable content. We only recommend products or services we genuinely believe in. Thank you for your support!
Disclaimer: Charts and analysis are for discussion and education purposes only. I am not a financial advisor, do not give financial advice and am not recommending the buying or selling of any security.
Remember: Not all setups will trigger. Not all setups will be profitable. Not all setups should be taken. These are simply the setups that I have put together for years on my own and what I watch as part of my own “game plan” coming into each day. Good luck!
This post goes out as an email to our subscribers every day and is posted for free here around 2 PM ET. To get your real-time copy, sign up for the free or premium version here: Opening Print Subscribe.
Comments are closed