This post goes out as an email to our subscribers every day and is posted for free here around 2 PM ET. To get your real-time copy, sign up for the free or premium version here: Opening Print Subscribe.
Beware the Tape Bombs: When Politics Hijack the Print
Follow @MrTopStep on Twitter and please share if you find our work valuable!
Our View
Well before the ES opened, the headline hit saying:
tbohn007: (8:55:39 AM): China’s Xi, Trump hold call – Chinese State Media 8:49 Jun 05
But the ES didn’t react immediately. Sometimes, bullish news is released before the 9:30 futures open and the markets do not react—and that was the case yesterday. It’s 10:43 pm and the ES has an 7-point trading range, it’s dead.
After opening at 5995.00, the ES crept its way down to the 5957.50 level, then rallied back up to the 5975 area, and dropped again to a higher low around 5960.
Generally, with all the traders in the MrTopStep chat and LiveSquawk London pumping out the news, we get things quickly, but there was nothing hitting the tape about the Trump/Xi call.
At 11:10, the ES traded up to 5997.75. I got long at:
IMPRO: Dboy: (10:24:10 AM): paid 5974.5 on 1 ES
IMPRO: Dboy: (10:29:01 AM): 5959.75 stp
IMPRO: Dboy: (10:47:18 AM): offering 1 ES at 6020
I have to admit, I thought Trump was full of it about the Xi call, but when the ES sold off and fell into a slow walk off the lows, I figured I had to try some longs. I posted this in the chat:
IMPRO: Dboy: (11:14:29 AM): lots-o-stops above here
And sure enough, the ES popped into the stops a few minutes later, traded up to a new high at 6004.75 at 11:22, and then rallied all the way up to 6009.00. I thought it was going higher, but when the futures started going offered, I got out at 5999.00.
While there was a delayed reaction to the conversation Trump and Xi had, the buy programs did eventually kick in.
As always, Trump likes to butter things up. He posted on Truth Social that the call with Xi ended with a “very positive conclusion” and that Treasury Secretary Scott Bessent, U.S. Trade Representative Jamieson Greer, and Commerce Secretary Howard Lutnick would hold a follow-up meeting with their Chinese counterparts.
That was part 2 of the trading session. Part 3 included President Trump’s attacks on Elon Musk.
Trump responded to Musk’s mockery of the $3 trillion budget with a series of posts on Truth Social, threatening to terminate Musk’s governmental subsidies and contracts. He called Musk “wearing thin” and claimed he “went CRAZY” over budget changes. Musk responded on X:
“Such an obvious lie. So sad.”
Musk also said SpaceX would begin decommissioning its Dragon spacecraft immediately, which could impact NASA’s operations. The ES sold off down to 5928.75, and $TSLA’s stock fell sharply. From 11:45, $TSLA’s high was $328.80 before selling off to $273.00 and settling at $284.68, down -14.27% on the day. Trump put the hammer on Musk.
Everything Is Moving
The 10-year note yield rose 0.028% to 4.392%, gold fell 0.55%, and oil rose $0.25% to $65.34 a barrel. Bitcoin closed down 3.1%, and silver traded above $36.00 per ounce—up 10.19% over the last 90 days, up 14.8% over the last six months, and up a whopping 19.95% over the past year (from June 5, 2024, to June 5, 2025).
Has anyone been looking at Berkshire Hathaway Class B shares? They closed at $488.74 on June 5, down 0.46%, following portfolio adjustments (selling Citigroup, increasing Constellation Brands stake). On June 3, 2025, UBS analyst Brian Meredith—a top five-star rated analyst with an 80% success rate—lowered the 12-month price target for BRK.B from $606 to $591, citing “modestly lower EPS estimates” due to a lower investment income forecast.
Was Berkshire Hathaway part of the weakness? I think it was. Total ES volume was 1.097 million on Wednesday, and Thursday’s volume jumped to 1.519 million—a 38.50% increase. What’s it all mean? Berkshire tends to be a bellwether stock.
Our Lean
I was right about another day of narrow chop—until they sold off 80.25 points from the 5909.00 high. It ended up exactly like I said in the MrTopStep chat:
IMPRO: Dboy: (9:33:25 AM): BEWARE THE TAPE BOMBS
Like I’ve always said, no one knows what the ES is going to do next. One minute Trump’s cheering the Xi phone call and the S&P is making new highs, then he’s dogging Musk and the ES and NQ drop hard. Like the PitBull said, don’t bite the hand that feeds you.
The consensus for the May jobs report is 126,000 jobs added, with the unemployment rate unchanged at 4.2%. In April, there were 177,000 jobs added, also at 4.2%. Bank of America is forecasting 150,000 NFP, and Goldman Sachs’ estimate for the May jobs report is approximately 110,000 as indicated by recent X posts from credible sources. This reflects a lowered forecast, likely influenced by recent weak economic indicators.
Our lean: If the ES gaps lower, I’m buying the open or the first dip below the gap down. Sometimes these are “hold all day” trades—but not with the threat of more Trump tariff headlines. I think it could be a “take the money and run” trade.
If the ES gaps higher, I would lean into the early strength and buy the dips for the first part of the day.
In addition, Goldman Sachs estimates around 110,000 jobs for the May 2025 report—below the market consensus of 126,000. We also have Week One June options expiration, which has oversized call open interest.
MiM and Daily Recap
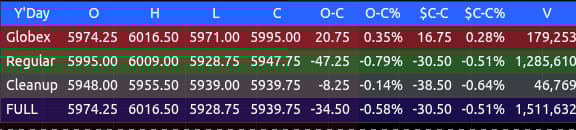
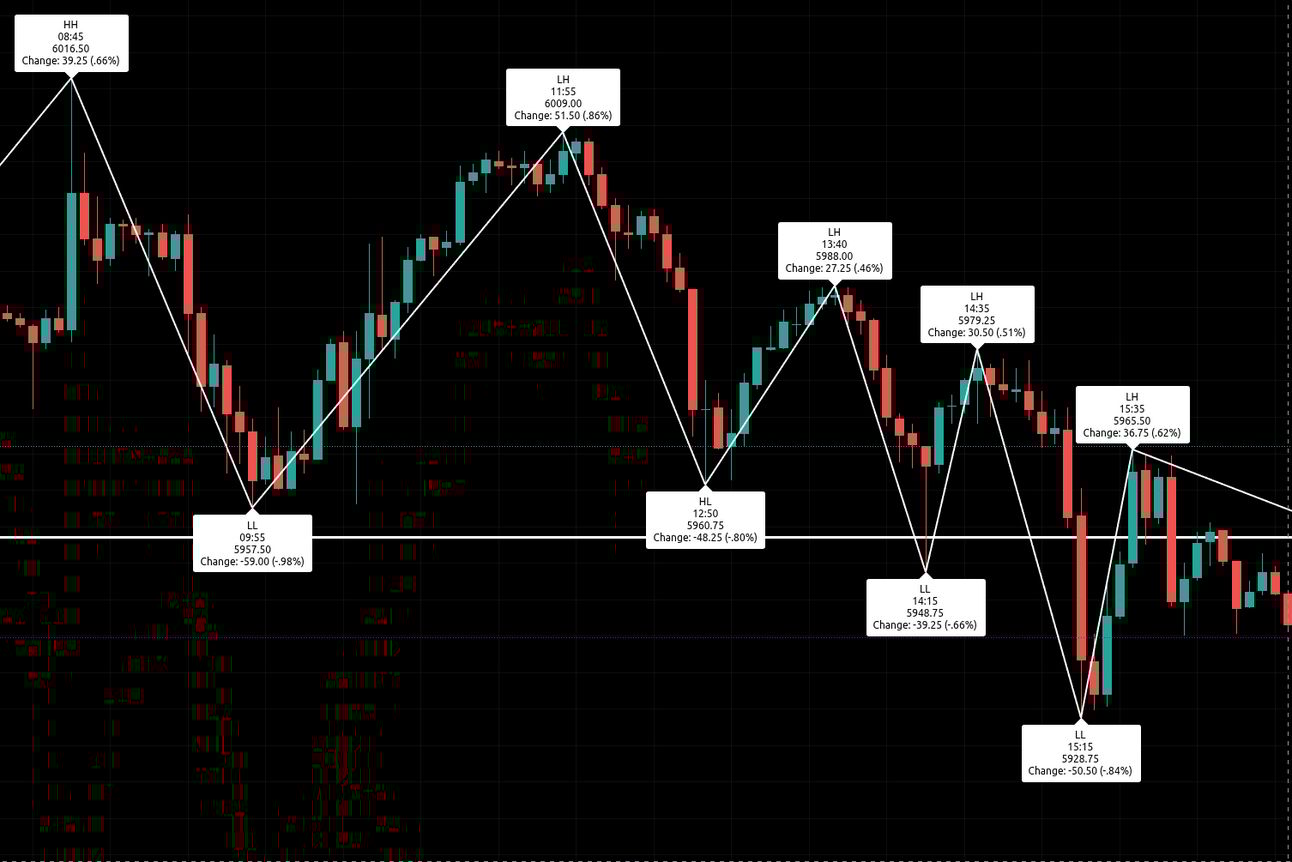
The ES futures session on June 5 opened on a firm note during the Globex session, rallying from 5974.25 to a high of 6016.50 by 8:45 AM ET. This 42.25-point premarket climb (+0.71%) set the stage for the regular session as premarket we sold off to 5995 for the open and dropped sharply to 5957.50 by 9:55 AM, a 59-point retracement (-0.98%) from the Globex high.
Bulls mounted a recovery after the morning low, driving ES back to 6009.00 by 11:55 AM, reclaiming 51.50 points (+0.86%). But this lower high relative to the Globex top marked a potential inflection. A renewed wave of selling emerged, pushing price down to 5960.75 by 12:50 PM, for a 48.25-point decline (-0.80%).
Buyers made another attempt during early afternoon trade, lifting ES to 5988.00 by 1:40 PM, a modest 27.25-point bounce (+0.46%). Yet this recovery proved short-lived. Sellers struck again, and by 2:15 PM, ES printed a lower low at 5948.75, down 39.25 points (-0.66%) from the prior swing high.
The 2:15 PM low brought in temporary support, allowing a rebound to 5979.25 by 2:35 PM, gaining 30.50 points (+0.51%). But the overall tone remained heavy, and another push lower followed. A final rally attempt into 3:35 PM topped out at 5965.50, up 36.75 points (+0.62%), before the market rolled over for the last time.
Into the closing hour, ES tumbled again, tagging a session low of 5928.75 at 3:55 PM, a 50.50-point loss (-0.84%) from the previous high. The market closed the regular session at 5947.75, down 47.25 points from the open (-0.79%) and 30.50 points below the prior day’s cash close, a -0.51% daily loss. Including the cleanup session, ES finished at 5939.75.
Market Tone & Notable Factors
June 5 delivered a distinctly bearish tone during the regular session, with price failing to hold any bounce and carving out a series of lower highs and lower lows. While Globex added 20.75 points (+0.35%), the regular session gave up more than twice that amount, shedding 47.25 points (-0.79%).
The intraday structure reflected clear seller dominance, particularly after the 11:55 AM high failed to take out the overnight peak. Volume was healthy, with over 1.28 million contracts traded during regular hours and total session volume nearing 1.5 million.
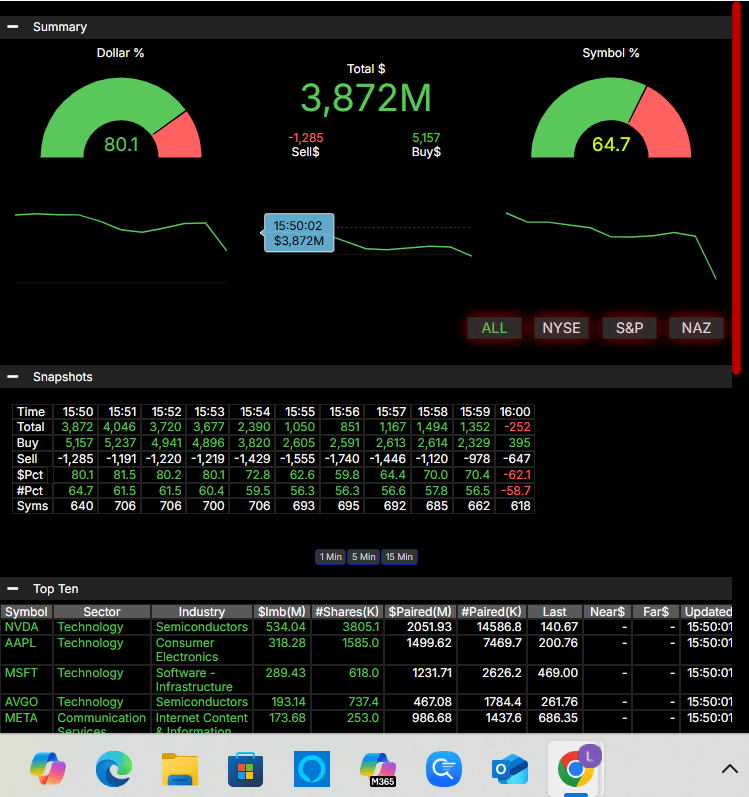
The Market-on-Close imbalance was substantial, totaling $3.872B with 80.1% of dollar flow on the buy side. However, the symbol imbalance came in at 64.7%, just under the 66% threshold. While the notional skew pointed to a heavy buy-side interest, it lacked the breadth in names to force a major late-day reversal. As a result, the closing print stayed near session lows.
Despite bullish flows late, sellers held firm, and the final outcome marked a down day with lower closes across all sessions. Attention now turns to whether support near 5928 holds in the next session or if the lower high trend continues to exert downward pressure.
Technical Edge
Fair Values for June 6, 2025
-
SP: 8.24
-
NQ: 34.98
-
Dow: 53.45
Daily Breadth Data 📊
For Thursday, June 5, 2025
-
NYSE Breadth: 45.8% Upside Volume
-
Nasdaq Breadth: 36.7% Upside Volume
-
Total Breadth: 37.7% Upside Volume
-
NYSE Advance/Decline: 50.0% Advance
-
Nasdaq Advance/Decline: 41.6% Advance
-
Total Advance/Decline: 44.8% Advance
-
NYSE New Highs/New Lows: 76 / 16
-
Nasdaq New Highs/New Lows: 167 / 55
-
NYSE TRIN: 1.12
-
Nasdaq TRIN: 1.21
Weekly Breadth Data 📈
Week Ending Friday, May 30, 2025
-
NYSE Breadth: 54.2% Upside Volume
-
Nasdaq Breadth: 58.9% Upside Volume
-
Total Breadth: 57.2% Upside Volume
-
NYSE Advance/Decline: 68.2% Advance
-
Nasdaq Advance/Decline: 59.9% Advance
-
Total Advance/Decline: 63.0% Advance
-
NYSE New Highs/New Lows: 153 / 59
-
Nasdaq New Highs/New Lows: 278 / 204
-
NYSE TRIN: 1.73
-
Nasdaq TRIN: 1.02
Guest Posts:
Get instant access to our partners’ real-time market data and insights not available anywhere else. Here is last night’s Founder’s note getting you ready for today’s market and explaining the constraints in yesterday’s market. – MrTopStep
Founder’s Note:
Futures have shifted 30bps higher after the TSLA spasm & ahead of 8:30AM ET NFP.
The 0DTE straddle is $48/80bps/31%IV (ref 5,960) which is elevated vs very recent data points which had the straddle in the 60-70bps range. Given not only NFP, but yesterday’s TSLA-induced selling, this pricing seems fair.
S&P key levels remain unchanged from recent days: The support pivot is at 5,900 – we remain bullish above and bearish below. Upside resistance is at 5,975 & 6,000. Below 5,900 we see higher volatility, and look for a test of 5,850 – 5,800.
We always work from the assumption that data points will be benign, and if so that leads to contraction in vol. Should that be the case with NFP, we’d look for the SPX to test that 5,975-6,000 range that has marked the interim highs this week.
Now, turning to TSLA:
As we said in our pre-close note yesterday afternoon – we felt like the TSLA selling was a flows-based over-reaction resulting in a 14.2% decline & $152bn in market cap. That 14% plunge was responsible for 25bps of yesterdays 53bps SPX decline. This reminded us a lot of the -17% NVDA DeepSeek spasm – granted that 1/27/25 plunge was a $550bn market cap loss.
A massive amount of the options flow in TSLA is essentially 0DTE day-trading – often >60% of volume is just opened and closed on the same day. Additionally, there are dozens of various Index & ETF’s (from SPY/QQQ to 3x levered, etc) tied to TSLA which spool up when the stock starts to jump. Yesterday say the largest TSLA put volume (4mm contracts) since early ’20, with call volumes large at 3.3mm (At ~7.3mm it was a ~top 10 total options volume day).
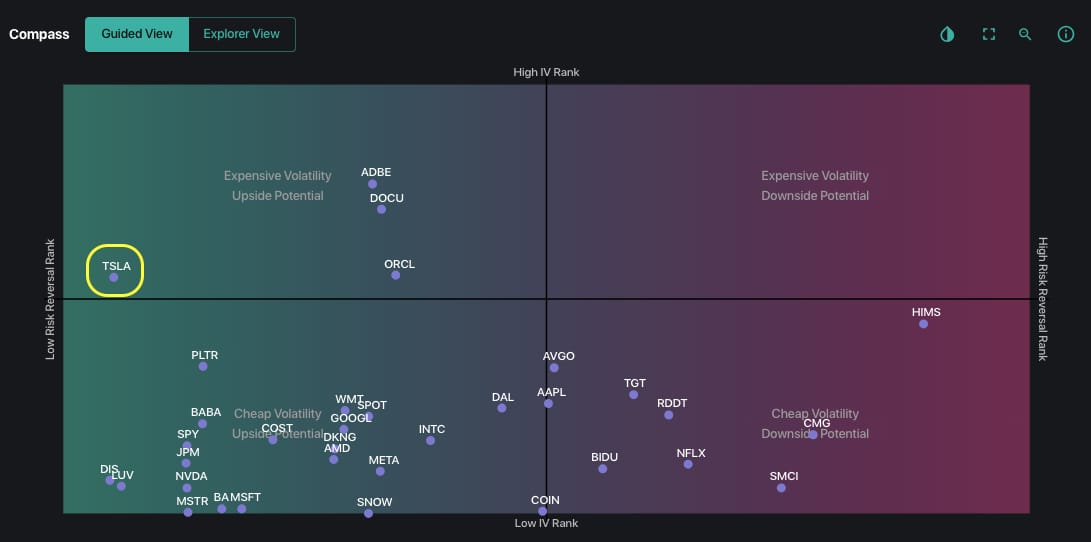
The two key charts are these:
First overall risk reversal rank (call IV – put IV) is quite extreme – approaching that of the April market lows. Overall IV Rank (where yesterdays IV was relative to the high & low of the last year) remains just a bit above average – TSLA has obviously had some insanely volatile periods not only in April, but back to the post-election period (Nov/Dec ’24).
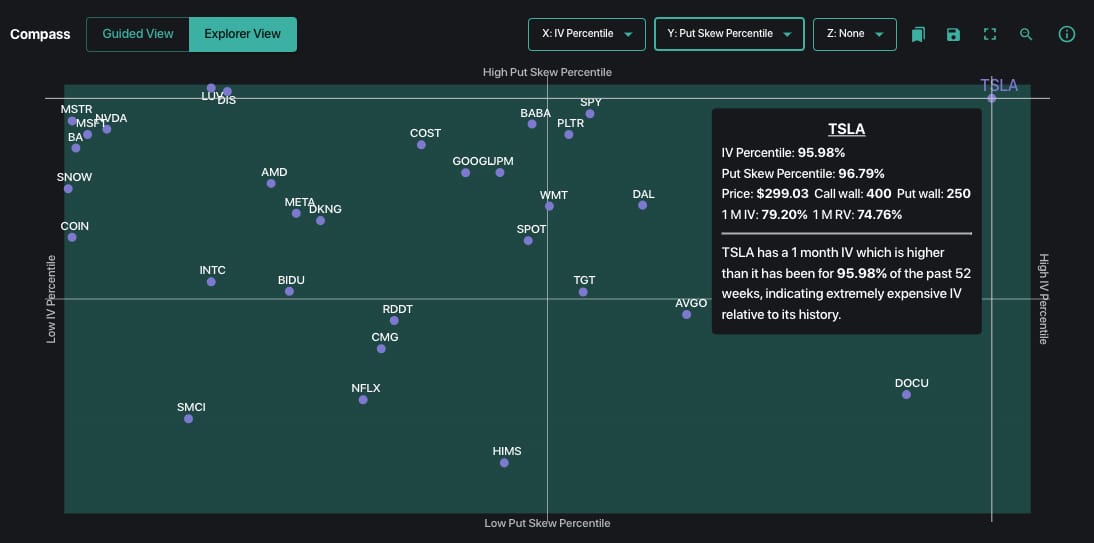
When we switch the Compass view up some, we see that TSLA put skew (ATM vs 25 delta put) is quite extreme, with the IV percentile also showing as very extreme. This signals that only a small fraction of days have seen put skews & IV’s as more extreme than yesterday. In other words – what just happened is indeed rare & extreme.
We won’t sit here and pretend to understand the psychology of Trump & Musk nor the TSLA or macro implications – there are plenty of psychologists on X this AM.
But we will wager that this was likely an initial over-reaction given the very public nature of the spat, and the flows-induced behaviors we saw yesterday. The result of this is that the put skew jumped sharply, making this seem ripe for strategies that bet on either volatility reduction and/or put skew flattening (like 1×2’s or broken wing put flies). We would also not throw shade on call spreads or call flies as a way to play a Elon/Donald mea-culpa.
Get instant access to our partners real-time market data and insights not available anywhere else. Here is last night Founder’s note getting you ready for today’s market and explaining the constraints in yesterday’s market. – MrTopStep
Trading Room News:
Polaris Trading Group Summary – Thursday, June 5, 2025
Thursday’s session was anything but quiet—Cycle Day 3 kicked off with textbook precision, hit multiple projected targets to the tick, and brought a news-driven rollercoaster of “tape bombs” that made for an exciting, opportunity-rich environment. PTGDavid led with sharp DTS alignment early on, before volatility and geopolitics stirred the pot midday and late session.
Key Themes & Market Guidance:
-
Pre-Market Prep:
-
Transition into Cycle Day 3 with price holding above CD1 low (5909.25) to confirm a strong 90.16% positive 3-Day Cycle stat.
-
Bull scenario: hold above 5975 ➜ target 5990–5995.
-
Bear scenario: break 5975 ➜ explore 5965–5960 “singles” zone down to Weekly VWAP (5958) and prior week’s high (5956).
-
-
Execution Excellence:
-
5975 held like a fortress → bullish target zone of 5990–5995 hit perfectly.
-
NQ also nailed its 21775–21800 zone from its “line in the sand” support.
-
ES hit 6003, a target from prior recap—another call that landed spot on.
-
-
Midday Mayhem:
-
The session was hit with headline risk and geopolitical news (“Tape Bombs”):
-
Trump & Xi call reports.
-
US-China policy remarks.
-
Oil news from the Middle East.
-
-
Volatility surged, requiring nimble adjustment and a calm mindset.
-
-
Afternoon Fade:
-
PTGDavid stepped away for meetings, only to return to a Range Runner Rhythm he hadn’t anticipated.
-
Decline continued to tag 5950 and 5944, then fulfilled CD1’s Average Decline Projection to 5940.
-
MOC Buy Imbalance surged to $3.9B, adding more drama into the close.
-
Highlights & Positive Takeaways:
-
Target Precision: 5975 held, 5990s fulfilled, 6003 tagged. DTS guidance delivered multiple clean, structured entries.
-
Adaptability in Chaos: Despite a barrage of tape bombs, the room stayed calm and focused. David reminded traders to “stay disciplined” and treat it as business as usual.
-
Range Re-Entry Opportunities: Pullback trades to structural zones (like 70–75) provided reentry shorts, fulfilling downside projections to the handle.
-
Community Engagement: Members like Bruce and Slatitude39 stayed active with charts, Bollinger Band setups, and learning-focused dialogue.
Lessons Learned:
-
“Volatility is your Friend, if You’re Ready” – DTS preparation enabled clarity when the headlines hit.
-
Stick to Structure – Initial game plans paid out early; later moves needed flexibility and awareness.
-
Patience Pays – Waiting for back-tests and confirmation zones (e.g., 70–75) led to smarter re-engagement.
-
Be Ready for Anything – PTGDavid’s beach break reminded us markets don’t stop moving. Stay alert, even when stepping away.
Conclusion:
June 5th was a drama-rich, precision-striking, opportunity-filled session. From clean execution in the morning to managing chaos in the afternoon, it was a day that tested and rewarded both discipline and adaptability. A sharp reminder that preparation—backed by structure—enables confident action even in the eye of the storm.
DTG Room Preview – Friday, June 6, 2025
-
Key Focus:
Markets await the May jobs report (8:30am ET), expected to show early tariff impacts. Weak data could reignite Fed rate cut discussions.Market Movers:
-
Trump vs. Musk Feud: Escalated publicly, sending Tesla (TSLA) down 14% Thursday, but rebounded 5% overnight. Musk threatened to decommission SpaceX’s Dragon spacecraft before walking it back. White House scheduled a call to ease tensions.
-
IPO Spotlight: Circle Internet Group (CRCL) surged 167% on its NYSE debut, signaling growing institutional acceptance of USDC, its USD-pegged stablecoin.
-
Corporate Insight: Deutsche Bank notes modern tech giants, like Nvidia, run lean. NVDA’s market cap per employee hits $90M, highlighting reliance on IP over headcount.
Tech Levels & Volatility:
-
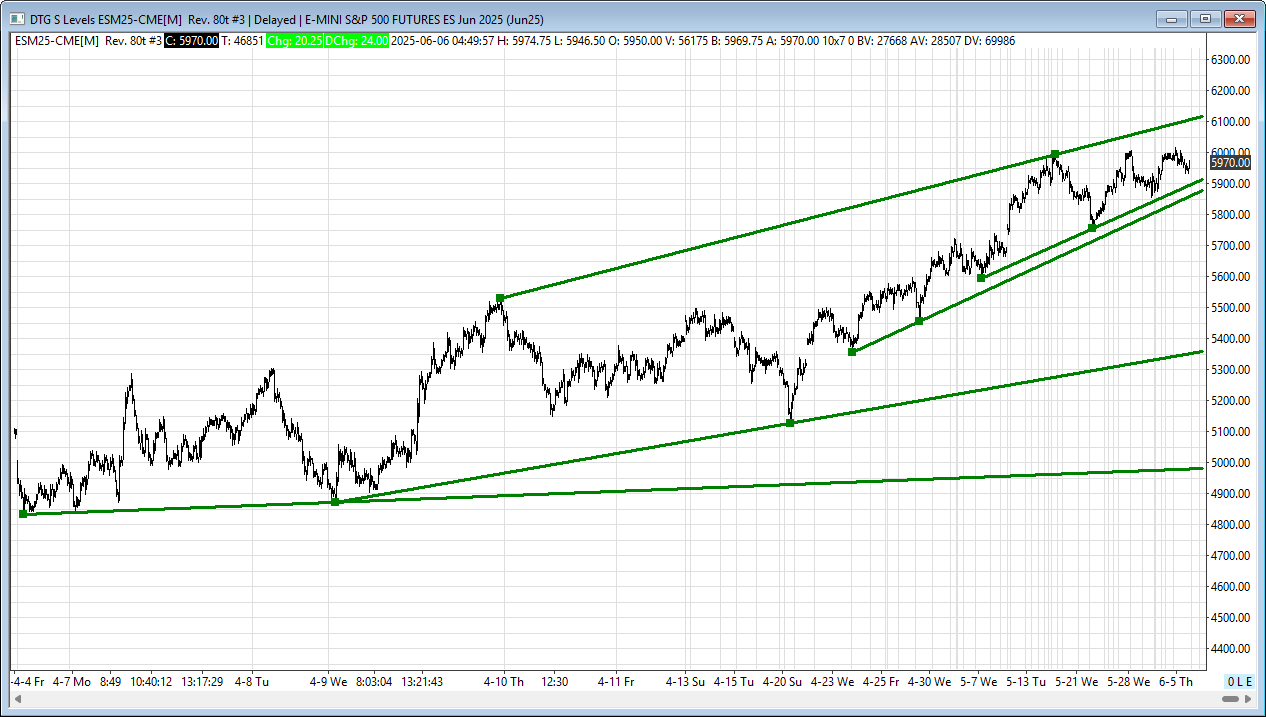
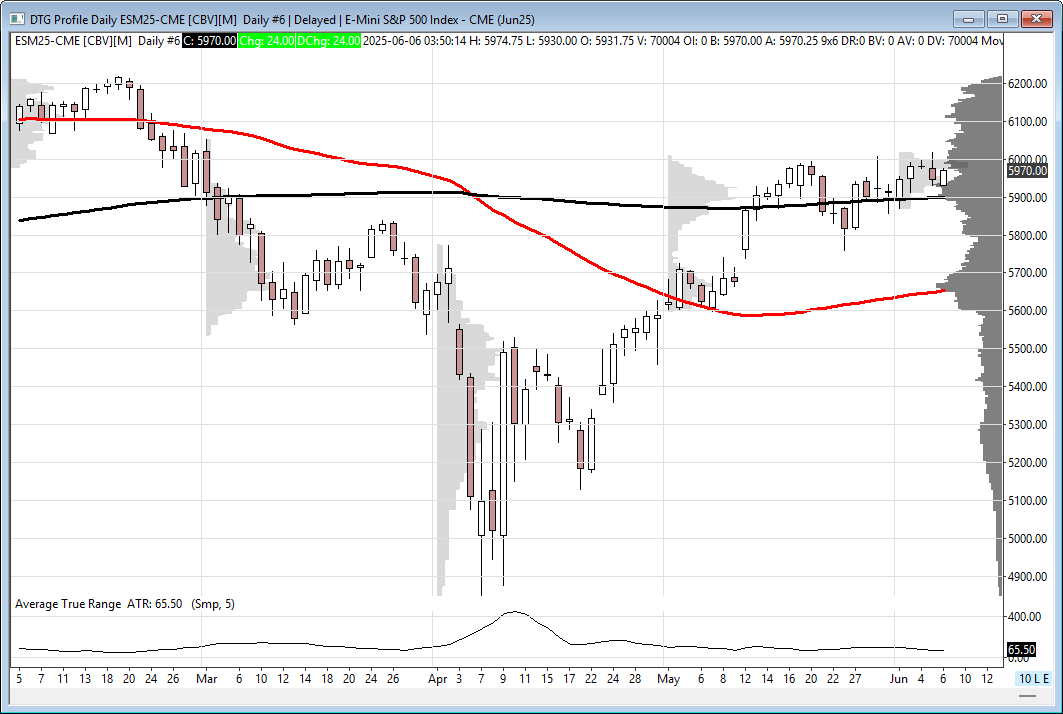
ES Outlook: Sitting mid-channel after peaking above 6000. 200-day MA (5898.50) acts as soft support. Watch jobs data for a potential move toward TL resistance at 6107/12 or support near 5898/01 and lower.
-
Volatility: Moderating but still elevated. ES 5-day average range: 72.50. Expect jobs data to drive today’s tone.
Other Notes:
-
Premarket earnings: KT
-
Economic Calendar: Consumer Credit (3:00pm ET)
-
Light overnight large trader volume following Thursday’s ES dip buying.
-
ES
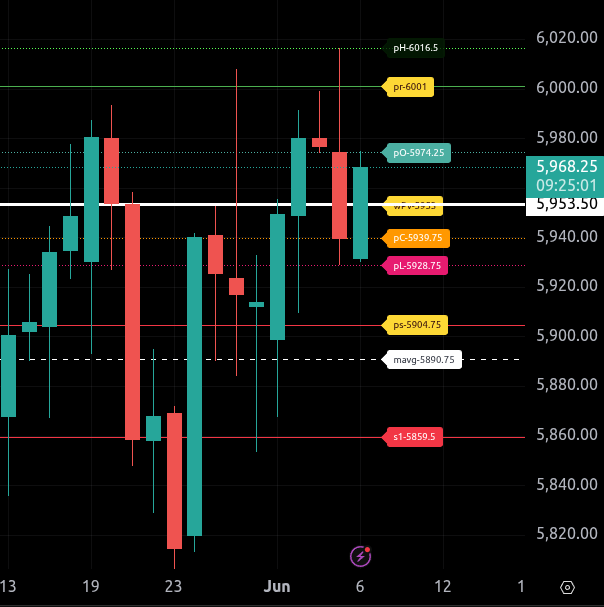
The bull/bear line for the ES is at 5953.50. This is the key pivot that must be taken back by buyers to shift intraday sentiment back to bullish. Below this level, the market remains vulnerable to further downside probes.
Currently, ES is trading around 5967.25, above the bull/bear line, putting bulls in control for the moment. If the market can sustain above 5953.50, the first upside objective is the cluster of resistance at 5974.25 and then 6001.00, which is the upper range target for today. Continued strength above that opens the door to yesterday’s high at 6016.50 and then 6046.25.
Should sellers regain control and push back below 5953.50, the first downside targets are 5939.75 and 5928.75. Below that, 5904.75 becomes the lower range target, and if breached, we look for a test of deeper support near 5859.50.
NQ
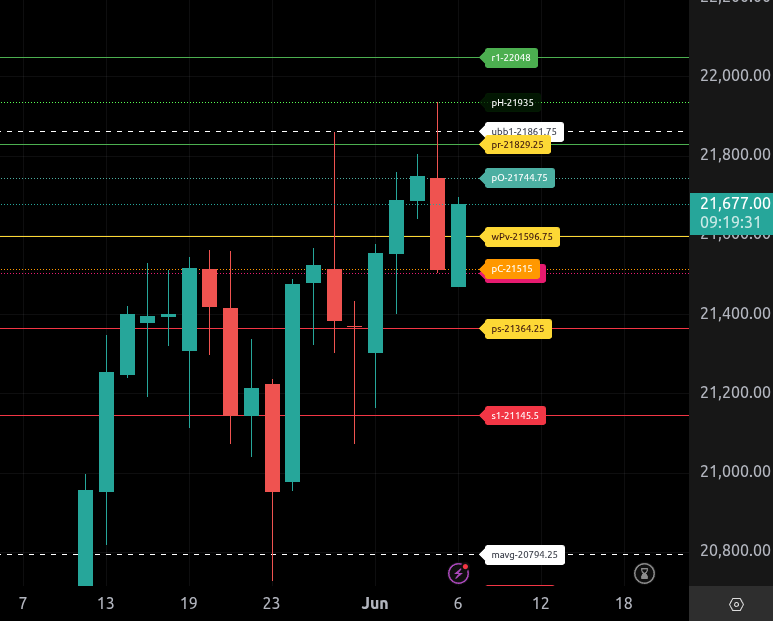
The bull/bear line for the NQ is at 21,596.75. Price is currently trading above this level near 21,677.50, indicating a bullish bias for the open as long as that line holds.
The upper range target is 21,829.25. If buyers can push through that level, the next resistance lies near 21,861.75, followed by 21,935 and then 22,048. These levels represent key zones where sellers may emerge. Also note 21,744.75, which was yesterday’s open, as a minor upside resistance.
On the downside, the first watch zone is the bull/bear line at 21,596.75. If price drops below it, the initial support is 21,515.00. Below that, watch for reactions at 21,364.25, which is the lower range target. A break of that opens the door to 21,145.50.
NQ remains in short-term bullish territory above 21,596.75, but that support must hold to keep upward momentum intact.
Calendars
Economic Calendar Today
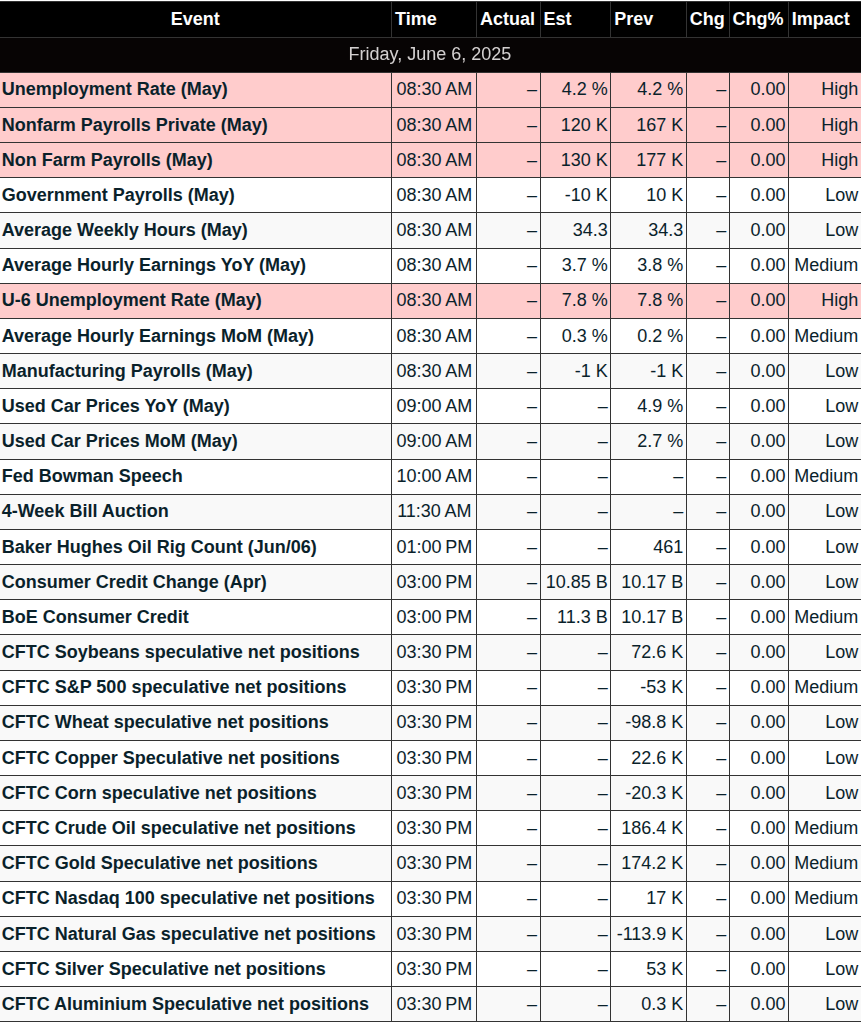
This Week’s High Importance
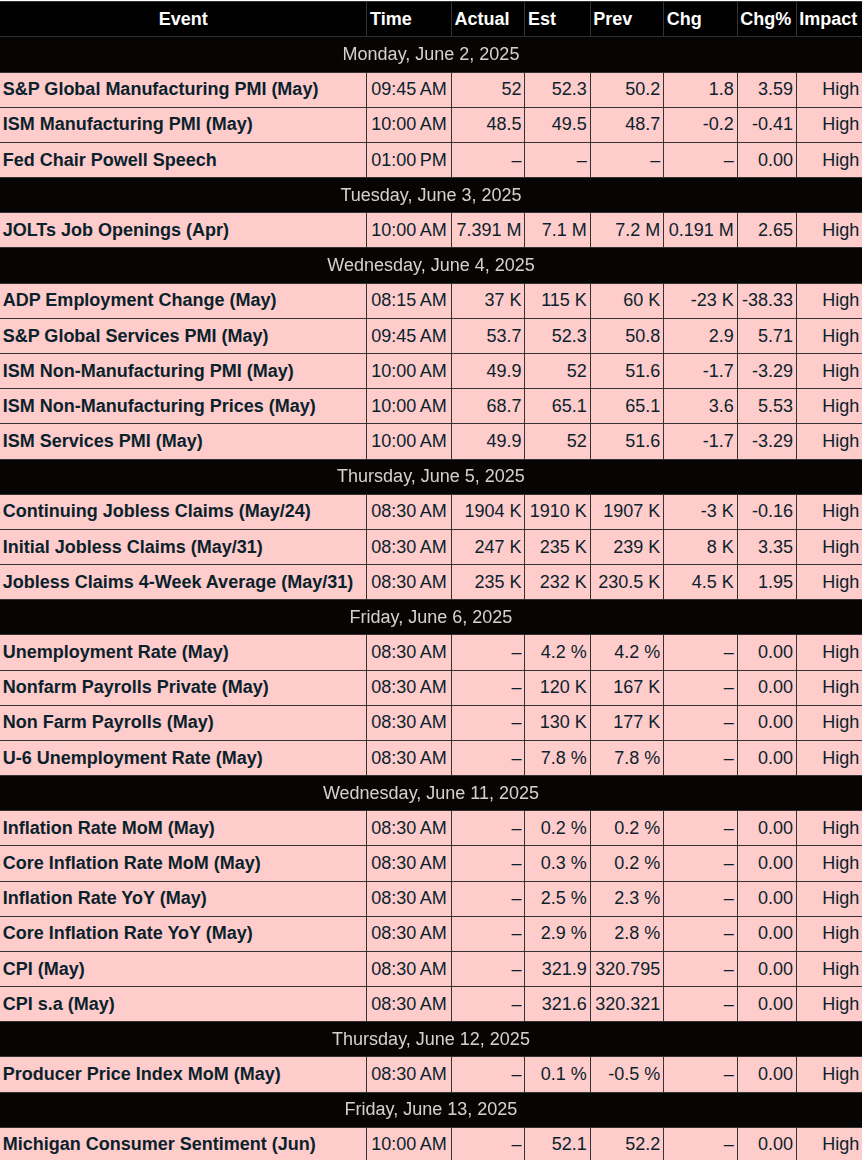
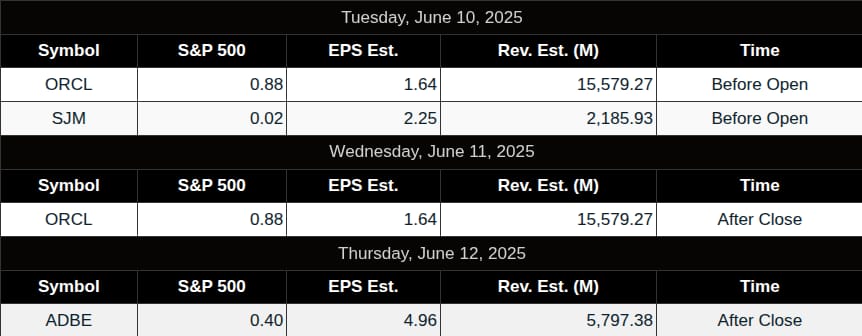
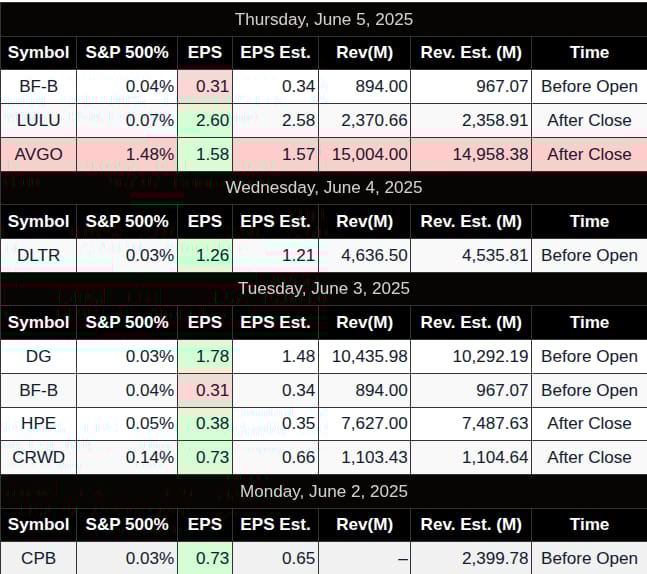
Earnings:
Affiliate Disclosure: This newsletter may contain affiliate links, which means we may earn a commission if you click through and make a purchase. This comes at no additional cost to you and helps us continue providing valuable content. We only recommend products or services we genuinely believe in. Thank you for your support!
Disclaimer: Charts and analysis are for discussion and education purposes only. I am not a financial advisor, do not give financial advice and am not recommending the buying or selling of any security.
Remember: Not all setups will trigger. Not all setups will be profitable. Not all setups should be taken. These are simply the setups that I have put together for years on my own and what I watch as part of my own “game plan” coming into each day. Good luck!!
Follow @MrTopStep on Twitter and please share if you find our work valuable!
This post goes out as an email to our subscribers every day and is posted for free here around 2 PM ET. To get your real-time copy, sign up for the free or premium version here: Opening Print Subscribe.
Comments are closed