This post goes out as an email to our subscribers every day and is posted for free here around 2 PM ET. To get your real-time copy, sign up for the free or premium version here: Opening Print Subscribe.
Big Gap, Big Week, Big Decisions
Follow @MrTopStep on Twitter and please share if you find our work valuable!
Our View
/
What can I say? The ES and NQ have gone up, but will they keep going up? The ES made a high at 5710.00 on Friday, sold off down to 5662.50 during the session, and popped back up to 5684 at the 5:00 futures close. I don’t think there’s much to say that we haven’t already covered. It’s been three months of vicious moves and, like I said back then, it’s not going to stop. Everything is changing so fast, it’s hard to gauge where things are going.
After a big sell-off, TSLA has now closed higher three straight weeks in a row, and investors are taking a deep breath as the U.S. and China meet in Geneva for tariff talks, which appeared to pay off.
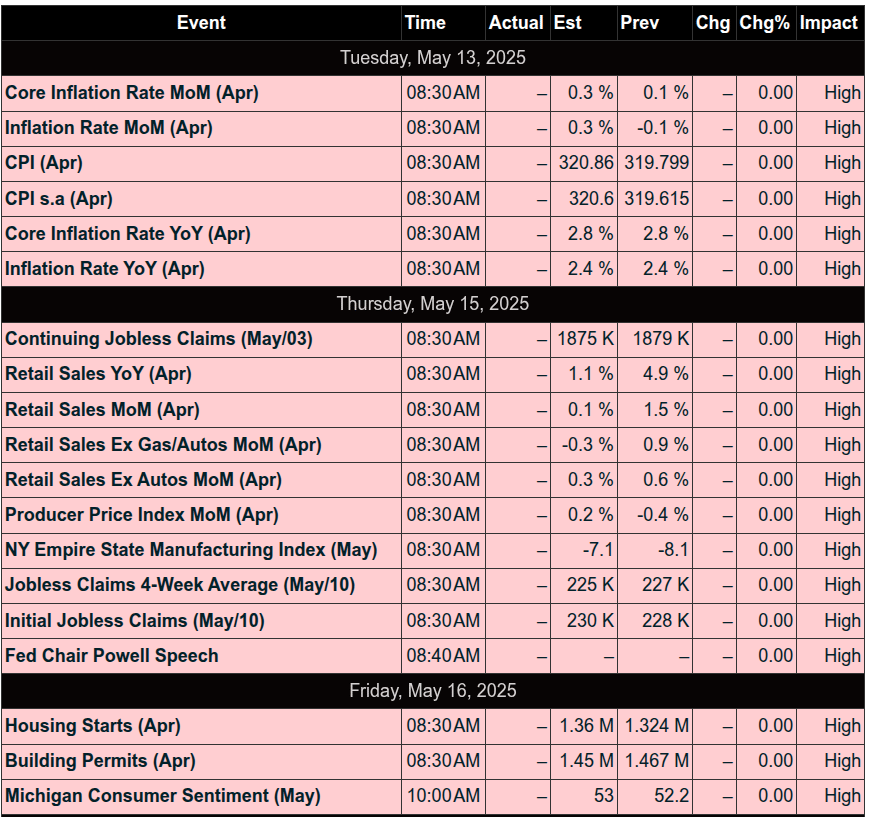
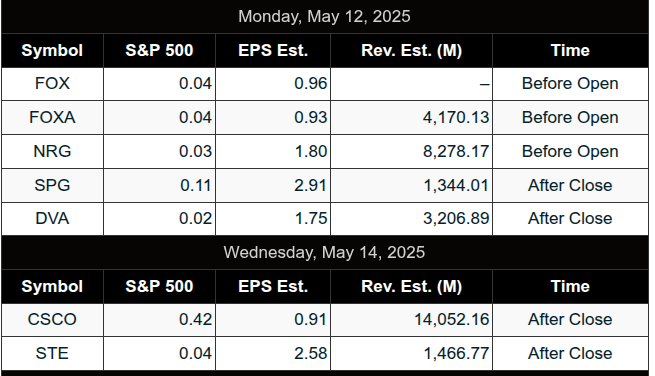
This week we have 17 economic reports, 10 of which include retail sales and PPI. Powell is scheduled to speak on Thursday. Earnings reports include Cisco Systems (CSCO), Applied Materials (AMAT), Baidu (BIDU), Lithium Americas (LAC), among others.
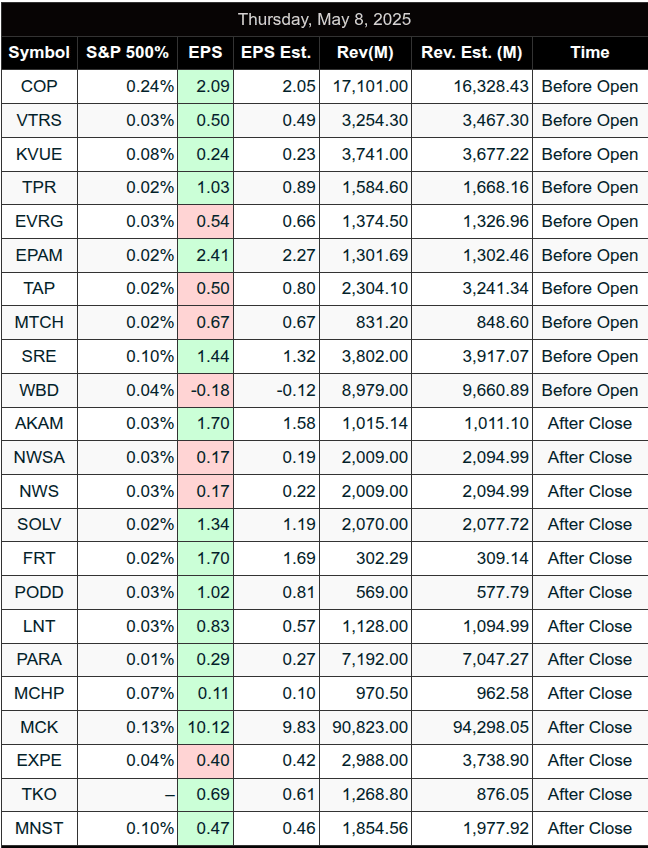
Overall, 90% of companies in the S&P 500 have reported actual results for Q1 2025. Of these, 78% have reported EPS above estimates, higher than the five-year average of 77% and the ten-year average of 75%.
Where is the S&P? Friday’s close for the index was 5659.910, down about 20 points from the previous week’s close but a significant 17% rally from its April 7 low. The technical outlook remains bullish, with the index nearing its 200-day SMA resistance at 5748, and market breadth improving to 44.40% from 37.80%.
Q1 2025 earnings have been strong, with 12.8% growth and 76% positive EPS surprises, which I think has helped support the performance in the index markets. ES support should be monitored at 5600 and resistance at 5700, taking into account both technical factors and macro developments like the tariff negotiations.
As the U.S. and China press forward with talks, discussion about delisting Chinese stocks from U.S. exchanges has resurfaced. Trump first raised the issue in late February, and while the administration has been on the down low, the discussion has come up again. There are currently 286 Chinese-listed companies on U.S. exchanges with a total market capitalization of $1.1 trillion.
Our Lean
Support Levels:
1st Support Level: 5655.25
2nd Support Level: 5632.50
3rd Support Level: 5602.50
Resistance Levels:
1st Resistance Point: 5708.00
2nd Resistance Point: 5738.00
3rd Resistance Point: 5760.70
4th Resistance Point: 5776.00
Fibonacci Levels:
61.8%: 5699.99
50%: 5533.88
38.2%: 5367.76
52-Week Range:
High: 6237.75
Low: 4830.00
Few know this, but before I went to the S&P, I was an arbitrage clerk in the CME’s gold pit. In December 1979, gold was trading around $500.00 and made a high in April at 3,485.60. Last week, a JP Morgan analyst estimated that gold could reach $6,000 per ounce by 2029—an 80% increase. Gold has outperformed the U.S. dollar by approximately 16.2% over the last 90 days. I wonder what that comparison will look like in 2029.
Our lean: we have another big week of economic reports, with the highlight being Thursday, when we get a look at the April PPI and Powell’s speech. My gut says we’re still going up, but the ES has to clear 5740 and hold. If it does, then we can start talking 5800–5850. Barring any major news, I would like to buy a lower open. If that doesn’t happen, I may look at selling a big gap up. The trend is your friend.
Update: Bessent says two days of talks with China yielded “substantial progress,” promising additional details Monday. The ES opened Sunday night’s Globex session 71 points higher and rallied up to 5768.50. My guess is we pull back either at the open or by mid-morning. As of my writing this last night, the ES was up 640.75 points from the April 7 low of 5127.75.
MiM and Daily Recap
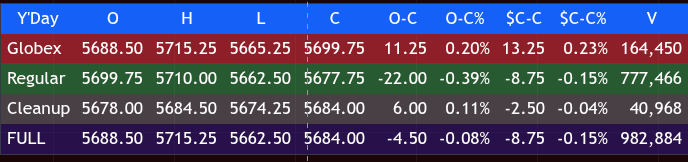
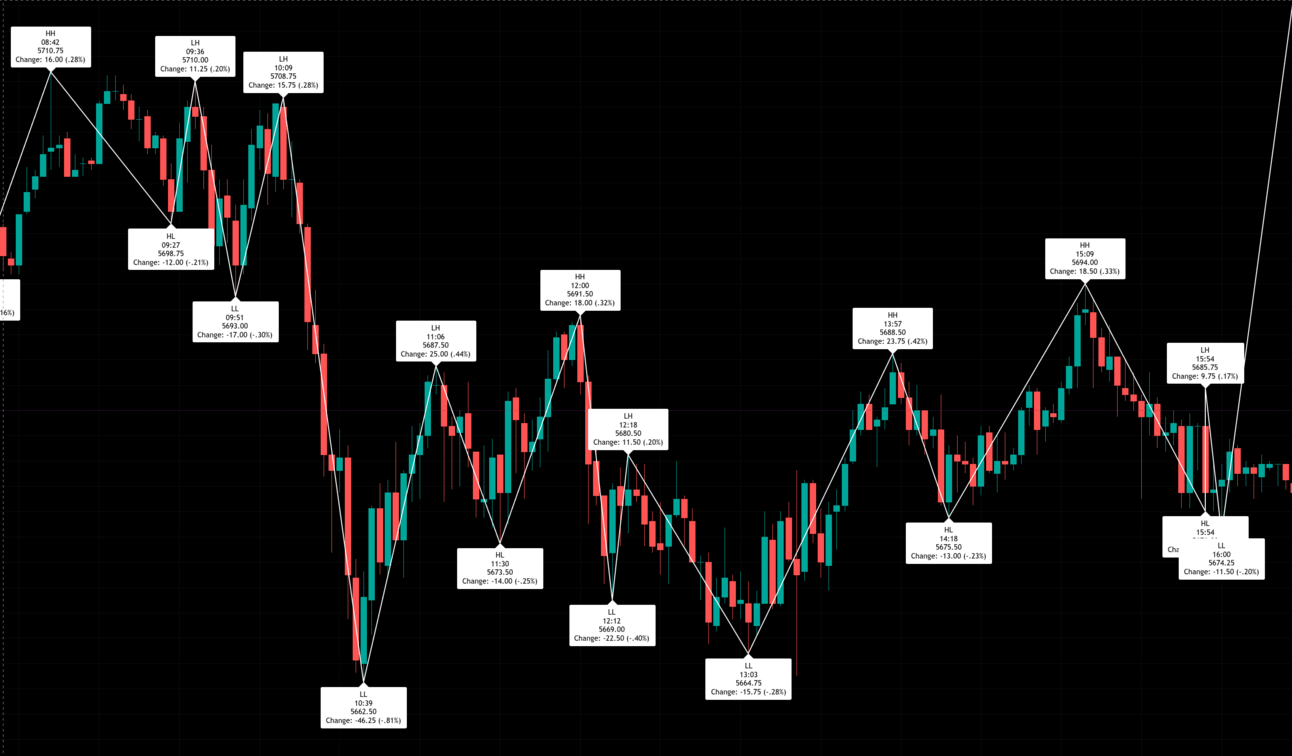
The S&P 500 futures opened the regular session at 5699.75 following an overnight Globex rally that reached a high of 5715.25 at 07:42 ET. The early tone was bullish, but a lower high of 5710.00 was set at 09:36 before sellers took control. A swift drop to 5693.00 by 09:51 marked the first meaningful low, quickly followed by a recovery bounce to 5708.75 at 10:09. However, that lower high proved to be a trap as a sustained decline followed, breaking to 5662.50 at 10:39, the session’s low and a 48-point reversal from the morning’s peak.
From there, buyers staged a sharp rebound, lifting the market to 5687.50 by 11:06, a 25-point bounce, only to give back ground into a midday low of 5673.50 at 11:30. This back-and-forth continued as price surged again, reaching 5691.50 at 12:00 before pulling back to 5680.50 at 12:18 and dropping further to 5669.00 at 12:42. The tone improved once again with an afternoon rally that reached 5688.50 by 13:57 before fading to 5675.50 at 14:18.
Late afternoon action saw a final spike to the high of 5694.00 at 15:09, followed by a fade into the final hour where the low of 5674.25 printed at 16:00. The regular session settled at 5677.75, down 22.00 points or -0.39% from the open and down 8.75 points (-0.15%) from Thursday’s cash close.
Globex provided early optimism, adding 13.25 points from Thursday’s settle to Friday’s Globex close (5699.75). However, the regular session erased that strength. Cleanup added back 6.00 points to close at 5684.00, trimming the day’s full-session loss to 4.50 points (-0.08%) open to close or -8.75 points previous cash close to close.
Friday’s tape was characterized by back-and-forth swings with no decisive trend—bulls and bears exchanged control repeatedly without clear dominance. While the overnight session attempted a breakout, the regular session failed to maintain momentum, producing a series of lower highs and lower lows that capped rallies and deepened the day’s decline.
Volume was a bit light with 777,466 contracts trading during the regular session, bringing the full day total to 982,884. The intraday structure suggests a market still searching for direction amid headline sensitivity.
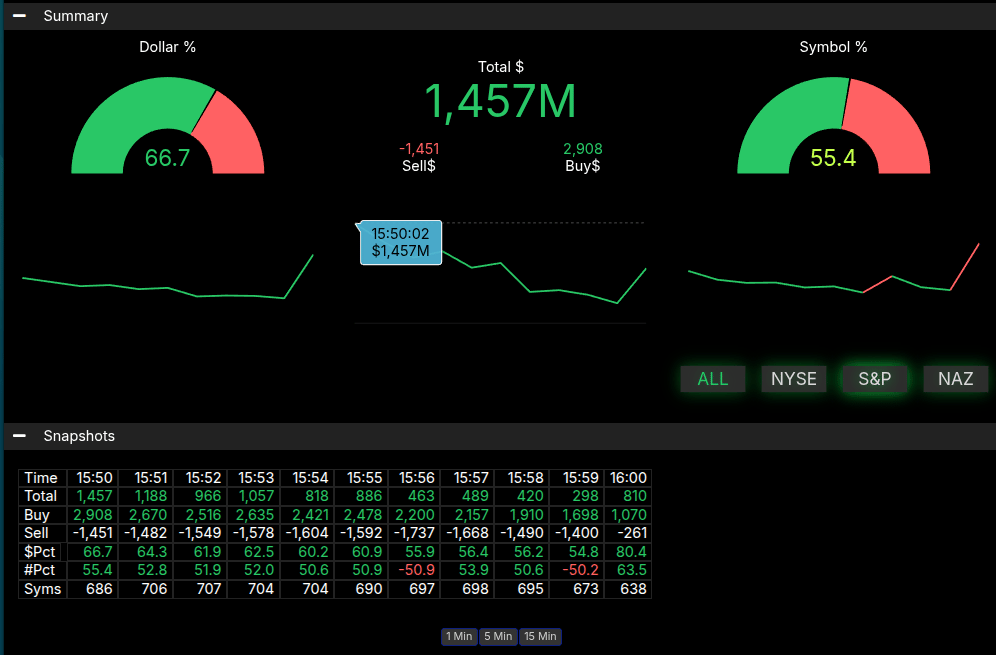
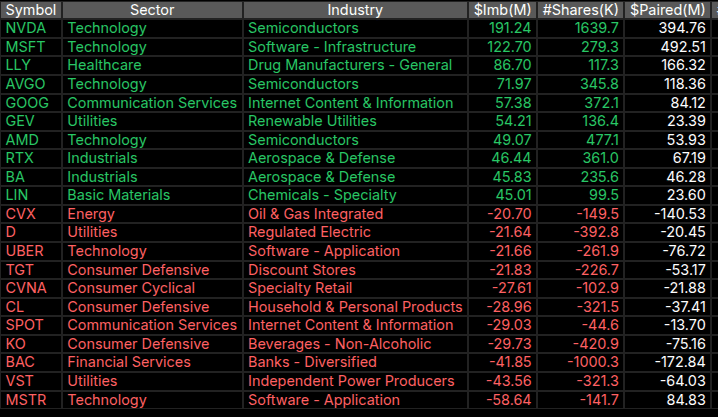
Market-on-Close (MOC) imbalance data leaned bullish with $1.457B to buy at 15:50 ET, and the imbalance percentage hit the 66.7% threshold—indicating a strong directional skew. However, the symbol imbalance ended at only 55.4%, suggesting the flow was concentrated in fewer large names rather than broad-based.
Despite that strong dollar bias, the late-day action was muted as the ES briefly tested 5674.25 just after the imbalance reading before inching back above 5680. No major breakout followed, indicating hesitation among large participants.
In conclusion, the ES saw early Globex strength fade through the regular session with price chopping between 5662 and 5715. While MOC flow leaned supportive, broader sentiment felt unresolved. The market may need further catalysts to define direction in the upcoming week.
Technical Edge
Fair Values for May 12, 2025:
-
SP: 16.82
-
NQ: 72.16
-
Dow: 71.96
Daily Breadth Data 📊
-
For Friday, May 9, 2025
-
NYSE Breadth: 59% Upside Volume
-
Nasdaq Breadth: 60% Upside Volume
-
Total Breadth: 59% Upside Volume
-
NYSE Advance/Decline: 57% Advance
-
Nasdaq Advance/Decline: 49% Advance
-
Total Advance/Decline: 52% Advance
-
NYSE New Highs/New Lows: 50 / 24
-
Nasdaq New Highs/New Lows: 92 / 103
-
NYSE TRIN: 0.79
-
Nasdaq TRIN: 0.64
-
Weekly Breadth Data 📈
-
For the Week Ending May 9, 2025
-
NYSE Breadth: 54% Upside Volume
-
Nasdaq Breadth: 56% Upside Volume
-
Total Breadth: 55% Upside Volume
-
NYSE Advance/Decline: 58% Advance
-
Nasdaq Advance/Decline: 49% Advance
-
Total Advance/Decline: 52% Advance
-
NYSE New Highs/New Lows: 141 / 110
-
Nasdaq New Highs/New Lows: 256 / 303
-
NYSE TRIN: 1.15
-
Nasdaq TRIN: 0.73
-
Room Summaries:
Polaris Trading Group Summary Friday, May 9, 2025
Friday was marked as a Capital Preservation Day in the PTG trading room, with a clear tone set by PTGDavid early on. The day prioritized risk management and measured setups, with trading opportunities focused around key levels in the CL (Crude Oil Futures) and broader market structure. David announced a mid-day departure, leaving charts online for continued observation. Despite a defensive posture, the session offered strong lessons and precise execution in defined windows.
Key Highlights & Trades:
-
CL Open Range Short:
Early in the session, David called out a CL (Crude Oil) Open Range Short that hit lower targets successfully. By 10:25 AM, the short setup had FULL PAY with All Targets Fulfilled, making it the standout trade of the day. -
Bullish Fulfillment:
Early bullish scenario from 5685 targeting 5710–5715 was met and fulfilled efficiently. Price action respected PTG’s levels with strong alignment between setup and execution. -
Bearish Shift Mid-Morning:
After hitting upper targets, the room shifted to a bearish lean on bounces, targeting the 5650–5645 zone. This adaptability exemplified disciplined response to evolving price structure. -
Educational Emphasis:
A significant amount of the day focused on refining personal trading rules, execution discipline, and trading psychology. Comments from DanV and others emphasized the importance of execution over mere chart knowledge.
Lessons & Takeaways:
-
Execution is Key: “Execution separates the boys from the girls,” as DanV put it—reminding traders that knowing levels is not enough without proper execution.
-
Personal Rule Refinement: Several members mentioned refining their own trading rules—a great sign of internalizing PTG’s structured approach.
-
Capital Preservation Mindset: Though a quieter day in terms of volume, the focus remained sharp. The designation of “Capital Preservation Day” reinforced the importance of being selective and defensive when the environment calls for it.
End of Day Reflection:
The afternoon remained quieter with some humor and camaraderie, especially around PTGDavid’s departure for a medical appointment. The day’s fulcrum level was identified at 5685, around which price oscillated into the close. A lighthearted tone rounded out the session as members joked about whiskey and weekend plans.
Weekend Note:
By Sunday evening, David noted a price gap up to the Money Box level 5769.50 on news of China trade developments. Despite the move, he labeled it a “yawn,” cautioning that bulls need sustained action above 5850 to hold significance.
Final Word:
A disciplined, low-risk trading day where the CL Open Range Short stood out as a textbook PTG setup. Members deepened their rulebooks and refined focus—hallmarks of consistent trading growth.
DTG Room Preview – Monday, May 12, 2025
-
Top Story:
US futures surged overnight following news of a 90-day trade war truce between the US and China, with both sides agreeing to reduce tariffs to 10%. Treasury Secretary Bessent emphasized that neither nation wants a decoupling, while Chinese Vice Premier He Lifeng hailed the Geneva talks as a key first step. However, 20% tariffs tied to fentanyl trade remain.Market Impact:
-
Dollar/Yields Up, Gold Down: Stronger US dollar and higher Treasury yields accompany falling gold prices.
-
Pharma Stocks Sink: Global pharmaceutical names are under pressure after President Trump pledged an 80% cut in US drug prices. Major US drugmakers are down premarket, missing out on the broader rally.
-
Executive Order Incoming: Trump to sign an EO on drug pricing at 9:00 AM ET, likely triggering legal challenges from the industry.
Policy Developments:
-
House GOP aims to claw back $6.5B from unused climate funds in the Inflation Reduction Act, targeting environmental justice, renewable energy, and emission programs. Methane fee collection may be delayed.
Earnings & Events:
-
Premarket: SBS, DVA, FOX, FOXA, NRG, PBR
-
After the bell: SPG
-
Econ Data: Federal Budget Balance @ 2:00 PM ET
-
Fed Speak: Gov. Kugler @ 10:25 AM ET
Technical Picture (ES Futures):
-
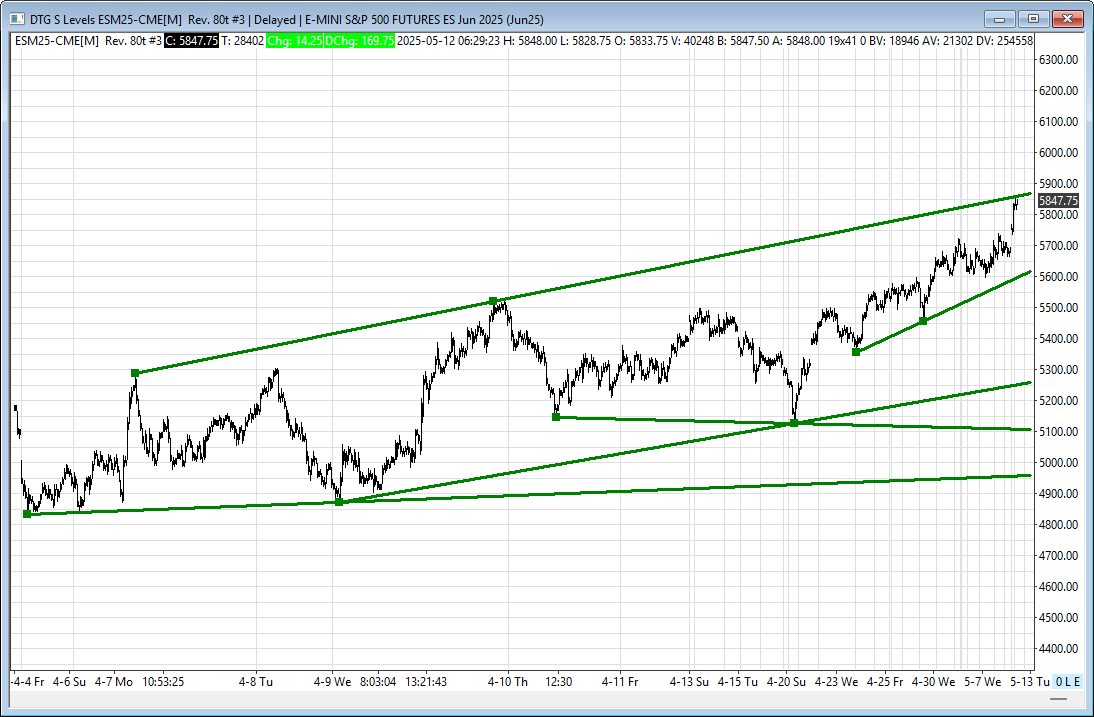
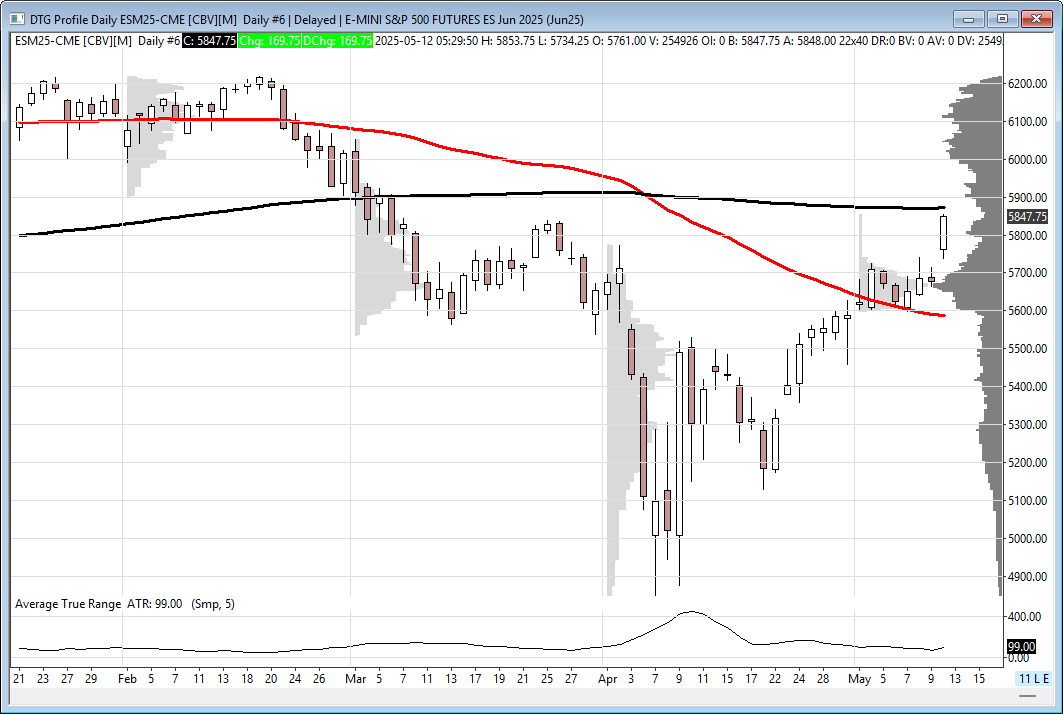
Overnight breakout tested the short-term uptrend channel top (5859/64); resistance remains here with the 200-day MA (5871.75) also back in play.
-
Support zones: 5614/19, 5259/64, 5107/02, 4962/67
-
Volatility contracted Friday; 5-day ADR is 74.50
-
Whale bias bullish despite low large trader volume overnight
-
ES
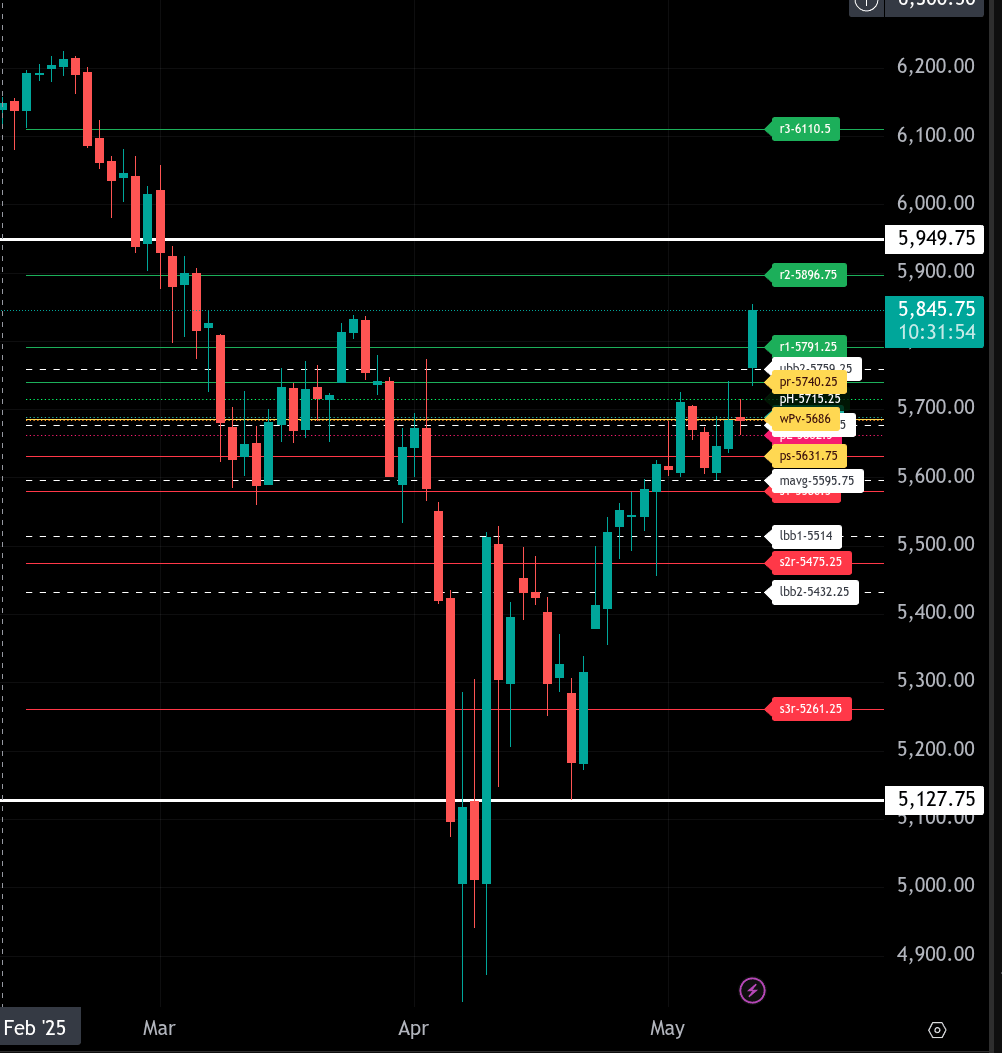
ES is facing a very large gap up this morning, rendering the bull/bear line at 5686.00 less relevant for today. With the market trading significantly above this level, the focus shifts to how price behaves near key resistance zones and whether buyers can sustain this strength.
As long as ES holds above 5686.00, the upper intraday target is 5896.75. The first resistance to contend with is 5791.25, followed by 5896.75 and then a broader upside target near 6110.50. A break and hold above 5896.75 opens the door for a squeeze into that upper zone. Also note that 5949.75 is the longer-term bull/bear line. A close above this level today, followed by an open above it tomorrow, would shift our longer-term sentiment to bullish.
On the downside, if ES pulls back, watch 5791.25, 5759.25, and 5740.25 as downside resistance-turned-support levels. A move below 5715.25 would begin to call the significance of the gap into question. Below that, support sits at 5662.50 and 5631.75. A sustained move lower targets 5580.50, with deeper support near 5566.25 and 5559.75.
The broader structure favors the bulls while ES holds above these key levels. A retest of the 5740.25 level (pr) could serve as a possible pullback buy zone. Watch for continuation momentum above 5844.25 to confirm buyer conviction.
Remain flexible and responsive to price behavior around these key intraday and swing levels, particularly 5949.75 to the upside and 5715.25 on the downside.
NQ
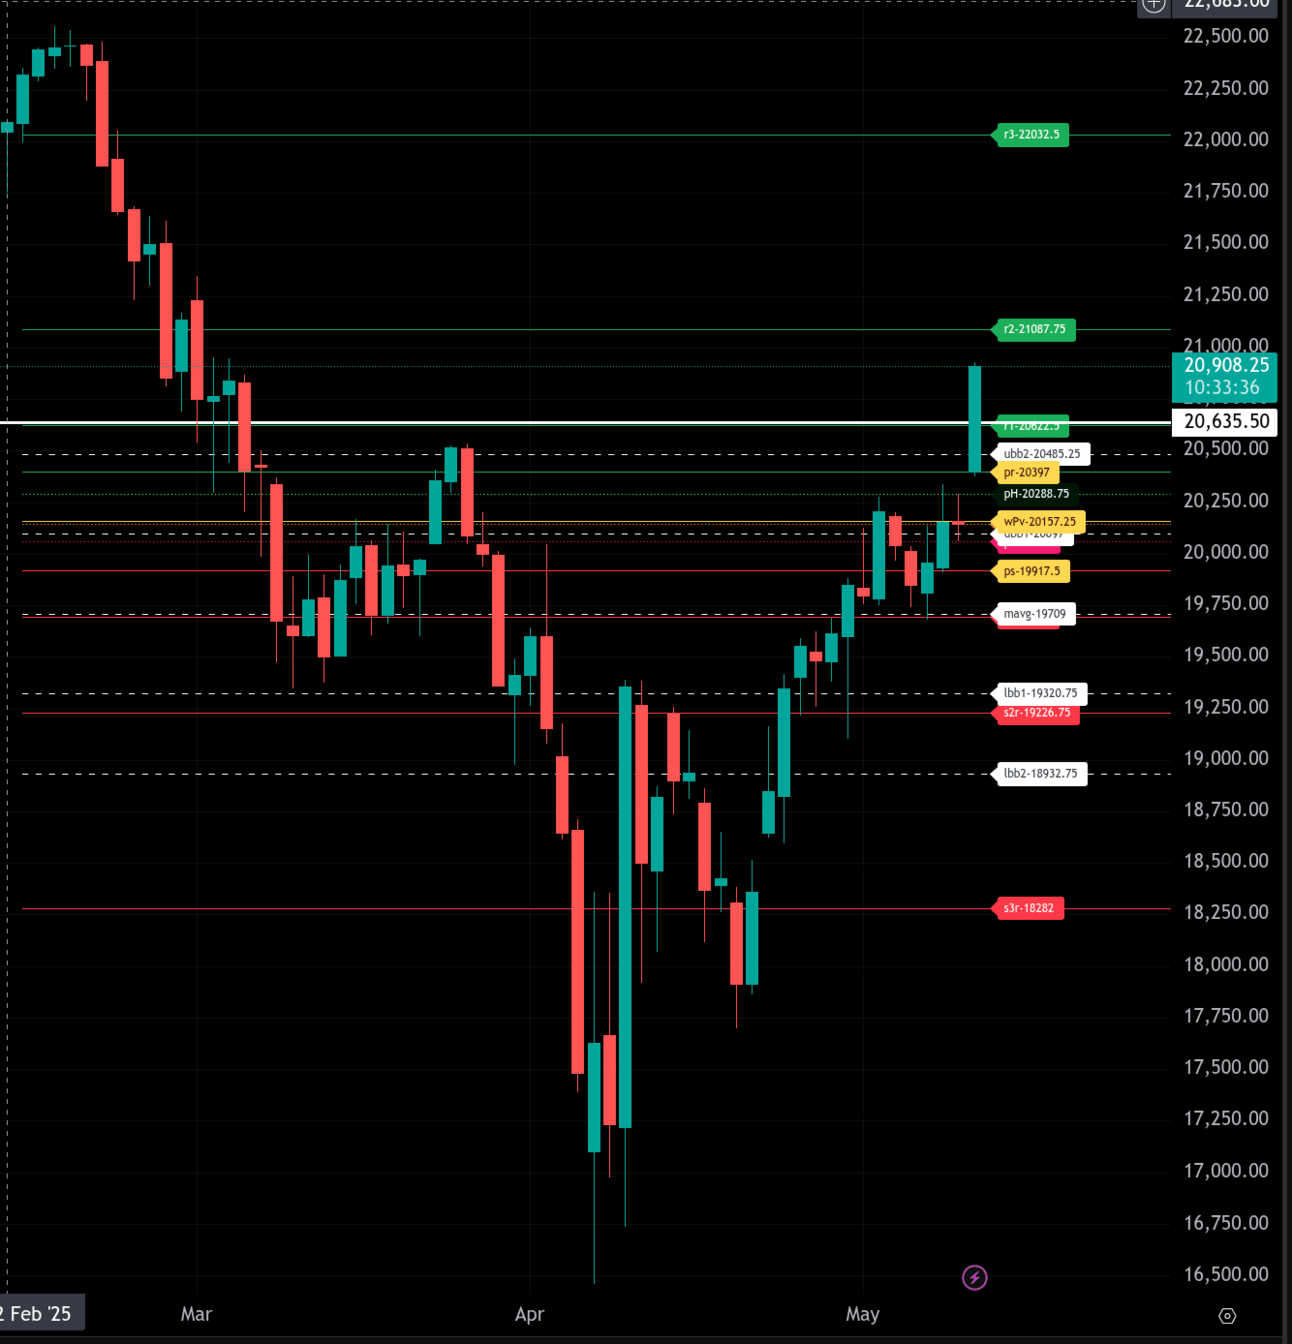
The bull/bear line for NQ is at 20,157.25. This is the key pivot level for the session. Holding above this level favors bullish momentum. On the other hand, if the market trades below it for a sustained period, further downside pressure is likely.
Currently, NQ is trading at 20,908.50, well above the bull/bear line, showing strong upward bias in the overnight session. The immediate upside target is 20,997.00, followed by 21,087.75 (upper range target) and a possible extension toward 22,032.50 if momentum continues.
On the downside, if the market reverses and breaks below 20,635.50 and the session pivot at 20,622.50, the next areas of support are 20,397.00 and the bull/bear line at 20,157.25. A breakdown below this could test 20,038.00 and extend to the lower range target of 19,917.50.
With the current price above all key resistance levels and the bull/bear line, the bias remains bullish, but traders should watch for potential rejection near 21,087.75 if the rally extends further.
The bulls are playing for a hold today. Any price extension would be hard to achieve above 21,087.00, so watch the downside for a hold. The level 20,635.50 is our long-term bull/bear line. A close today and open tomorrow above that line will reverse our bearish stance and put us officially in a long-term bullish mode where we favor buying dips rather than shorting rips.
Calendars
Economic
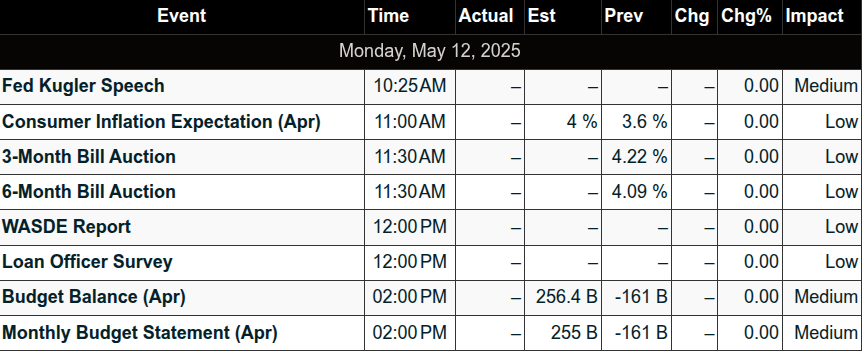
Important events for the rest of the week:
S&P 500 Earnings
Recent
Affiliate Disclosure: This newsletter may contain affiliate links, which means we may earn a commission if you click through and make a purchase. This comes at no additional cost to you and helps us continue providing valuable content. We only recommend products or services we genuinely believe in. Thank you for your support!
Disclaimer: Charts and analysis are for discussion and education purposes only. I am not a financial advisor, do not give financial advice and am not recommending the buying or selling of any security.
Remember: Not all setups will trigger. Not all setups will be profitable. Not all setups should be taken. These are simply the setups that I have put together for years on my own and what I watch as part of my own “game plan” coming into each day. Good luck!
This post goes out as an email to our subscribers every day and is posted for free here around 2 PM ET. To get your real-time copy, sign up for the free or premium version here: Opening Print Subscribe.
Comments are closed