Bulls Try to Maintain Momentum Into September
Jobs report is this week’s focus
Follow @MrTopStep on Twitter and please share if you find our work valuable!
Every week, MrTopStep invites traders to an “Own the Close” contest where the closest guesstimate where the SPX will settle on Friday’s 4:00 cash close.
The winners get a free week’s access to the MrTopStep Chat and trading tools. Enter your guess now!
Our View
It’s a new month and with it comes new obstacles. A lot has to be crammed into the first four trading sessions of September. There are 14 economic releases, Treasury auctions, and the week ends with the July jobs report and two Fed speakers on Friday morning.
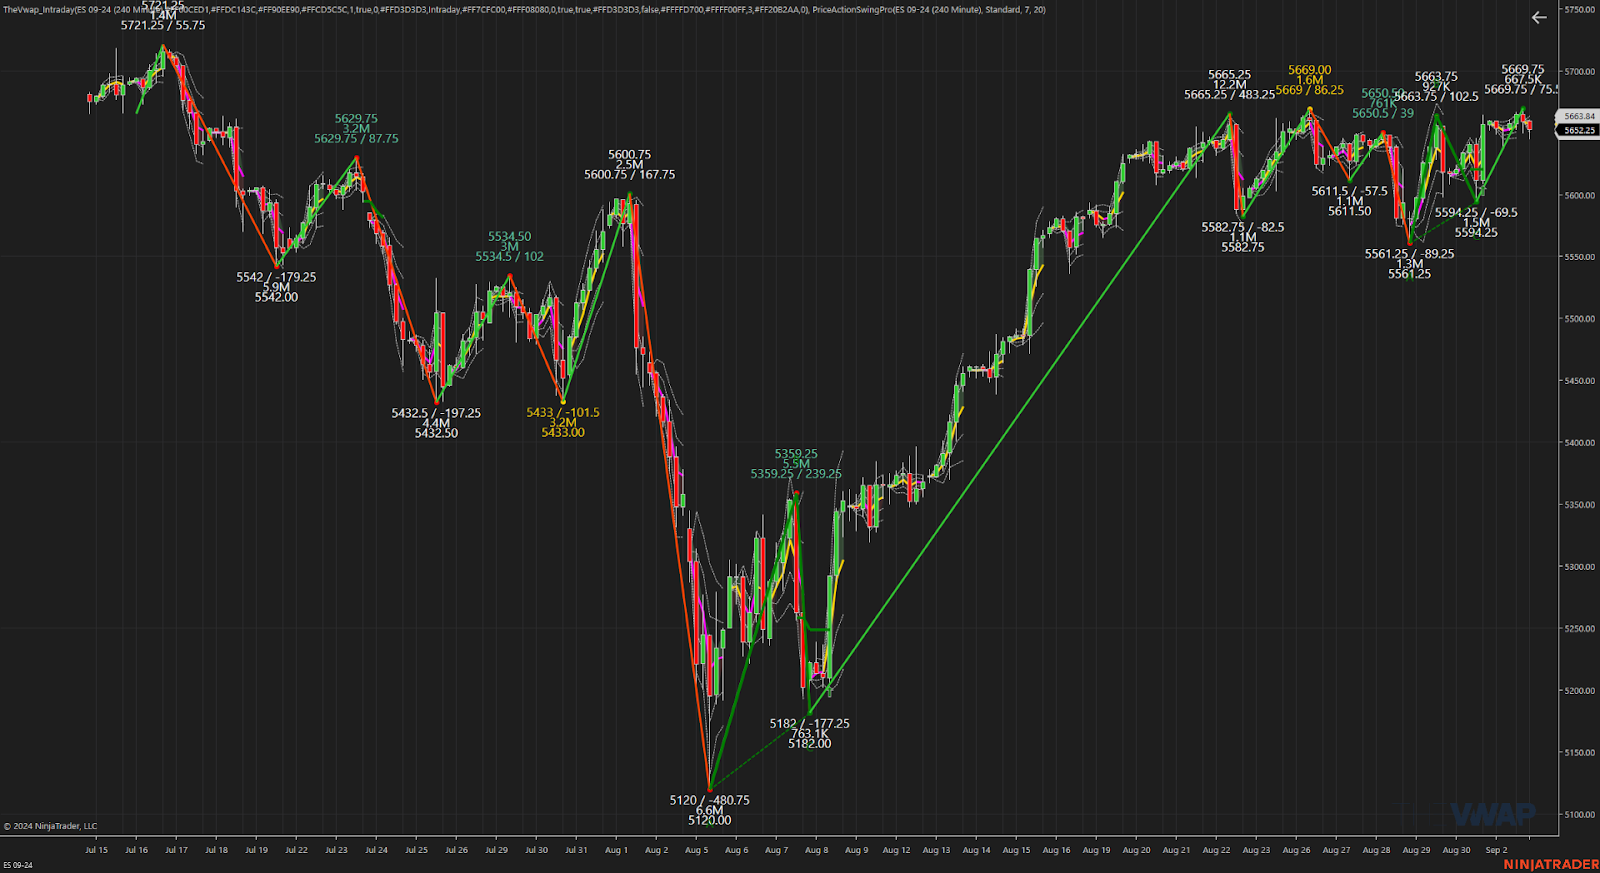
The wider view of the ES is one of a few selloffs under 5600.00, but also a ton of back-and-fill above and below the big figure at 5600.00. Every time the ES made a low under 5600.00, the futures rallied, jumped back above 5600.00, and fell right back into the 5600-5660 trading range.
The NQ seemed to shake off the rotational selling — and guess why? There was over $10 billion to buy on Friday’s NYSE 3:50 imbalance. It was very well orchestrated. The ES and NQ started selling off around 10:45 and dropped 52 points, making a low just after 12:30. They rallied up to the 5622 level, made a low at 5608.75 at 2:00, and then rallied 56.25 points up to 5665.00 at 4:00.
All the action is in the first hour and last hour.
Our Lean
The ES average July range is 6.19% from the previous month’s close, the average August range was 6.92%, and September is a 6.57% average range — or 371 points of the prior month’s close.
September has never taken out the July lows when July and August close higher. I know this sounds bullish — and to a degree, it is — but it also goes with a warning: There will be down days. Buybacks will slow after Sept 16th, so maybe some weakness after mid-month.
Our Lean: I like buying lower opens while in an uptrend. Selling gap-up opens work, but it is fighting the trend and if it does actually open higher, my concern is the buy stops that have been building up above 5660.
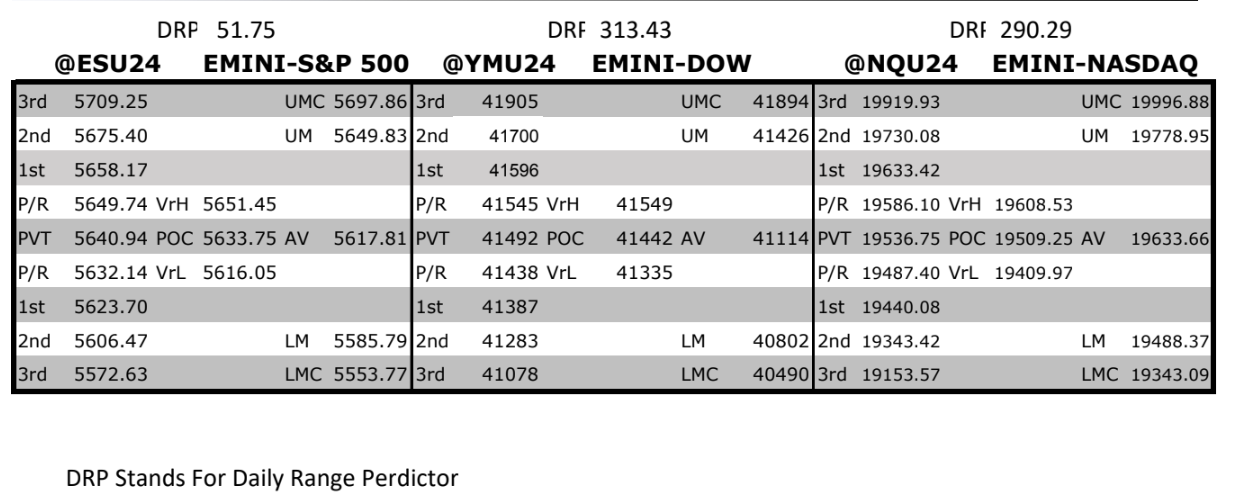
MrTopStep Levels:
Today you are going to get three opinions. I am going to go first because I asked Rich Miller from @HandelStats and Jeff Hirsch from @AlmanacTrader to give their views on the next two months. Before Rich said anything to me, I told him I don’t think the ES is going to go down hard in September or October and that any 50-point pullbacks should be brought into the third week of October. I pointed out all the back-and-fill patterns the ES has used on its recovery from its August 5th low. Remember the VIX traded a 14.46 low in August and made a high at 65.73 before closing Friday back at 15.
Now, for HandelStats.
“Since 1970, in the SPX, whenever the first two quarters have been positive, there has never been a down year. This pattern has occurred 23 times in the past 54 years, and the first two quarters this year were also up.
When both July and August followed suit with positive returns after an up first two quarters, this scenario has happened 14 times. In 13 of those instances, the September high surpassed both the July and August highs, and the September low was always higher than the July low. This year, the July low was 5390.95. The only exception when the September high did not exceed the July and August highs was in 1987.
Although the third quarter has been positive with these conditions, September has been a down month over half the times, and there have been two instances of negative fourth quarters.”
To learn more about Rich’s products, please visit them here.
Jeff Hirsch from Almanac Trader
Bull Still Intact But Wait for Fatter Pitch
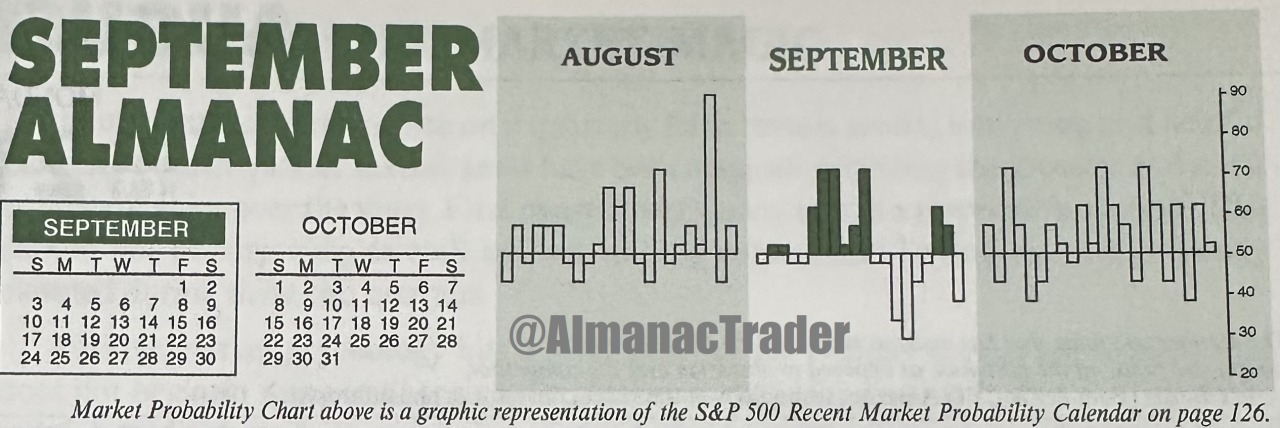
September seasonal weakness and Octoberphobia looms large. But we have been hearing a lot of chatter about the seasonal troubles this time of year, so our contrary antennae are purring that perhaps there is just a bit too much negativity. But with the lack of clarity about the economy, the election and the Fed’s next move on interest rates, we still expect some chop and sideways action over the next 60 days or so with a likely test of the lows. But another steep August-October correction three years in a row is less likely.
Bullish election forces remain at play, but September and October are two of the worst months of election years – even excluding 2008. October is the worst month of election years for DJIA, S&P 500 and NASDAQ. NASDAQ has been up only four times in election year October since 1971 and down the last four straight. Since 2000 DJIA is up only one out of six in both election year September and October, S&P is up twice in election year September and once in October.
We had a below average mid-July to early August election year drawdown of 8.5% on the S&P and 13.1% on NASDAQ, culminating in a mini flash crash and turnaround on August 5. Now the steep snapback rally that brought us to new all-time highs on DJIA and to within striking distance for Naz and S&P looks like it may have run its course. The market’s convention bounce may already be yielding to the realities of an uncertain election with all the gyrating economic data coming in, speculation on what the Fed will do at their next FOMC meeting on September 18 and other rhetoric swirling around The Street and financial media.
Seasonality is coming into its historically weakest period of the year while geopolitics remains tense in Russia and Ukraine, the Mideast and the Pacific Rim. But macrotrends, technicals, internals, the US economy and election year forces remain supportive. So be patient, we are well positioned and ready for the fatter pitch later in Q3 or early Q4.
With President Biden stepping aside, our Open Field election year is back in play. This does not mean we are heading into the red for the year, but it does suggest the market may continue to struggle over the next few months during the seasonal weak period and leading up to this now more uncertain election. But remember since 1952 there have been “Only Two Losses Last 7 Months of Election Years” (page 80 STA 2024). Any potential September/October market weakness could set up a solid Q4, end-of-year rally, most likely beginning after Election Day.
Folks can check out the rest of my service with a free trial at this link.
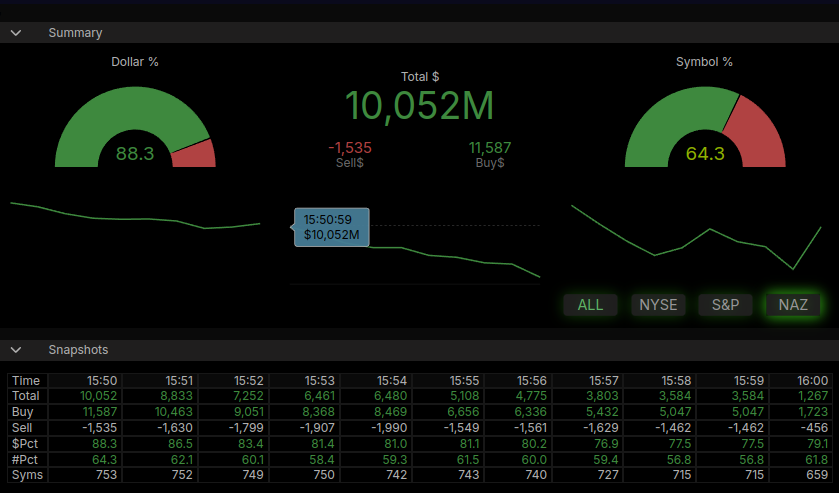
MiM and Daily Recap
ES Recap
After another weak close, the ES rallied up to 5639.75 and opened Friday’s regular session at 5631.25. After the open, the ES traded down to 5328.50 and then rallied up to 5642.75 at 9:45 a.m. It sold off to 5627.25, rallied to 5636.50, sold off again to a new low at 5627.50, and then rallied to a new high at 5646.00 at 10:04. The ES pulled back to 5629.25 at 10:28, rallied to a lower high by 3 ticks at 5645.25 at 10:44, and then dropped 16 points to 5604.25 at 11:36. It popped back up to 5619.75, and then sold off 25.50 points to the low of the day at 5594.25 at 12:30.
After the low, the ES rallied to 5621.75 at 1:04, pulled back to the 5609 area, made two small pullbacks, and then rallied to 5632.50 at 2:52. It pulled back to 5624.50 at 3:15, rallied to 5643.50 at 3:32, and traded 5642.75 as the 3:50 cash imbalance showed $10 billion to buy. It traded up to a new high of 5661.75 at 3:56 and settled at 5659.00 on the 4:00 cash close. After 4:00, the ES traded at 5665.00, sold off to 5653.25, rallied back to 5659.50, and settled at 5656.50, up 46.50 points or +0.83%. The NQ settled at 19,594.50, up 201.50 points or +1.04%. Crude oil (CLV4) settled at 73.65, down 2.26 points or -2.98%. The 10-year note (ZNZ4) settled at 113’195, down 0.085 points or -0.23%. Gold settled at 2,536.00, down 24.30 points or -0.95%, and Bitcoin (BTCU4) settled at 59,275, down 370 points or -0.63% on the day.
In the end, it looked like the ES was trying to break out on the upside from its two-week back-and-fill. In terms of the ES’s overall trade, volume was decent at 1.466 million contracts traded.
Technical Edge
-
NYSE Breadth: 75% Upside Volume
-
Nasdaq Breadth: 66% Upside Volume
-
Advance/Decline: 70% Advance
-
VIX: ~15
Guest Post — Tradrr
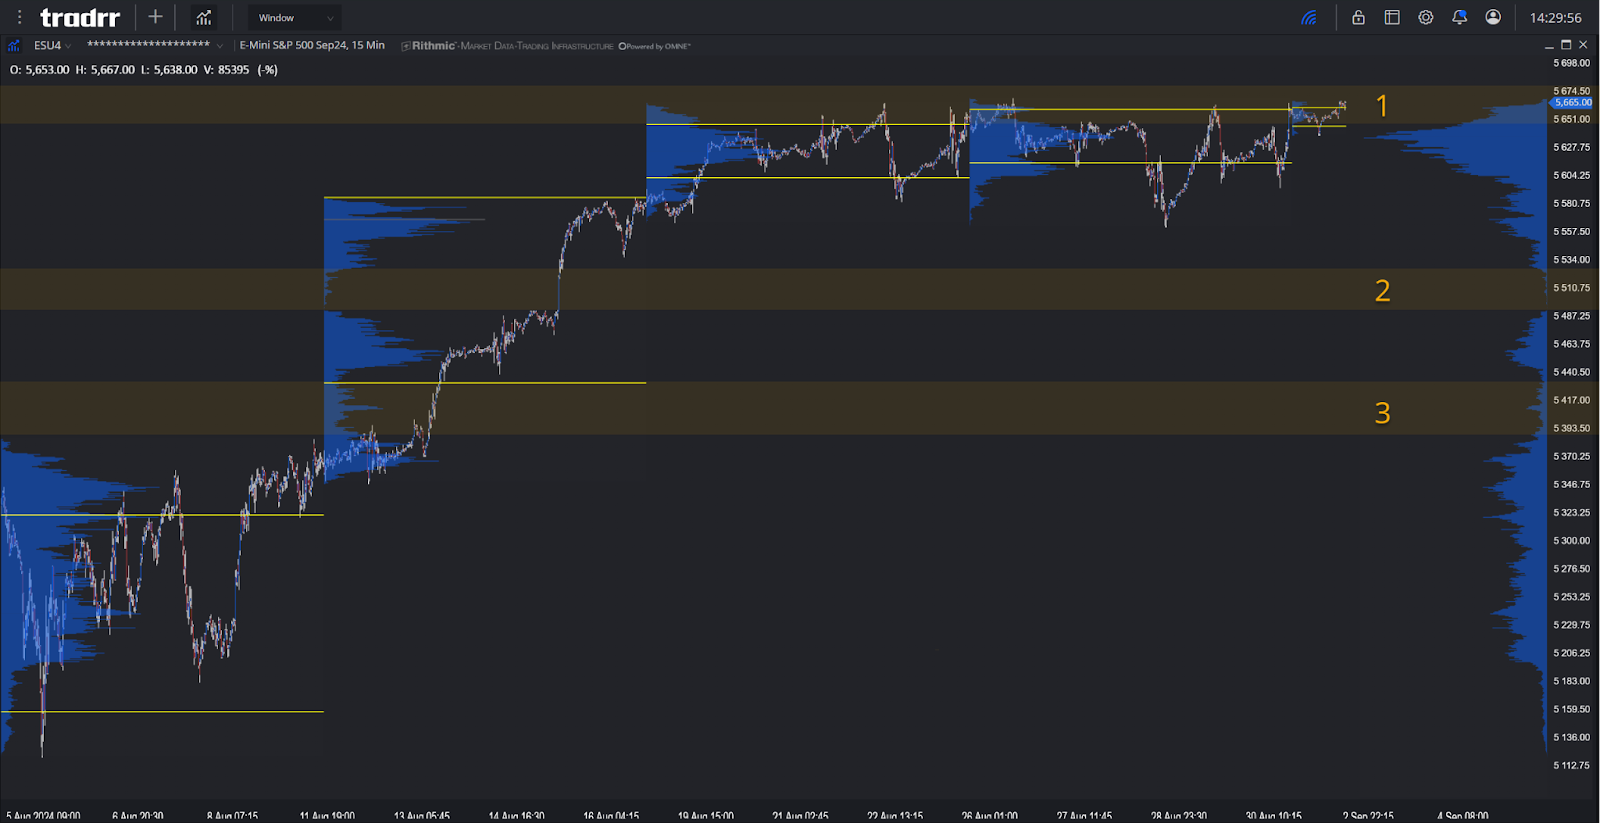
Shortened trading week with a clear P shaped profile with no excess established on the upside from the previous month starts this week near the highs.
1. Pushing through and building some nodes above Zone 1 can aid in the continuation of the trend established from the month of August more important now that summer ends and we begin more volume heavy months into the elections.
2/3. Zones 2 and 3 are both zones to watch for responsive/defensive Bulls and should they repair lead into some more ground to stand on with a clear target being the heavy built node that we are starting this week at. Had to consider with the established intent that the entirety of August is taken back but as its known the markets are capable of anything so be Flexible.
To learn more about Tradrr, please visit them here.
Economic Calendar
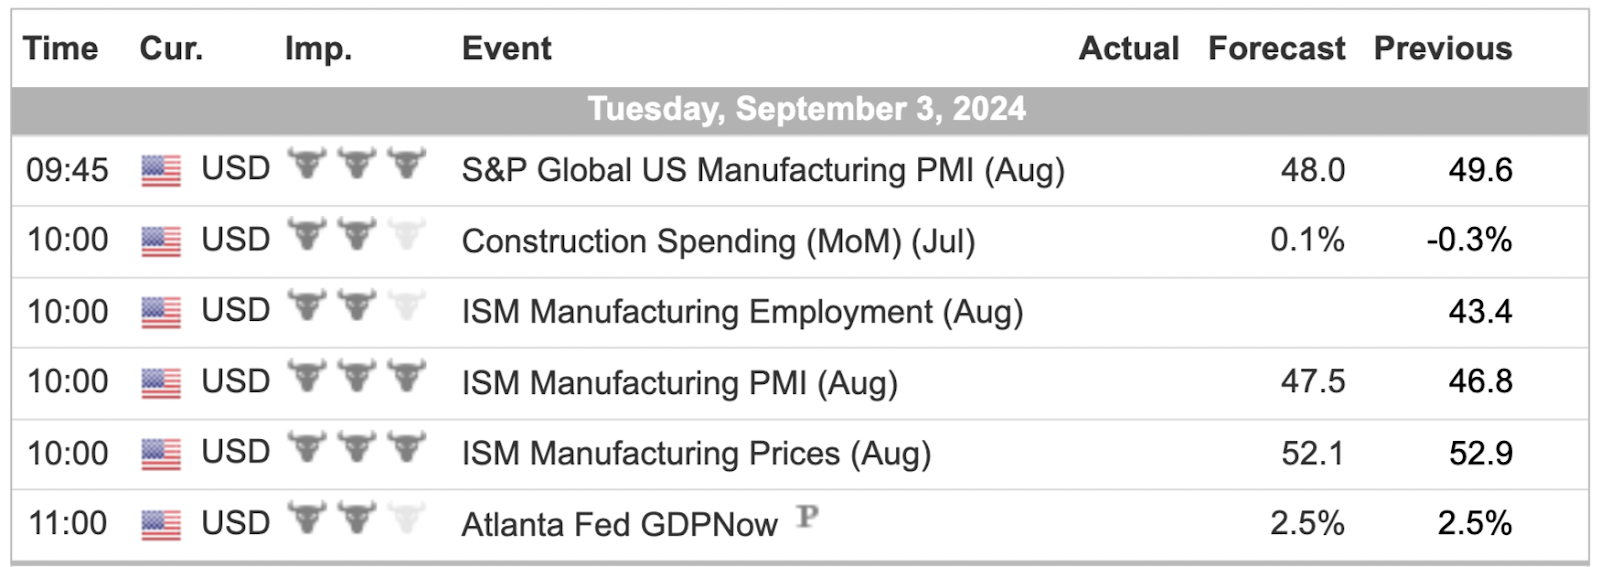
For a more complete Economic Calendar see: https://mrtopstep.com/economic-calendar/
Comments are closed