This post goes out as an email to our subscribers every day and is posted for free here around 2 PM ET. To get your real-time copy, sign up for the free or premium version here: Opening Print Subscribe.
April 15, 2026 | Read online
Buy Programs, Bank Beats, and No Fear — Market Grinding Back Toward the Highs
Follow @MrTopStep on Twitter and please share if you find our work valuable!
FREE Two-Week Offer for the Opening Print Premium. Open up the Lean and other premium features for the next Two Weeks!
Our View
Want to see something amazing? I didn’t take this from anywhere. I pulled the stocks and asked Grok to calculate:
Mag 7 Performance
-
Alphabet (GOOGL): Up $59.41 or +20.02%. (GOOG): Up 8 of the last 10, up $57.44 points or +19.41%.
-
Amazon (AMZN): Up 10 of the last 11, up $49.68 or +22.63%.
-
Apple (AAPL): Up 6, down 3, 1 unchanged, up $12.20 points or +4.93%.
-
META Platforms Inc (META): Up 10 of the last 11, up $136.77 or +23.71%.
-
Microsoft (MSFT): Up 6 of the last 11, up $36.34 points or +9.83%.
-
NVIDIA (NVDA): Up 10 of the last 10 days, up $31.34 or +17.66%.
-
Tesla Inc (TSLA): Up 6 of the last 10, up $8.92 or +2.88%.
Roughly the total market cap gain estimate for the Mag 7 over this ~10–11 day period: approximately +$1.1 trillion to +$1.4 trillion collective addition.
Breakdown of estimated market cap gains:
-
Meta (META): Strongest contributor — ~+$380–$410 billion (due to high % gain + large base).
-
Amazon (AMZN): ~+$580–$600 billion.
-
Alphabet (GOOGL/GOOG): ~+$750–$800 billion combined.
-
Nvidia (NVDA): ~+$800–$850 billion.
-
Microsoft (MSFT): ~+$270–$290 billion.
-
Apple (AAPL): ~+$190 billion.
-
Tesla (TSLA): ~+$35–$40 billion.
The Nasdaq Composite has outperformed the S&P 500 since the close on March 30 through the close on April, covering 11 trading days.
Index
Mar 30 Close
Apr 14 Close
Point Change
% Change
Outperformance
Nasdaq Composite
20794.64
23639.08
+2844.44
+13.68%
+3.85 pts
S&P 500
6343.72
6967.38
+623.66
+9.83%
Key Takeaways:
-
The Nasdaq Composite gained +13.68% over this ~11-trading-day period.
-
The S&P 500 gained +9.83% in the same window.
-
Nasdaq outperformed the S&P 500 by 3.85 percentage points.
This short-term outperformance was largely driven by the strong rebound in the Magnificent 7 stocks (especially Meta, Amazon, Alphabet, and Nvidia), which carry much heavier weight in the Nasdaq. My guess is there was more liquidation and hedging on the way down and a larger unwind on the way back up, but clearly the Nasdaq has been the leader.
Our View
The front-month ESM26 contract high was set on 01/28/26 at 7097.00, and yesterday it made a high at 7008.00; that is only 89 points, or 1.27%, away. So far, there have been positive bank earnings, and this morning BofA and Morgan Stanley report earnings, which I think will also be good.
Traders continue to bet that a deal will be struck in the Middle East; if the headlines continue today that the U.S. and Iran are going to meet again in Islamabad, that also will be a positive. Additionally, Friday is the April expiration, which historically is mildly bullish.
Our Lean
I know the markets are extended, but as long as the headlines continue to say the U.S./Iran negotiations are still on and volume remains low, I think the ES can still go higher.
Our lean: You can sell the early rallies and buy weakness, or just be patient and buy the pullbacks, which is the current trend.
Claude Ai Market Profile levels
I added more levels today as yesterday’s were too far apart.
7139.58 Classic R3 Extended target if R2 breaks
7097.00 ATH Dataset all-time high Jan 28
7089–7097 Single print Unfilled gap — fill target on breakout
7035–7072 R2 cluster 26 session touches — heavy supply
7033.92 Classic R2 Aligns with R2 cluster base
7035.00 Swing high Feb 25 swing — base of R2 cluster
7012–7028 R1 cluster 16 touches — price knocking now
7011.44 Cam CR4 Short trigger above, long below
7008.00 IB High Short on failure, long on breakout
6978.33 Classic R1 First classic resistance
6967.09 Cam CR3 Intraday resistance
6964.00 IB Mid Balance pivot — first pullback target
6952.31 Cam CR2 Minor intraday resistance
6937.53 Cam CR1 Minor intraday resistance
6920.25 IB Low Aligns with single print top
6907.97 Cam CS1 Minor intraday support
6893.19 Cam CS2 Minor intraday support
6878.41 Cam CS3 Intraday support — buy zone
6872.67 Classic PP Daily pivot point
6834.06 Cam CS4 CS4 — extended support
7008.00 Month high (Apr) Current month high — being tested
6963.25 Prev month high March high — resistance / support
6888.00 Prev week high Wk 15 high — now support
6855.25 Prev week close Wk 15 close
6570.75 Prev month close March close
6567.00 Prev week low Wk 15 low — major support
6570.75 Prev month close March close
6503.75 Month low (Apr) April monthly low — deep support
6353.25 Prev month low March low — structural floor
6888–6920 Single print Fill target — support on retest
6928.50 VAH 3-day 3-day value top
6885.00 VAH 5-day Former short zone → first support
6867.00 POC 3 & 5-day Confluence — strong pullback bid
6881.25 Swing low Wk 9 swing low
6822.00 VAH composite Former resistance → structural support
6803.50 Swing low Feb 6 swing low
6817.08 Classic S1 Classic daily S1
6775.50 VAL 3-day 3-day value low
6740.00 VAL 5-day 5-day value low — strong long entry
6711.42 Classic S2 Classic daily S2
6698.25 VAH 20-day 20-day value area high
6680.00 Swing low Oct 17 swing low — longer-term
6655.83 Classic S3 Classic daily S3
6627.00 POC composite Heaviest volume node — dominant anchor
6531.00 VAL 60-day 60-day value low
Overview
ES settled at 7004.75, highest close in 20 sessions and an outside day above the prior high of 6928.25. Price is pressing the R1 supply cluster (7012–7028) with the ATH at 7097 now 92.25 points overhead. Session was a narrow balance day following Monday’s 161-point expansion — below-average range and volume signal digestion, not extension.
Resistance
CR4 at 7011.44 is the immediate short trigger — just 6.69 pts above settlement. The R1 cluster (7012–7028, 16 touches) is the first wall. Above that, Classic R2 at 7033.92 converges with R2 cluster base at 7035, a 26-touch supply zone extending to 7072. The ATH at 7097 and single-print gap (7089–7097) cap the range.
CR4 7011
R1 7012–7028
R2 7035–7072
SP gap 7089–7097
ATH 7097
Support
IB Low at 6920.25 aligns with the top of the single-print gap (6888–6920) — the primary fill target on any reversal. The 5-day POC at 6867 and CS3 at 6878 form the mean-reversion cluster. Prior week high at 6888 is the key structural line — a close below turns the weekly structure. VAH composite at 6822 and VAL 5-day at 6740 are the next layers. VAH 20-day at 6698 is the floor of the 6700–7150 window.
IB Low 6920
SP gap 6888–6920
Prev wk H 6888
POC 5d 6867
VAH comp 6822
VAL 5d 6740
VAH 20d 6698
Scenarios
Bull — Hold and close above 7028 on volume targets R2 base at 7035, then 7072, then ATH 7097.
Bear — Rejection at CR4 / IB High (7008–7011), return below 6920 fills the single-print gap. Close below 6888 (prev week high) is the structural flip signal, opening 6867 → 6822 → 6740.
Neutral — Chop between IB Low 6920 and IB High 7008, pivoting around IB mid 6964 / CR3 6967 until a volume catalyst resolves direction.

If you’ve ever wanted to learn about trading and hedging in the ags, or sharpen your trader’s mindset, this is where you need to be today at noon.
We’re excited to introduce our newest contributors as they debut a brand new show on the PitbullTraders YouTube stream.
Join us live at 12pm ET — either in our Pit trading room or on our YouTube channel. Don’t miss it.
Don’t have access to our Pit room? Membership is free!
Market Recap
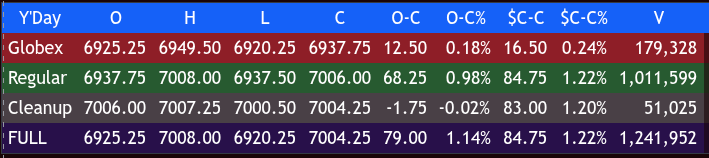
The ES traded a 6920.25 low on Globex, rallied up to 6949.50, and opened Tuesday’s regular session at 6937.75, up 16.50 points or +0.24%.
After the open, the ES rallied up to a high of 6961.25 at 9:45 AM, did a small back and fill to a low of 6953.50 at 10:00 AM, and then rallied up to 6972.25 at 10:15 AM. After a back and fill to 6968.00 at 10:30 AM, it pushed up to 6982.50 at 10:45 AM, sold off down to 6978.50 at 11:00 AM, rallied up to 6992.50 at 11:15 AM, dipped to 6988.00 at 11:30 AM, and reached a high of 6995.50 at 11:45 AM.
After holding a low of 6989.75 at 12:00 PM, price rallied to 7001.00 at 12:15 PM, rotated down to 6994.00 at 12:30 PM, hit 6998.75 at 12:45 PM, sold off down to 6995.50, and rallied up to 7003.25 at 1:30 PM.
After the peak, the ES fell to 6994.50 at 1:45 PM, saw a minor bounce to 6998.00 at 2:00 PM, and tagged a lower low of 6983.25 at 2:25 PM. After the low, the ES then traded up to 7008.00 at 3:30 PM, pulled back to 6899.25, rallied back up to 7006.25, and traded 7002.50 as the 3:50 PM cash imbalance showed flat to $400 million for sale. It then sold off down to 6897.00, rallied up to 7007.00, and traded 7006.00 on the 4:00 PM cash close.
After 4:00 PM, the ES chopped in a narrow range and settled at 7004.25, up 82 points, or +1.18%, and up 237.25 points from Sunday night’s 6767.00 Globex low. The NQ settled at 25996.75, up 453.25 points, or up 1092.25 points from Sunday night’s 24904.50 Globex low. The YM finished at 48755, up 330 points or +0.68%, up 1221 points from Sunday night’s 47534 Globex low, and the RTY closed at 2718.10, up 35.80 points or +1.33%, up 126.30 points from Sunday night’s 2591.80 Globex low.
In the end, it was another up day on a list of many. In terms of the ES and NQ’s overall tone, every little pullback was bought. In terms of the ES’s overall trade, the higher the ES goes, the lower the volume — only 1.24 million contracts traded.
This is a giant shell game of headlines. I asked Gemini how many news-related stories there were over the last 24 hours related to keywords using Iran, Trump, blockade, oil embargo, or the Strait of Hormuz, and it was around 1700. The markets are so hyper-focused; you can’t pick up your phone, look at the internet, or turn on the TV without some mention of the conflict.
Yesterday’s main headline was that diplomats were working to arrange a new round of talks between the United States and Iran. President Donald Trump said a second round of talks could happen “over the next two days,” telling the New York Post the negotiations could be held again in Islamabad, the capital of Pakistan. Personally, I just want it over.
Earnings, Economic Reports, and Fed Speak
-
6:30 AM: First Horizon and M&T Bank report earnings.
-
6:45 AM: Bank of America reports earnings.
-
7:30 AM: Morgan Stanley reports earnings.
-
8:30 AM: Import price index, Empire State manufacturing survey. Fed Governor Michael Barr speaks. Cleveland Fed President Beth Hammack TV appearance.
-
10:00 AM: Homebuilder confidence index.
-
1:45 PM: Fed Vice Chair for Supervision Michelle Bowman speaks.
-
2:00 PM: Fed Beige Book.
Guest Posts
Guest Posts — Polaris Trading Group
🟢 Bull Case — Buyers Stay in Control
Acceptance above 7000 ±5
If buyers defend value north of this pivot, upside continuation remains viable.
🎯 Initial Upside Objectives
-
7020
-
7032
-
7041
Expectations:
-
Orderly trade
-
Controlled tempo
-
Clean inventory
-
Trend continuation
🔴 Bear Case — Rotation / Reset
Acceptance below 7000 ±5
Failure to hold the pivot opens the door for rotation and balance repair.
🎯 Initial Downside Objectives
-
6985
-
6975
-
6955
Expectations:
-
Increased two-sided trade
-
Inventory correction
-
Balance development
📊 Key Reference Levels
PVA High Edge: 7008
PVA Low Edge: 6972
Prior POC: 7001
⚠️ Tactical Takeaway
Of course, nothing changes for PTG…Simply follow your plan. Take only Triple A setups and manage the $risk. ALWAYS HAVE HARD STOP-LOSSES in-place on the exchange.
PTG’s Primary Directive (PD) is to ALWAYS STAY IN ALIGNMENT with the DOMINANT FORCE.
S&P 500 (ES)

— PTG
MOC Recap
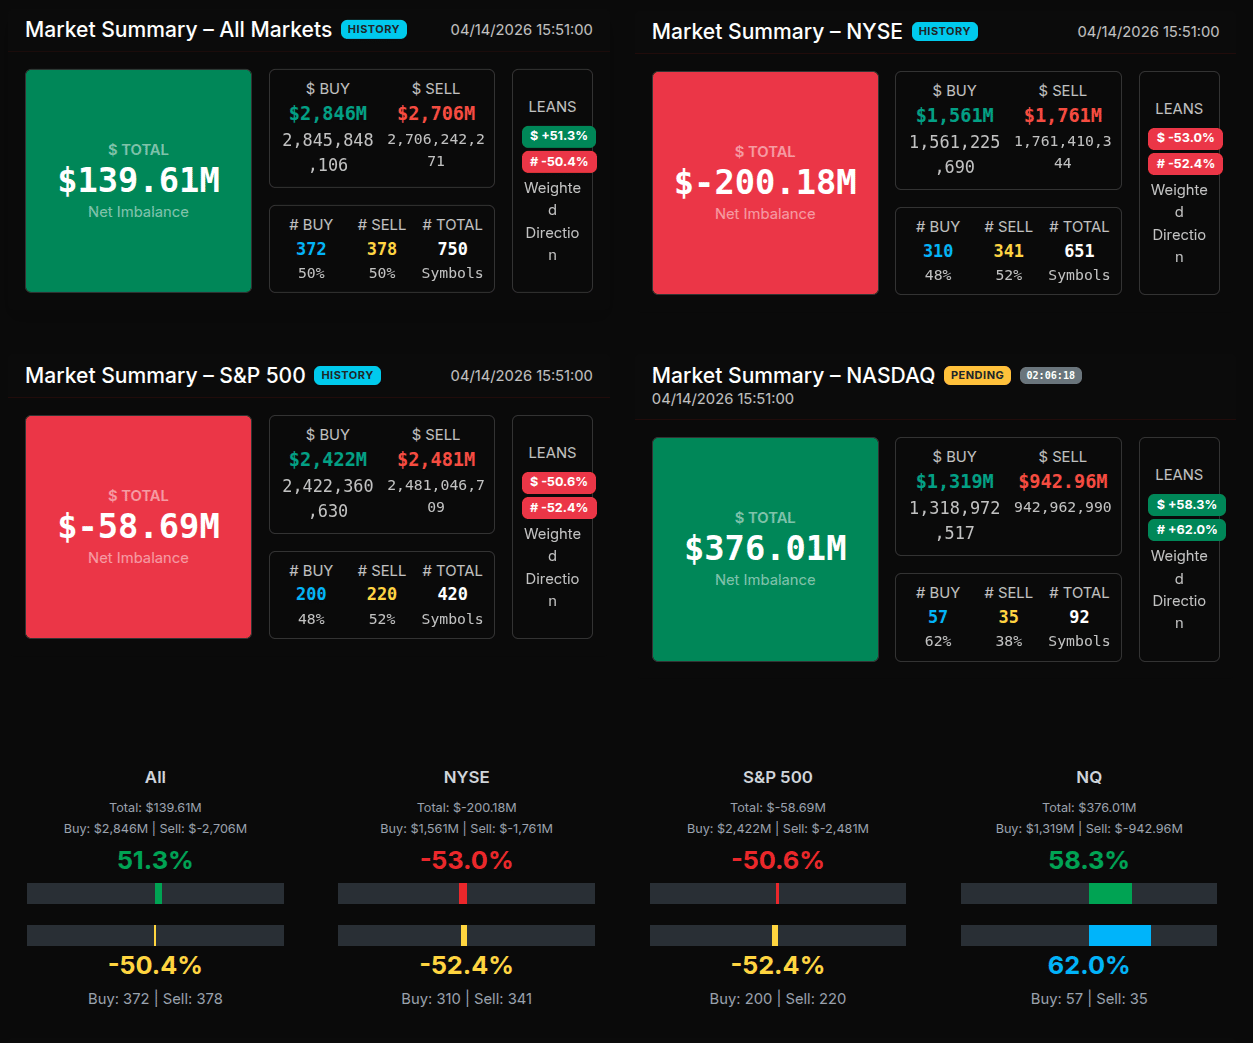
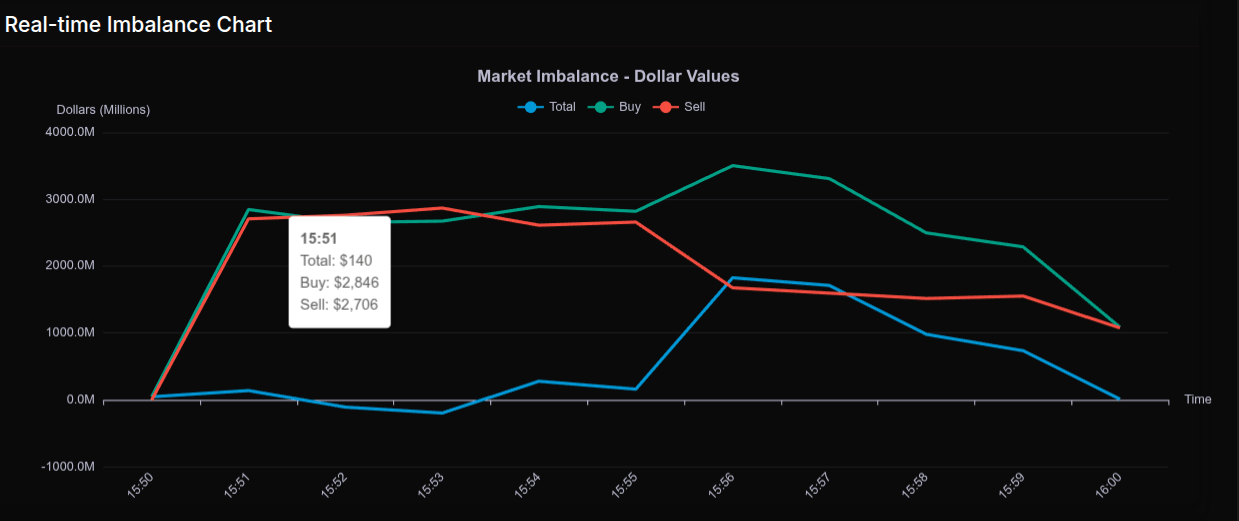
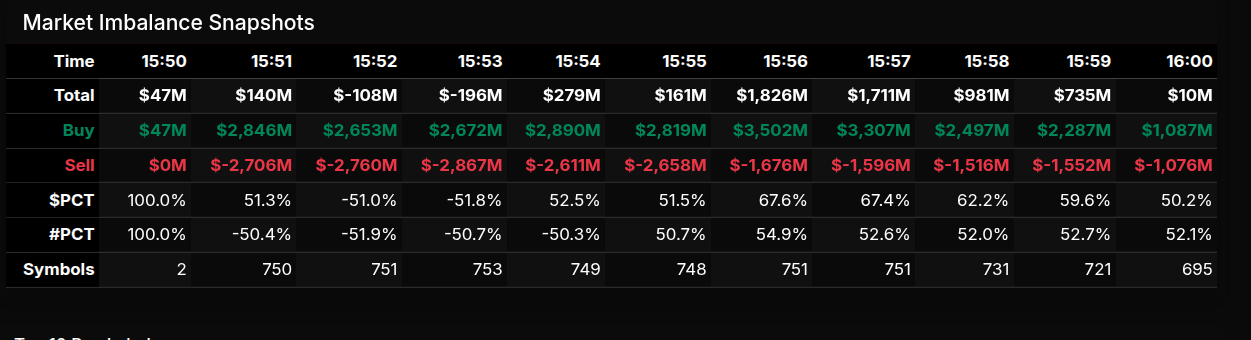
The Market-on-Close (MOC) session opened with immediate strength, transitioning quickly from a flat to an aggressively bid environment. At 15:50, the market showed a negligible imbalance (-$9M), but by 15:51, a sharp influx of buy programs hit, pushing net imbalance to +$3.14B. This set the tone early—this was not a gradual accumulation, but a decisive institutional bid.
From 15:51 through 15:55, the market maintained strong buy-side control, with total imbalances peaking near +$2.17B and buy percentages consistently in the mid-to-high 60% range. These readings (>+66%) signal broad, non-rotational accumulation rather than sector-specific repositioning. The participation count also remained elevated (~750+ symbols), reinforcing that this was a market-wide bid rather than isolated flows.
However, the transition phase began post-15:55. Buy pressure steadily declined from $3.7B to under $1B into the close, while sell pressure stabilized. By 16:00, the imbalance flipped to -$186M with a -54.8% lean—clearly a late unwind or counter-flow into the close.
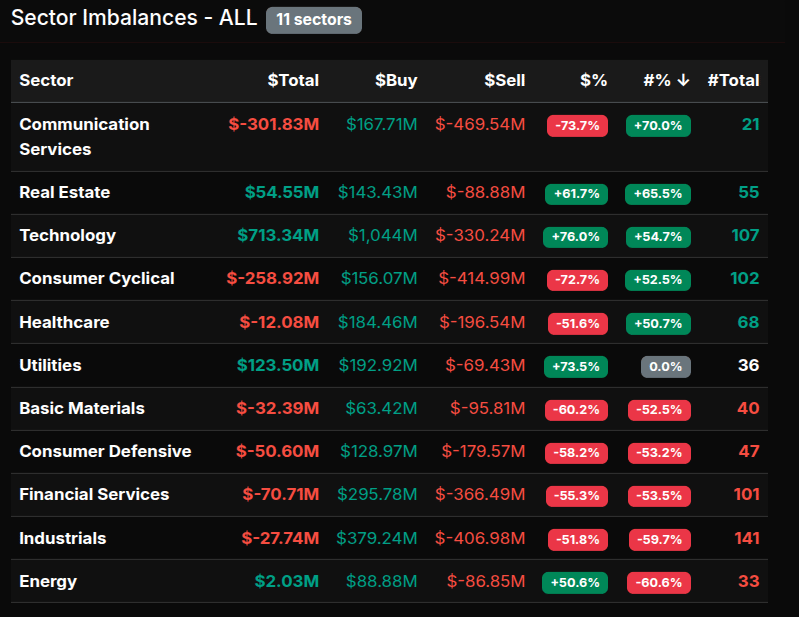
Sector flows confirmed that the early session strength was broadly distributed. Technology (+77.9%), Communication Services (+82.5%), and Energy (+74.6%) all showed strong buy-side dominance.
On the sell side, Financials (-65.3% #lean), Healthcare (-50.8%), and Utilities (-71.4%) stood out. Utilities in particular crossed the -66% threshold, indicating a more wholesale distribution rather than rotation. Financials were close to that threshold, suggesting persistent institutional selling pressure.
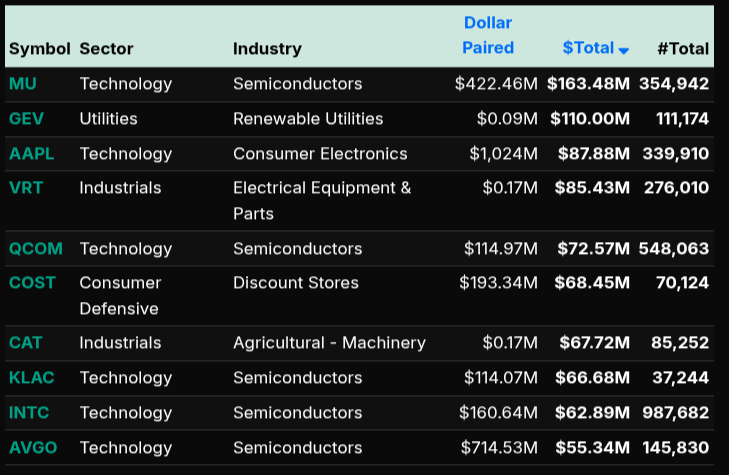
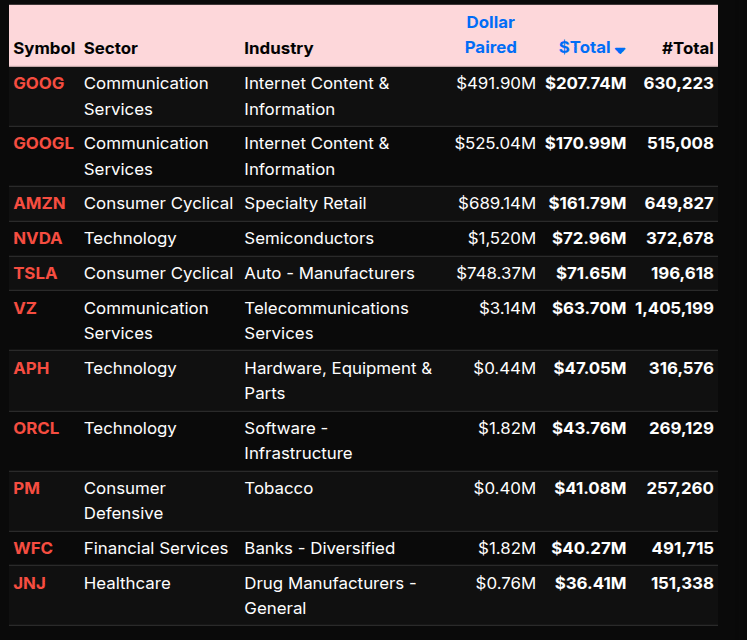
At the symbol level, the tape was led by mega-cap participation. AAPL (+$351M), NVDA (+$187M), and AVGO (+$71M) dominated the buy side, reinforcing the tech-led bid. Meanwhile, names like UNH and CVS contributed to healthcare weakness.
In summary, the MOC reflected a strong early institutional buy program that gradually faded, transitioning into a more balanced and slightly defensive close with selective sector liquidation.
Technical Edge
Fair Values for April15, 2026:
-
SP: 37.76
-
NQ: 161.33
-
Dow: 192.36
Daily Breadth Data 📊
For Tuesday, April 14, 2026
• NYSE Breadth: 61% Upside Volume
• Nasdaq Breadth: 78% Upside Volume
• Total Breadth: 72% Upside Volume
• NYSE Advance/Decline: 66% Advance
• Nasdaq Advance/Decline: 69% Advance
• Total Advance/Decline: 68% Advance
• NYSE New Highs/New Lows: 126 / 9
• Nasdaq New Highs/New Lows: 288 / 65
• NYSE TRIN: 1.28
• Nasdaq TRIN: 0.65
Weekly Breadth Data 📈
For the week ending Friday, April 10, 2026
• NYSE Breadth: 55% Upside Volume
• Nasdaq Breadth: 67% Upside Volume
• Total Breadth: 63% Upside Volume
• NYSE Advance/Decline: 68% Advance
• Nasdaq Advance/Decline: 40% Advance
• Total Advance/Decline: 51% Advance
• NYSE New Highs/New Lows: 220 / 122
• Nasdaq New Highs/New Lows: 410 / 419
• NYSE TRIN: 1.77
• Nasdaq TRIN: 0.33

If you’ve ever wanted to learn about trading and hedging in the ags, or sharpen your trader’s mindset, this is where you need to be today at noon.
We’re excited to introduce our newest contributors as they debut a brand new show on the PitbullTraders YouTube stream.
Join us live at 12pm ET — either in our Pit trading room or on our YouTube channel. Don’t miss it.
Don’t have access to our Pit room? Membership is free!
Trading Room Summaries
Polaris Trading Group Summary – Tuesday, April 14, 2026
Tuesday was a highly successful, trend-driven “monster” day where PTG’s levels and strategy played out with exceptional precision from overnight through the close.
Overnight & Pre-Market Edge
David set the tone early, highlighting that both ES and NQ had already fulfilled upside targets overnight:
-
ES hit 6943
-
NQ hit 25680
This reinforced the bullish Cycle Day 2 context, with clear guidance:
-
Stay long above 6920 ±5 (ES)
-
Stay long above 25530 ±10 (NQ)
-
Expect continuation if value holds high
Key takeaway: Preparation and trust in the Daily Trade Strategy gave members a strong directional bias before the open.
Market Open & Morning Action
The market opened with strength and never looked back:
-
Early reaction: “sweet start”
-
Key level 6959–6961 (Cycle Day 2 penetration zone) came into play
-
Confluence noted with GEX level at 6960
Despite expectations of a reaction at these levels, price continued through without meaningful rejection.
Lesson: Strong markets often push through resistance—momentum overrides typical reaction trades.
Midday – Precision Targets Hit
This is where PTG levels delivered clean execution:
-
Money Box target 6972 fulfilled
-
6969.75 tagged shortly after
-
Internals confirmed strength: no reversal indications
Attempts to fade were ineffective.
Lesson: When internals are strong, fading becomes low probability—continuation is the higher-quality trade.
Afternoon – Trend Acceleration
The move evolved into what David called:
“a back-to-back Monster Super Cycle”
-
Shorts were squeezed throughout the session
-
Market maintained one-directional strength
-
ES and NQ both produced home run trade opportunities
Late Day Precision
-
Upside target 7008 identified
-
Hit to the tick into the close
A clean finish to a fully directional session.
Key Lessons from the Day
-
Preparation led to strong directional confidence
-
Trend days reward staying with momentum, not fading
-
PTG levels (Cycle Day and Money Box) provided precise targets
-
Risk management mindset reinforced (“best loser wins”)
Discovery Trading Group Room Preview – Wednesday, April 15, 2026
Macro / Geopolitics
-
Iran conflict de-escalation narrative building
-
Trump signaling ceasefire extension + possible peace talks within days
-
Oil pressure easing on reduced escalation risk
-
Still uncertainty: mixed reports (tanker movement, Israel ongoing ops)
Policy / Tariffs
-
Supreme Court setback on tariffs → temporary 10% tariff in place
-
Section 301 investigations could bring tariffs back by early July
-
CAPE system launching to refund ~$166M in tariffs to importers
Tech / AI / Semis
-
ASML beat + raised 2026 outlook → strong AI chip demand
-
NVDA announced open-source AI tools for quantum computing
-
Quantum space bid on growth expectations
Earnings / Events
-
Premarket: ASML, BAC, MS, PNC, MTB, PGR
-
After close: JBHT, KMI
-
Tomorrow: TSM, PEP, SCHW, USB, others
-
Data: PPI (8:30), Beige Book (2:00)
-
Fed speakers throughout day
Positioning / Flow
-
Whale bias: leaning bearish into PPI
-
Overnight large trader volume: light
Market Structure (ES)
-
Grinding higher toward ATH
-
Upside vol likely compresses near 7100
-
5-day ATR: ~113.75
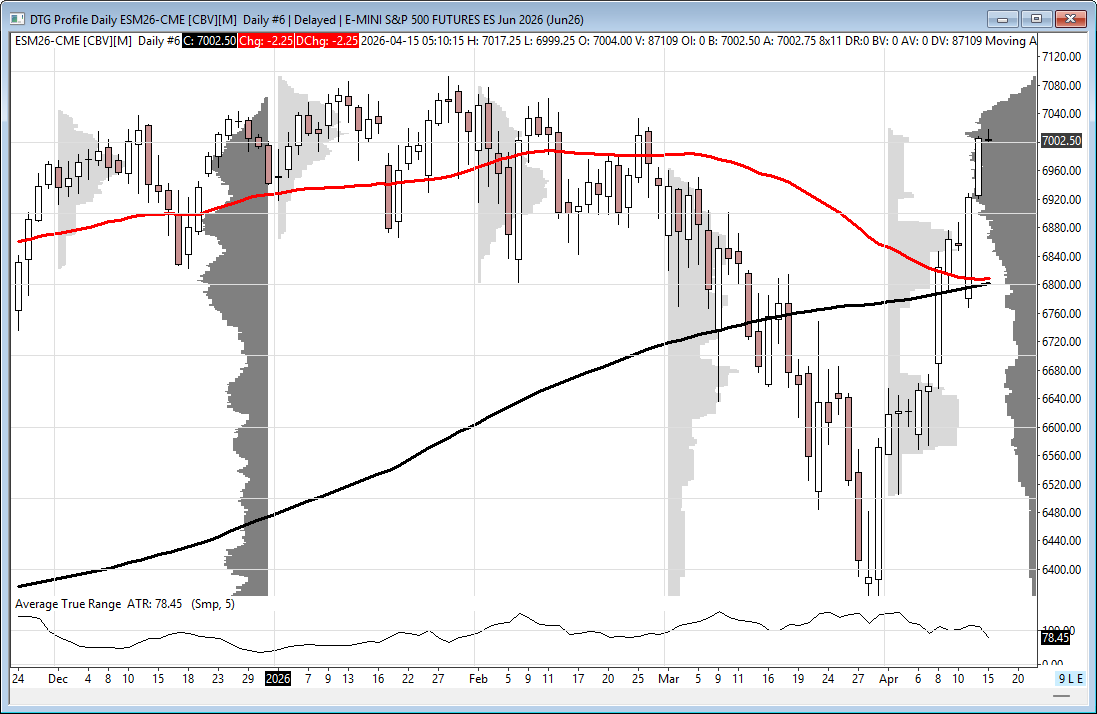
Trend / Technicals
-
50DMA (6808) crossed above 200DMA (6801.5) → bullish signal
-
Risk: could reverse on pullback this week
-
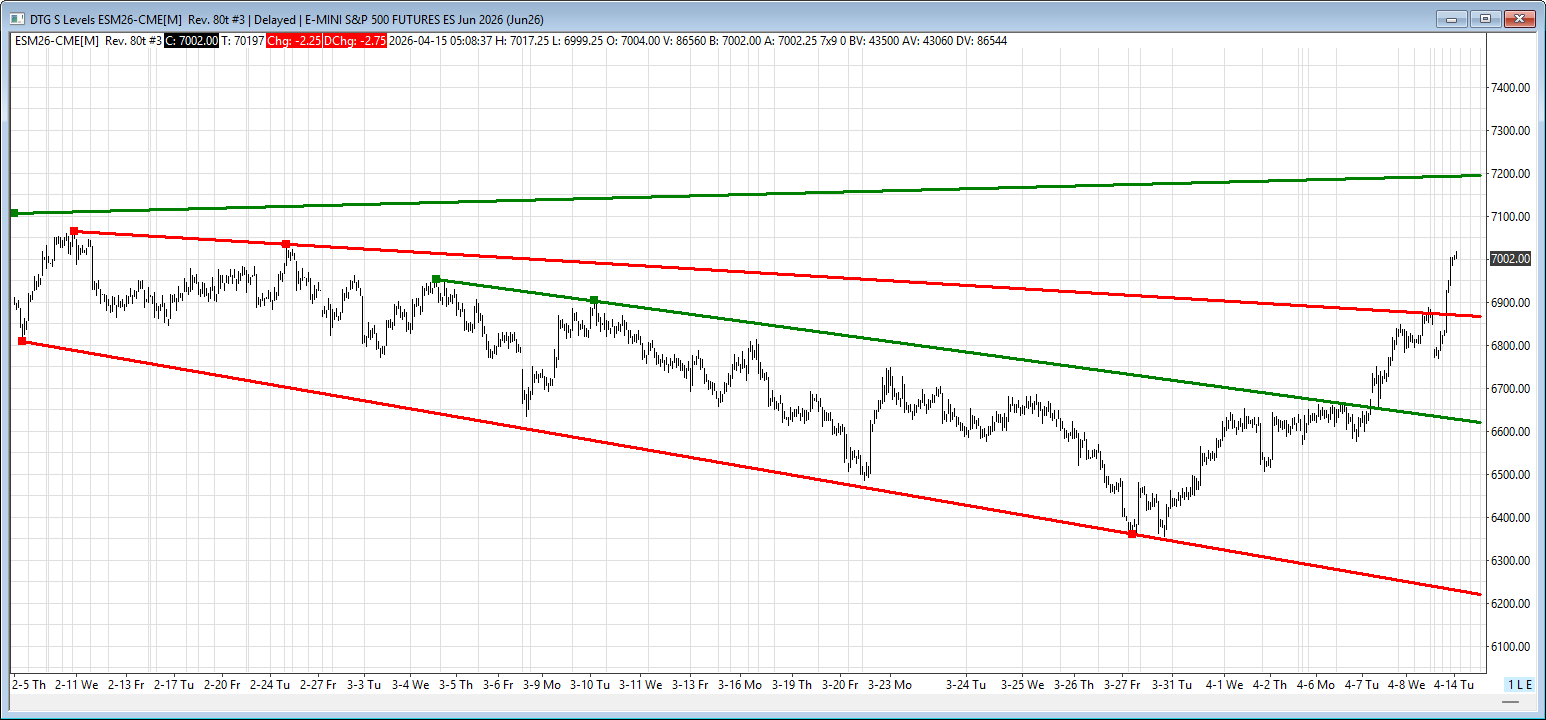
Trendline structure unchanged, room both ways
Key Levels
-
Resistance: 7195–7200
-
Supports: 6880s / 6620s / 6220s
Summary
-
Macro tailwind (geopolitics + AI)
-
Near-term caution into data with slight bearish positioning bias
Affiliate Disclosure: This newsletter may contain affiliate links, which means we may earn a commission if you click through and make a purchase. This comes at no additional cost to you and helps us continue providing valuable content. We only recommend products or services we genuinely believe in. Thank you for your support!
Disclaimer: Charts and analysis are for discussion and education purposes only. I am not a financial advisor, do not give financial advice and am not recommending the buying or selling of any security.
Remember: Not all setups will trigger. Not all setups will be profitable. Not all setups should be taken. These are simply the setups that I have put together for years on my own and what I watch as part of my own “game plan” coming into each day. Good luck!
This post goes out as an email to our subscribers every day and is posted for free here around 2 PM ET. To get your real-time copy, sign up for the free or premium version here: Opening Print Subscribe.
Comments are closed