This post goes out as an email to our subscribers every day and is posted for free here around 2 PM ET. To get your real-time copy, sign up for the free or premium version here: Opening Print Subscribe.
Buy the Fear, Fade the Screams: Pit Lean for a Spooky Opex
Follow @MrTopStep on Twitter and please share if you find our work valuable!
Our View
The ES traded up to 6746.25 on Globex and opened Thursday’s regular session at 6715.25. It rallied up to 6744.25 at 9:45, sold off down to 6717.25, rallied up to 6750.50, pulled back to 6728.00 at 11:03, made a lower high at 6743.00, and then dropped 96 points down to 6654.50 at 12:45 as the regional banks fell.
After the low, the ES made a series of higher lows and then rallied 50.50 points up to 6705.00 at 1:15. It then dropped 73 points down to 6632.00 at 2:33, rallied up to 6671.00 at 3:09, and sold off down to a higher low of 6641.00 at 3:21. The ES traded back up to 6672.25 at 3:51 after the 3:50 imbalance showed $1.2 billion to sell. It traded
6668.50 on the 4:00 cash close, sold off down to 6651.00 at 4:12, and settled at 6668.75, down 46.25 points or -0.69%.
The NQ settled at 24,831.25, down 93.25 points or -0.37%.
December silver traded up to a new high on Globex at $53.765 and has been up five days in a row. December gold (GCZ25) traded up to a new high of $4,392.00 on Globex. If it closes higher today, it will have been up 18 of the last 21 sessions or 10 of the last 11.
Bitcoin (BTZ25) has been down six days in a row, currently at 108.990, down 3,150 or -2.79%, for a total drop of 13.5%.
The DXY (Dollar Index) has been down four of the last five sessions and settled at 98.34, down 0.93% over the last three sessions.
Last but not least, the VIX settled at 15.29 on 09/26/25, when it fell -8.66%. Since then, the VIX has closed higher 10 out of the last 15 sessions for a gain of 76.124%, closing at the highest level since 04/24/25.
In the end, the spooky month of October is living up to its name. In terms of the ES’s overall tone, it was another reversal day. As for the ES’s overall trade, volume was steady all day with a total of 2.158 million contracts traded.
Delayed Reaction
Reports of stress in regional banks intensified following the bankruptcy of auto parts maker First Brands. Concerns were heightened by comments from JPMorgan Chase CEO Jamie Dimon and disclosures of losses related to the defunct subprime lender.
On Tuesday, during an earnings call, CEO Jamie Dimon invoked the “cockroach theory,” stating, “When you see one cockroach, there are probably more.” JPMorgan also disclosed losses of $170 million related to loans made to Tricolor, a subprime lender that had gone bankrupt. This disclosure and Dimon’s statement immediately hit all the major news sources.
On Wednesday, news broke that Zions Bancorporation and Western Alliance were also impacted by Tricolor’s bankruptcy. By yesterday, multiple news outlets, including CNBC, Bloomberg, and Reuters, had begun reporting on the fallout, with many making comparisons to the 2008 credit crisis.
CNBC reported on regional banks and Jefferies tanking amid sour loan concerns. The entire regional banking sector sold off yesterday as reflected by the 6.1% drop in the SPDR S&P Regional Banking ETF (KRE). Notable declines included:
-
Zions Bancorporation (ZION): Shares dropped 13% after disclosing a significant charge-off and announcing a provision for credit losses.
-
Western Alliance Bancorporation (WAL): Fell 11% following a lawsuit against a borrower for alleged fraud.
-
Jefferies Financial Group (JEF): Shares dropped 10%, down 25% over the past month due to exposure to a bankrupt auto parts maker.
Other banks with notable declines:
-
Flagstar Financial (FBC): -7.3%
-
Banc of California Inc. (BANC): -8.3%
-
Webster Financial (WBS): -7.7%
-
Metropolitan Bank Holding (MCB): -8.7%
-
Axos Financial (AX): -8.5%
-
Bank OZK (OZK): -6.0%
I don’t know the exact number, but this is not on the scale of the Silicon Valley Bank collapse. Still, it’s big enough to get the public all wound up about a 2008-style credit crisis. This is also how things can ‘spin’ out of control, too.
Do I think that’s happening? No—but if you throw in a few more U.S. or Chinese tariff threats, that’s another story.
On Tap
There are no economic reports or Fed speak today, but it is the October options expiration.
Goldman Sachs Equity Research:
The AI Spending Boom Is Not Too Big:
Since the start of September, OpenAI has announced a $300bn deal with Oracle, a $100bn investment from Nvidia, a strategic partnership with AMD to deploy 6GW of GPUs, and a strategic partnership with Broadcom to deploy 10GW of custom AI chips. Other US hyperscalers have also highlighted new investments in 2025H2, albeit at a slower pace.
Full Report
Our View
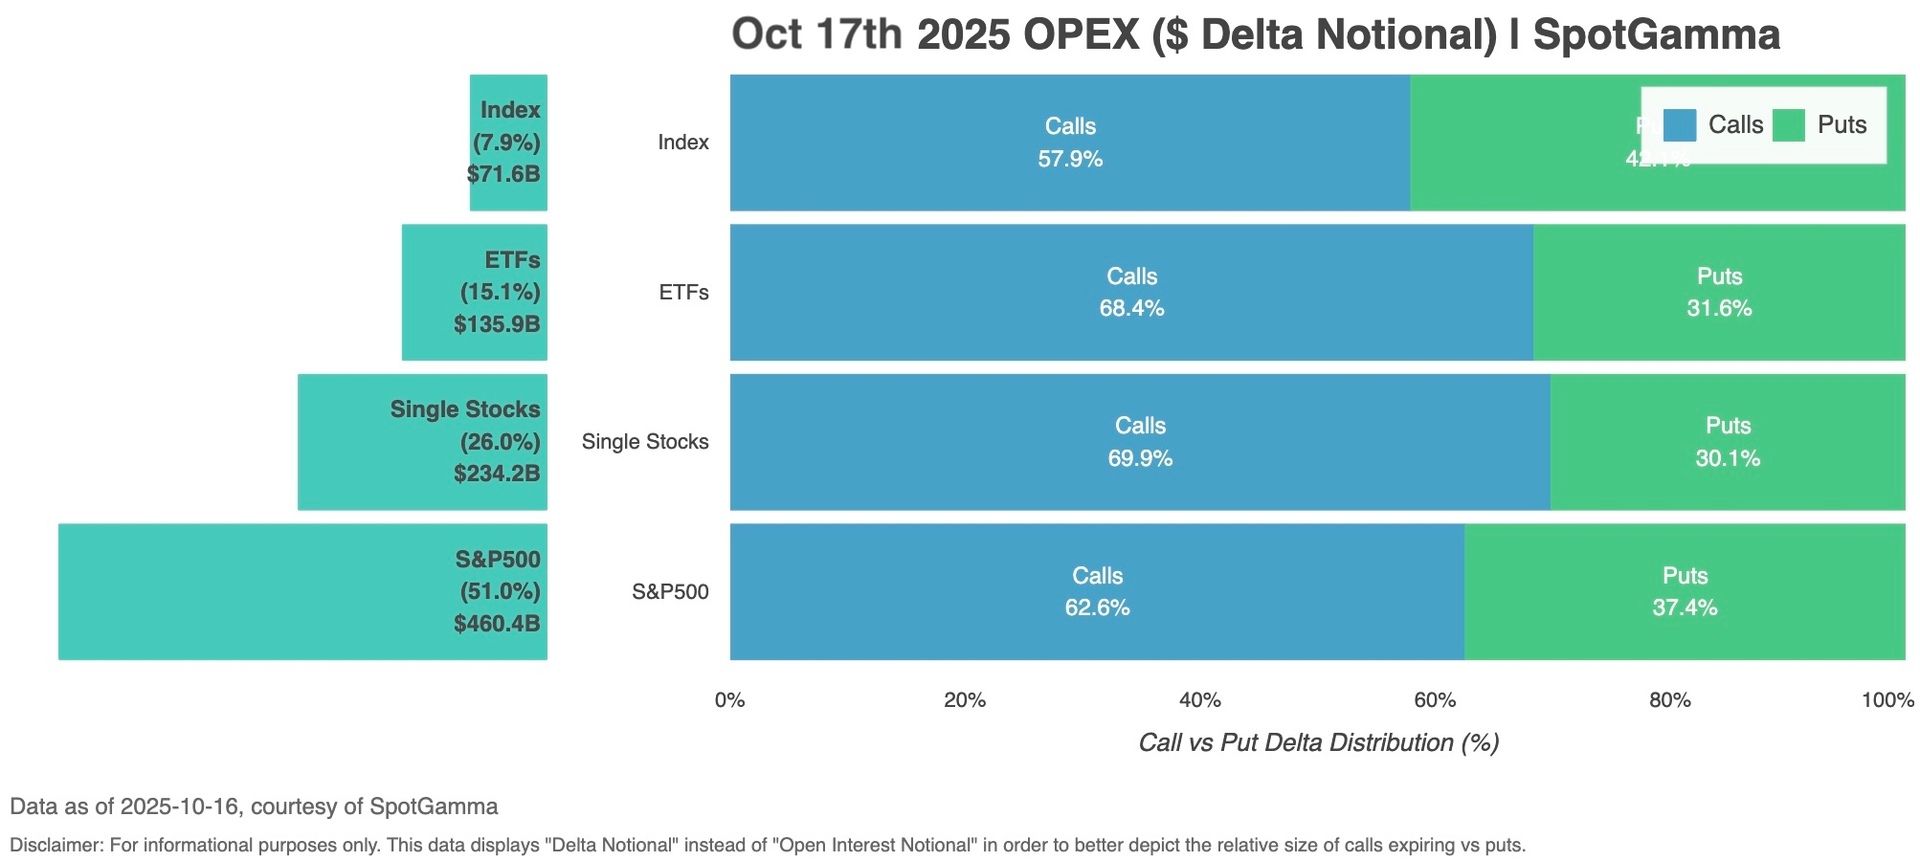
Today marks the largest October options expiration on record, with an estimated $1.9 trillion of SPX options and $760 billion notional of single stock options set to expire.
Like I said yesterday in the lean, I thought the ES could go higher barring any major headlines. I think we could trade lower overnight, but the last four lows were:
-
10/10/25 – 6540.25
-
09/05/25 – 6506.50
-
09/03/25 – 6481.75
-
09/02/25 – 6427.00
Our Lean
I think my directional calls have been right, but the headline bushwhacking hasn’t been fun. That said, if you’re willing to buy ’em when they look ugly, you usually get paid. I can sell the ES into weakness like this, but that doesn’t mean I’m right.
Our lean: I think you can use the recent lows as a support level, but I’m not sure how much lower the ES can fall. I know there are some regional bank problems, but if the ES opens sharply lower, I am buying the open or the early weakness.
SPX Seasonal Insight — September Through Year-End
From 1970 through 2024, September has closed higher 25 times and lower 30 times, making it the weakest month on average for the S&P 500.
Yet when September finishes positive, the outlook shifts dramatically:
-
In those 25 positive Septembers, the S&P 500 finished the year higher 22 times and lower only 3 times.
-
When September was positive and the market was already up year-to-date, that setup occurred 22 times — and the year ended down just once.
Even more telling:
-
When October’s high exceeded September’s high, the S&P 500 has never finished the year lower.
-
And when September was an up month, October made a new high above September’s high, and that high marked a new high for the year, the S&P 500 has finished the year higher 100% of the time.
Finally, when all three months of the third quarter (July, August, and September) made higher highs, and October also posted a higher high, October finished up five times and down only twice — with November and December typically extending those gains into year-end.
Taken together, these historical tendencies strongly favor fourth-quarter strength when momentum carries through from September into October.

We’ve never offered a deal like this before, and it includes all our tools, including the Imbalance Meter.
Guest Posts:

Get instant access to our partners’ real-time market data and insights not available anywhere else. Here is last night’s Founder’s note getting you ready for today’s market and explaining the constraints in yesterday’s market. – MrTopStep
Founder’s Note:
Futures are down ~1% ahead of today’s OPEX, with the VIX at 26 – its highest level since April.
Starting with OPEX, we see Oct OPEX as a large monthly expiration, but only about 2/3 the size of the quarterly expirations. Further, particularly with today’s AM move, the balance has shifted ~10% more neutral vs call-weighted earlier this week.
9:30AM SPX expiration will clear out a fair amount of gamma as you can see in the TRACE map. To the right of the yellow line (>9:30AM exp), we see mostly negative gamma (red) around ATM levels. If you loo >4PM expiration we see all red, indicating this market is essentially pure negative gamma which is indicative of further 2-way volatility.
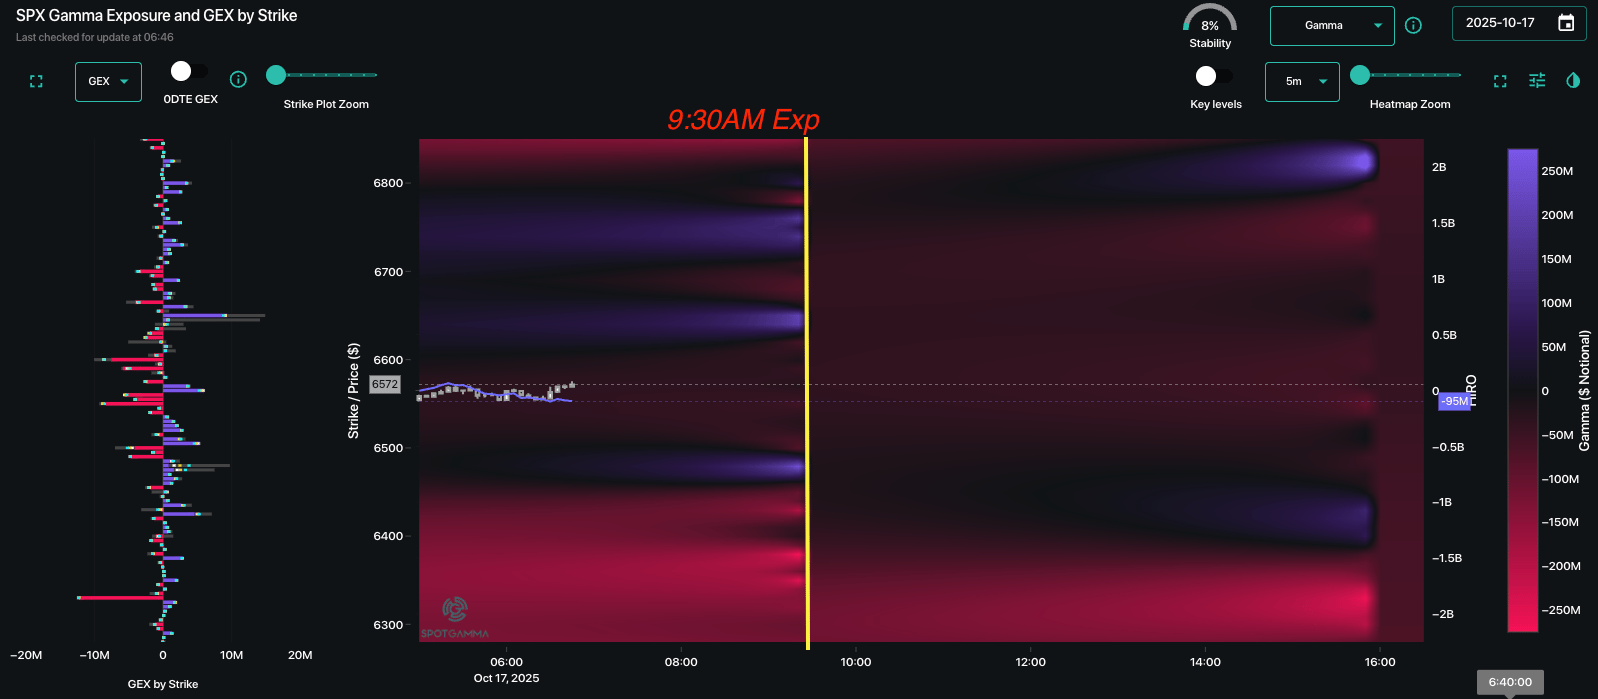
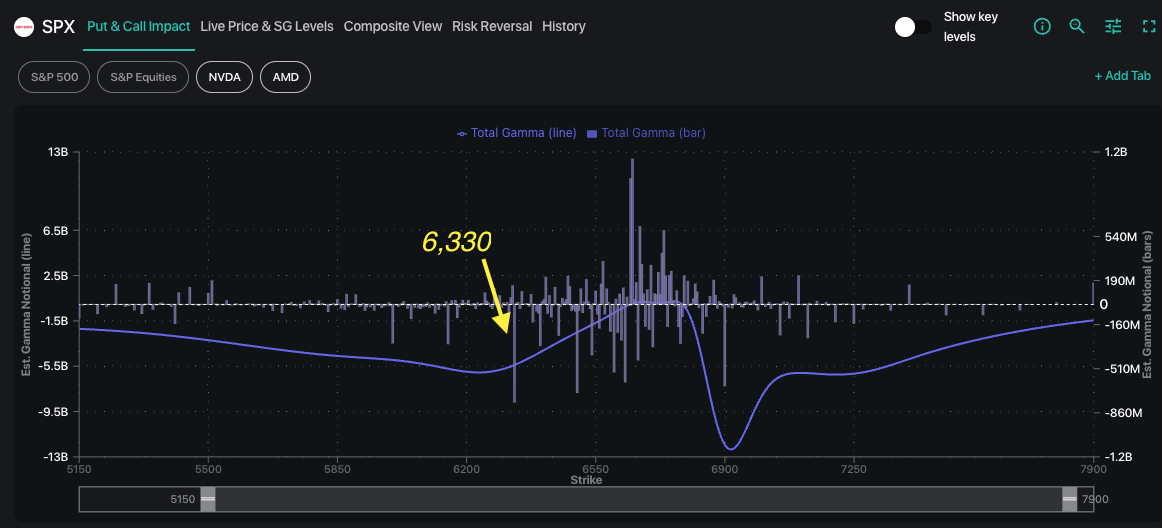
If you are looking for worst case scenarios, we note that the negative gamma doesn’t wane until ~6,330, which is the location of the big 12/31 JPM put strike. Below this level positioning wanes sharply, suggesting dealer-induced downside would drop.
In yesterday’s AM note, and our Q&A, we discussed the lack of signal into this OPEX, as price action was fairly neutral (i.e. only 1-2% from ATH) as is/was IV’s (i.e. decent vol premium, not massive). Now we are starting to get some rich vols, which might start to draw out vol sellers, which could add support to stock prices. Looking at the chart below its clear to see this feature of “expanding vols” over the last several days.
We’ve seen this IV-reversion in our OPEX data, too, wherein high volatility into expirations tends to lead to lower relative IV’s out of expiration. If we think about VIX expiration next week, too, anyone long Oct VIX calls has to start thinking “cash ’em in!” before they stop trading on Tuesday night.
Its important to flag comments by Jamie Dimon that there could be more credit “cockroaches“. When credit cracks, traders often hedge these risks with equity puts. Credit-induced equity put buying is often when vol gets nastiest. We have no idea what is happening in this space, but it warrants watching.
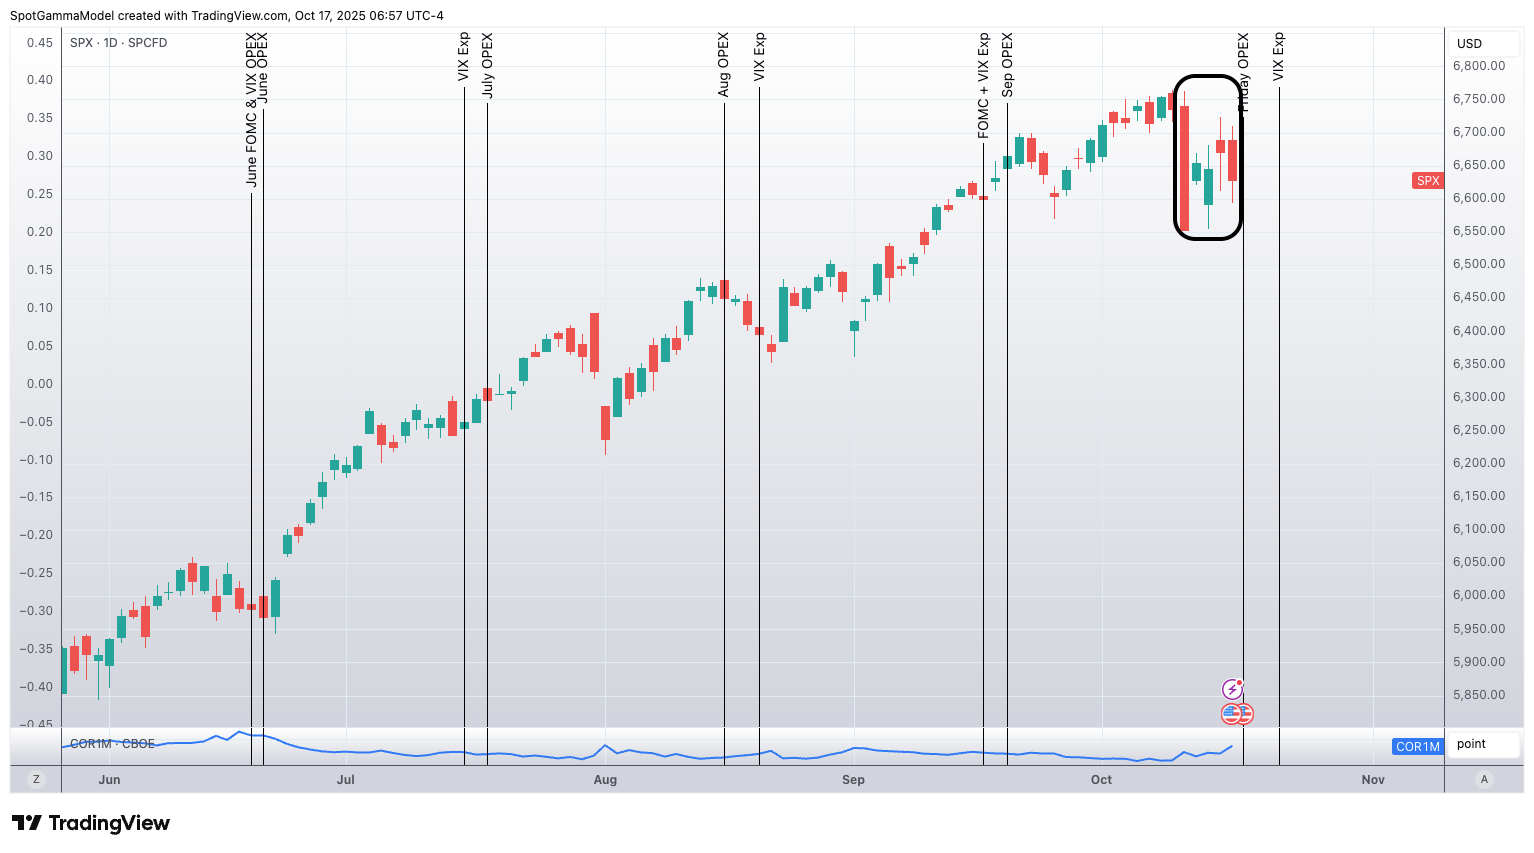
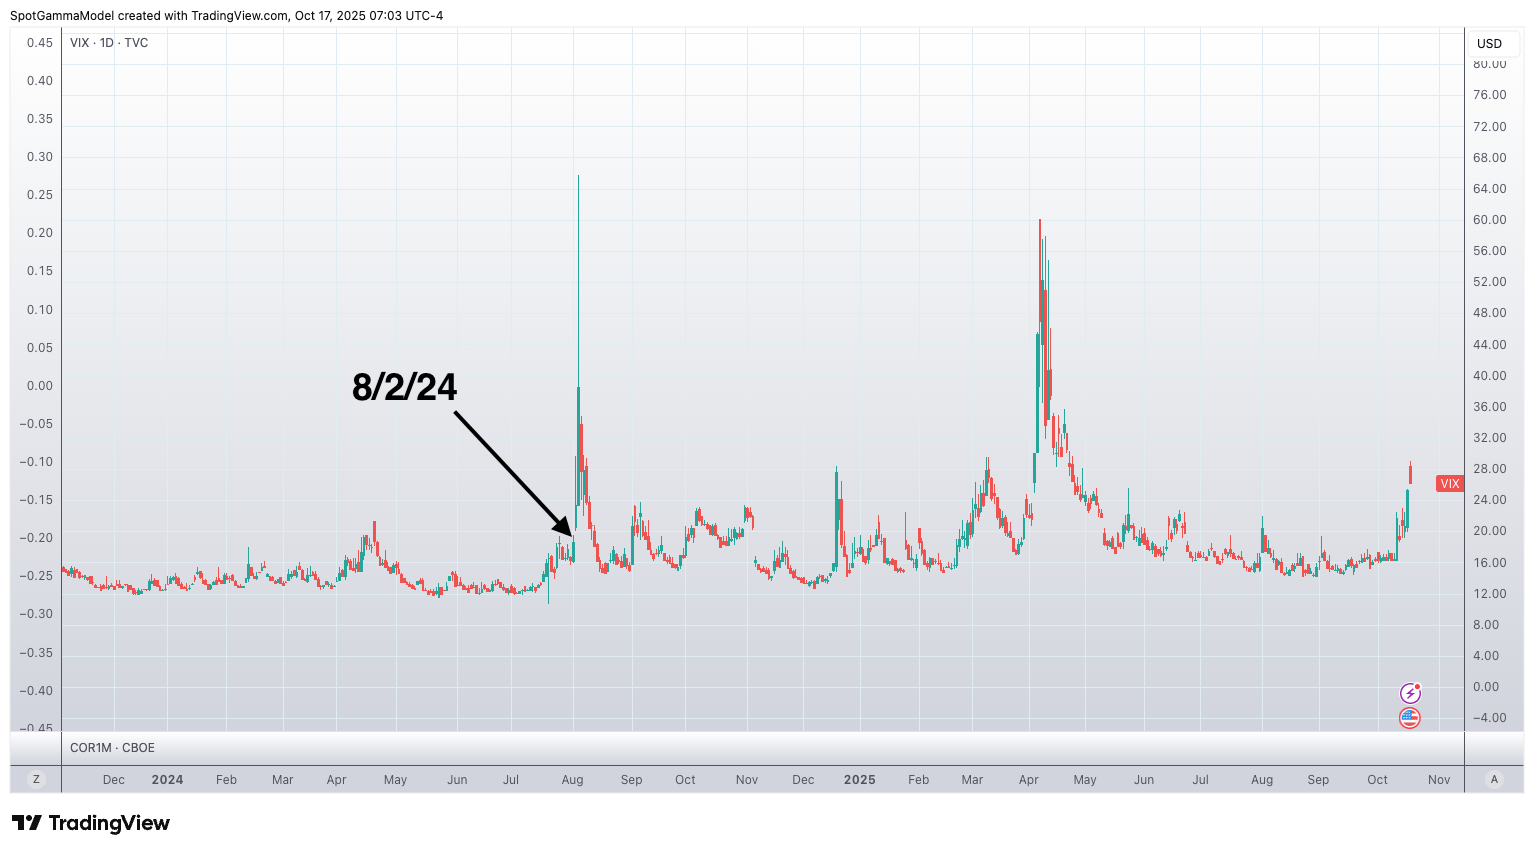
That being said, you generally don’t want to be short vol into a crashy weekend. We spend a lot of time last week comparing this period to July ’24, which is when the SPX fell 5-10% over July as correlations unwound. This culminated in the August 5th VIX >50 episode (marked below). For this to mirror that incredible day, we’d have to 1) have a weekend catalyst (it was a carry trade flare-up then) and 2) we have OPEX now which may clear out some of the tinder (vs mid-exp cycle in ’24).
So, what’s the trade?
We are honestly not looking for a huge crash this weekend, but our own trading rules dictate we don’t sell short dated puts into a weekend like this (i.e. crashy). Additionally, getting long puts with IV’s at these levels are too expensive. VIX puts are an option, but we don’t see a great reason to be too aggressive before Monday.
That leaves A) doing nothing – and quite frankly this is our current stance. If the SPX were to drop sharply today (into 6,400’s) we’d like look to add some more calls (see below, and we are already long a sliver of calls from recent days), and/or some type of VIX puts.
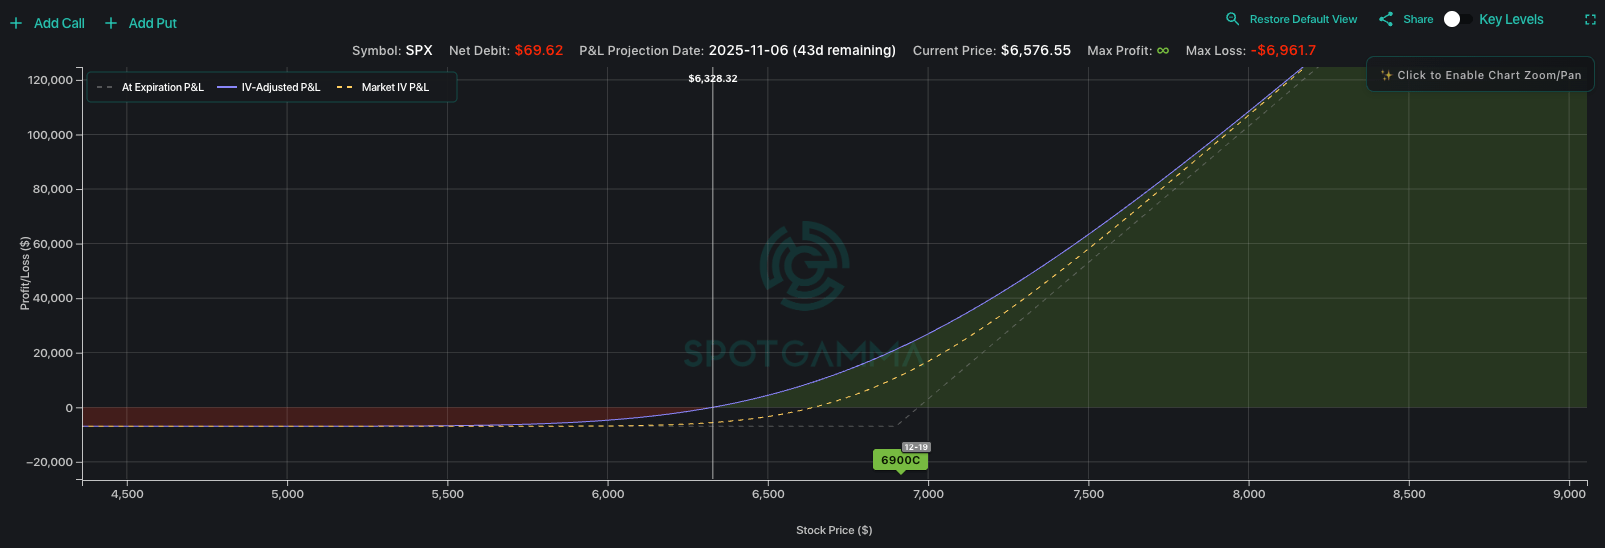
Option B) you can think about some type of Dec call structure, and we were looking at Dec ~25 delta calls which quite frankly look ok in terms of price.
In this case, if the market were to rally the ATM IV would drop, but we also think call skew would pick up. Given that, our new options calculator (launching this month!) shows IV holding pretty flat for this specific SPX ~6,900 call (solid line = our IV projection PNL vs dashed line = current IV). Now we are not suggesting you go hog-wild loading up on calls, but you could easily see a big jump in markets with OPEX clearing, + AI earnings/Trump/XI deal, and maybe even a resolution to the Ukraine conflict. If all that goes south, which is also a real possibility, then the calls offer fixed downside risk.
Get instant access to our partners real-time market data and insights not available anywhere else. Here is last night Founder’s note getting you ready for today’s market and explaining the constraints in yesterday’s market. – MrTopStep
MiM and Daily Recap
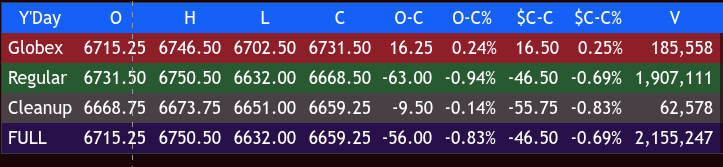
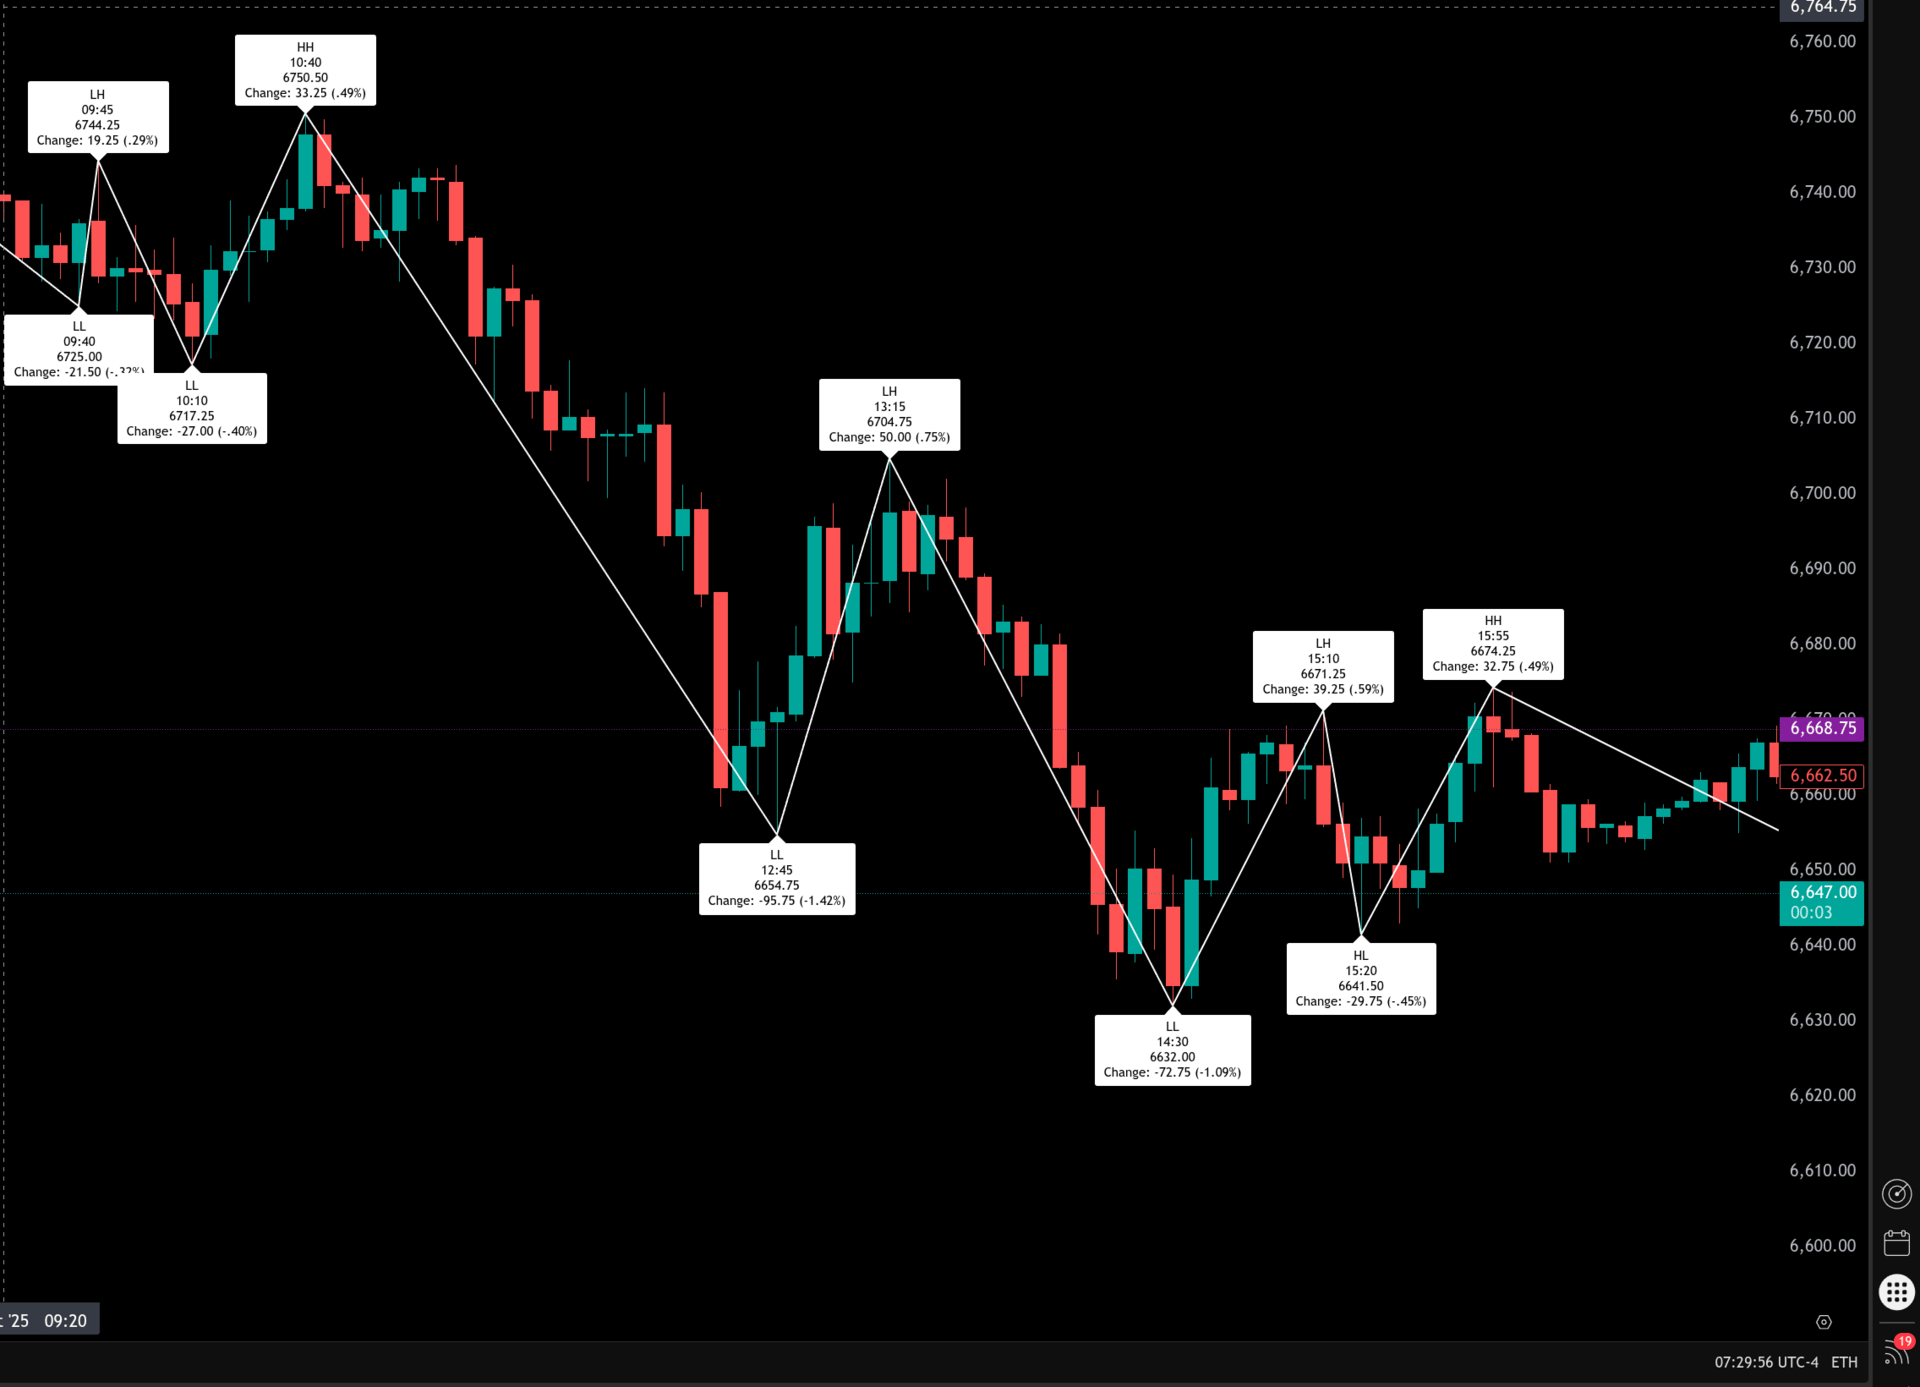
The ES traded modestly higher overnight in the October 16 session, opening at 6715.25 followed by a pullback to 6702.50 around 20:40 (-0.36%) and another dip to 6705.75 at 22:30. From there, buyers regained traction, lifting prices toward 6745.25 at 07:20 and a session high of 6746.50 by 08:40 — a 39.5-point climb from the prior low.
As the 9:30 ET cash open approached, ES began to soften. The regular session opened at 6731.50 and made an early high of 6750.50 by 10:40 before reversing sharply. Sellers drove the contract down to 6632.00 by 14:30, marking a -118.5-point slide (-1.75%) from the morning peak. Prices chopped around before a final rally attempt to 6674.25 at 15:55.
The session settled at 6668.50, down -63.00 points (-0.94%) from the open and -46.50 points (-0.69%) from Wednesday’s cash close. Volume was decent at 1.9 million contracts in the regular session and 2.15 million for the full day. Globex contributed modest overnight strength (+0.25%) while the cash session erased those gains, confirming a defensive tone throughout Thursday’s trade. The cleanup session slipped another -0.14%, finishing at 6659.25.
Thursday’s tone was broadly bearish as the market failed to sustain early overnight strength. Despite several intraday rallies, each rebound produced a lower high, a classic sign of distribution. Momentum favored sellers from mid-morning onward, and the afternoon’s attempt to stabilize above 6670 was met with persistent supply.
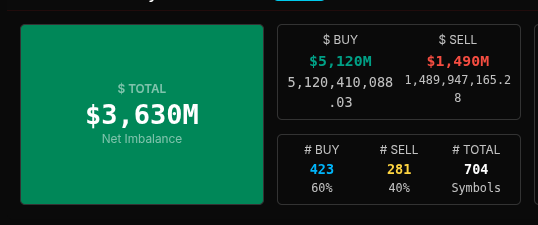
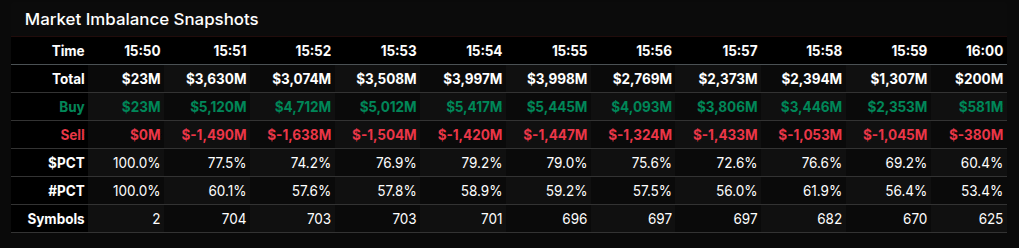
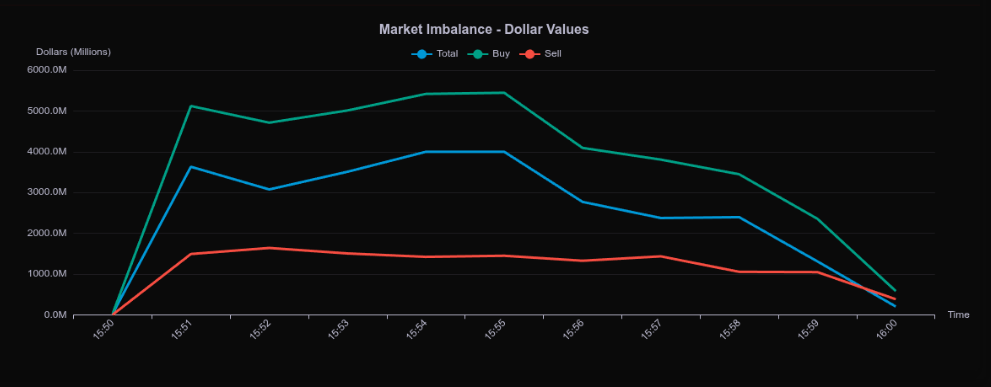
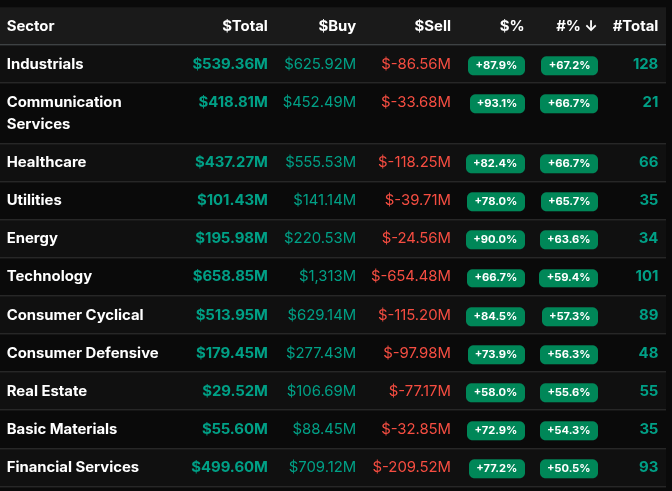
The Market-on-Close (MOC) imbalance showed a clear buy skew early in the 3:50 window, with 77–80% of flow on the buy side and roughly 700 symbols reporting. However, the imbalance decayed into the bell, closing near 60% buy and $200 million total. This fading buy pressure aligned with the modest dip into the cleanup session.
Sector imbalance data leaned bullish in tone — Communication Services, Industrials, and Energy all showed +80–90% buy ratios — but those flows did not translate into index-level resilience as Technology and Financial Services both moderated by the close.
Overall, the ES ended the day with a -0.69% cash-to-cash loss and -0.83% full-session decline. The intraday pattern of lower highs and heavy afternoon volume suggests continued caution heading into Friday, with 6650 serving as immediate short-term support and 6740–6750 remaining key resistance.
On the MIM:
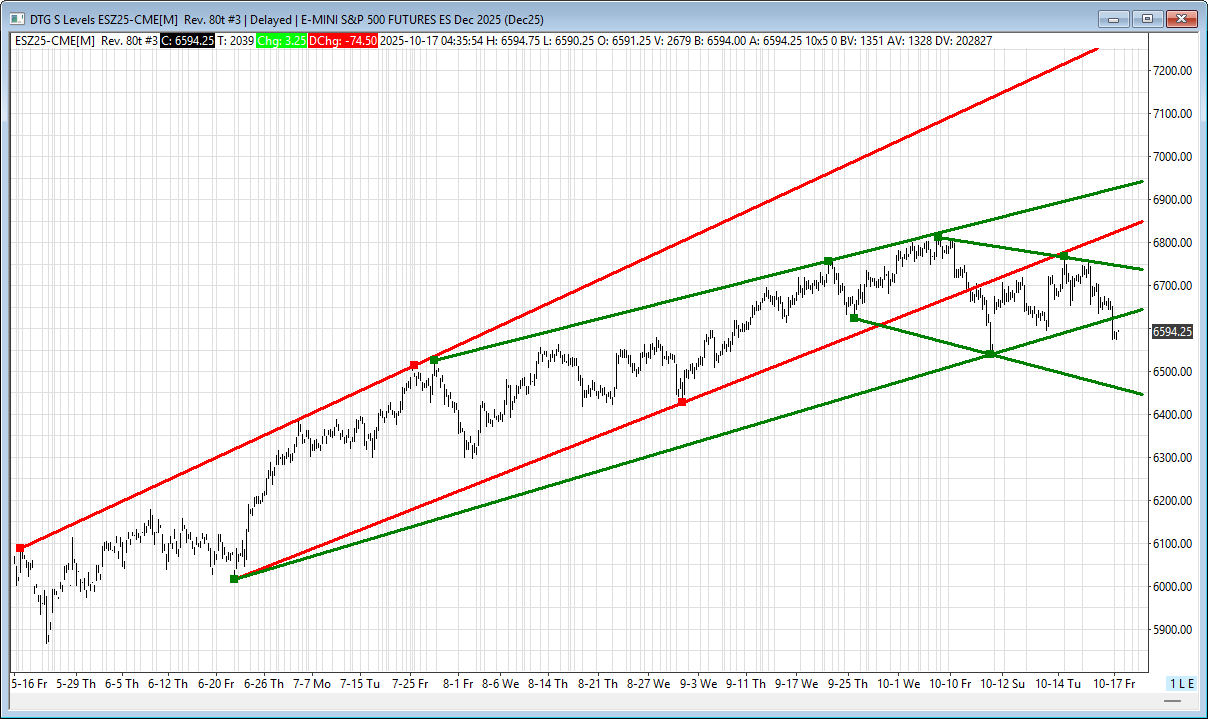
ES Levels
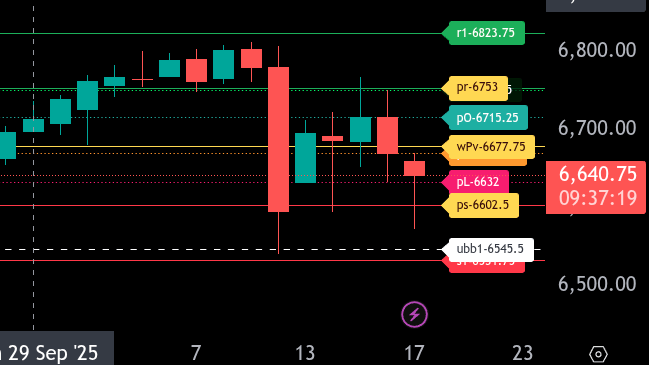
The bull/bear line for the ES is at 6677.75. This is the key pivot that separates bullish from bearish tone. Currently, the ES is trading around 6641.00, showing weakness below the bull/bear line and indicating bearish pressure in the early Globex session.
If price remains below 6677.75, downside targets include 6632.00 and 6602.50, the lower range target. Our level 1 support is at 6531.75.
On the upside, if the ES can reclaim 6677.75 and hold above, expect potential strength toward 6715.25, followed by 6753.00, which serves as today’s upper range target. A breakout above 6753.00 would shift intraday sentiment to bullish and could test 6823.75 resistance.
Overall, the market bias leans bearish below 6677.75. Bulls must regain control above this level to shift the tone back toward upside continuation.
NQ Levels
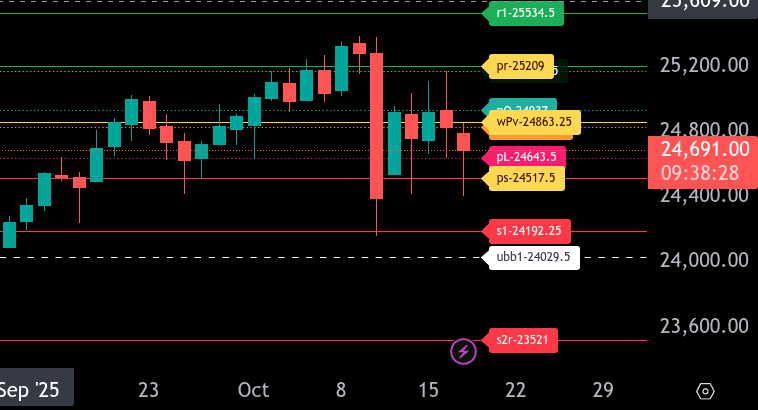
The bull/bear line for the NQ is at 24,863.25. This is the key level that must be reclaimed for bullish momentum to resume. Staying below this level keeps the short-term tone bearish.
Currently, NQ is trading around 24,678.25 in the Globex session, showing continued weakness beneath the bull/bear line. If sellers maintain control below 24,863.25, look for downside targets toward 24,517.50, which marks our lower range target for today. A break below there could open the door for a move to 24,192.25.
On the upside, resistance appears near 25,209, our upper range target. Above that, 25,534.50 becomes the next resistance zone. A sustained move and hold above 24,863.25 would shift bias back to bullish and set up a test of 25,179.50 and then 25,209.
Overall, the market remains in a consolidation zone following Thursday’s sharp drop. Holding under 24,863.25 suggests sellers still control momentum, while a reclaim and close above that level would signal an intraday reversal attempt back toward 25,200–25,300.
Technical Edge
Fair Values for October 17, 2025
-
SP: 38.08
-
NQ: 162.78
-
Dow: 191.63
Daily Breadth Data 📊
For Thursday, October 16, 2025
• NYSE Breadth: 26% Upside Volume
• Nasdaq Breadth: 30% Upside Volume
• Total Breadth: 30% Upside Volume
• NYSE Advance/Decline: 27% Advance
• Nasdaq Advance/Decline: 30% Advance
• Total Advance/Decline: 29% Advance
• NYSE New Highs/New Lows: 122 / 60
• Nasdaq New Highs/New Lows: 246 / 127
• NYSE TRIN: 1.07
• Nasdaq TRIN: 0.97
Weekly Breadth Data 📈
Week Ending Friday, October 10, 2025
• NYSE Breadth: 37% Upside Volume
• Nasdaq Breadth: 52% Upside Volume
• Total Breadth: 47% Upside Volume
• NYSE Advance/Decline: 19% Advance
• Nasdaq Advance/Decline: 30% Advance
• Total Advance/Decline: 26% Advance
• NYSE New Highs/New Lows: 313 / 149
• Nasdaq New Highs/New Lows: 814 / 274
• NYSE TRIN: 0.39
• Nasdaq TRIN: 0.39
Calendars
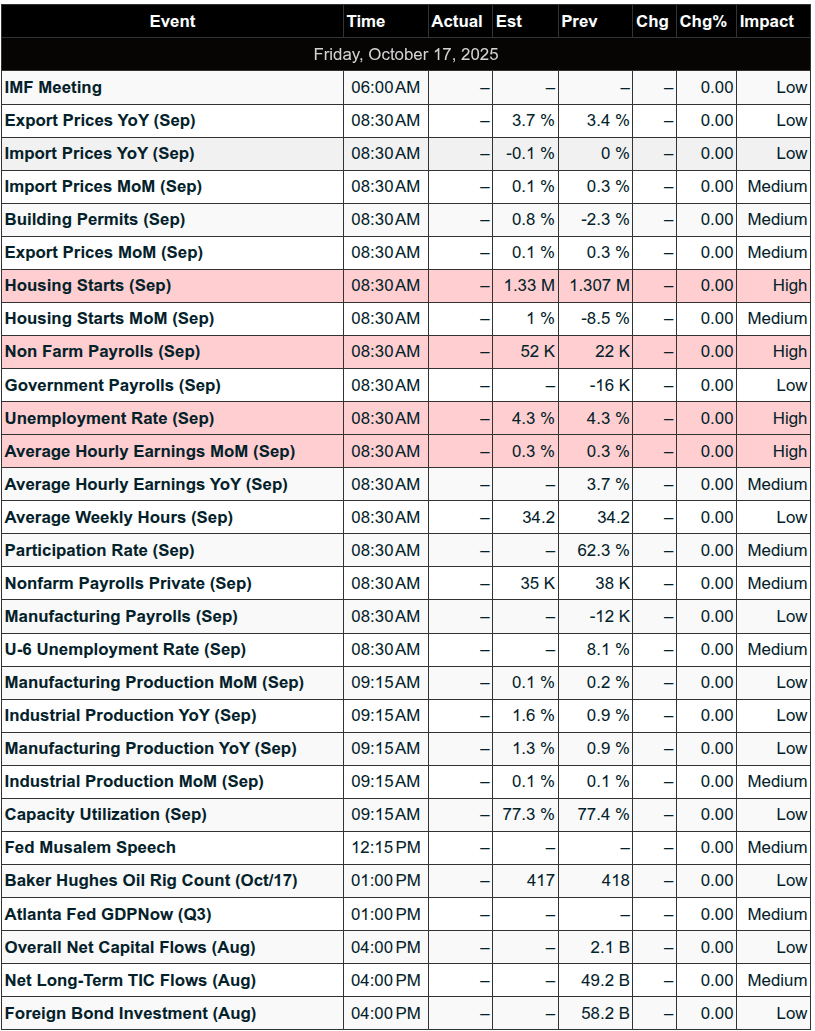
Economic Calendar Today
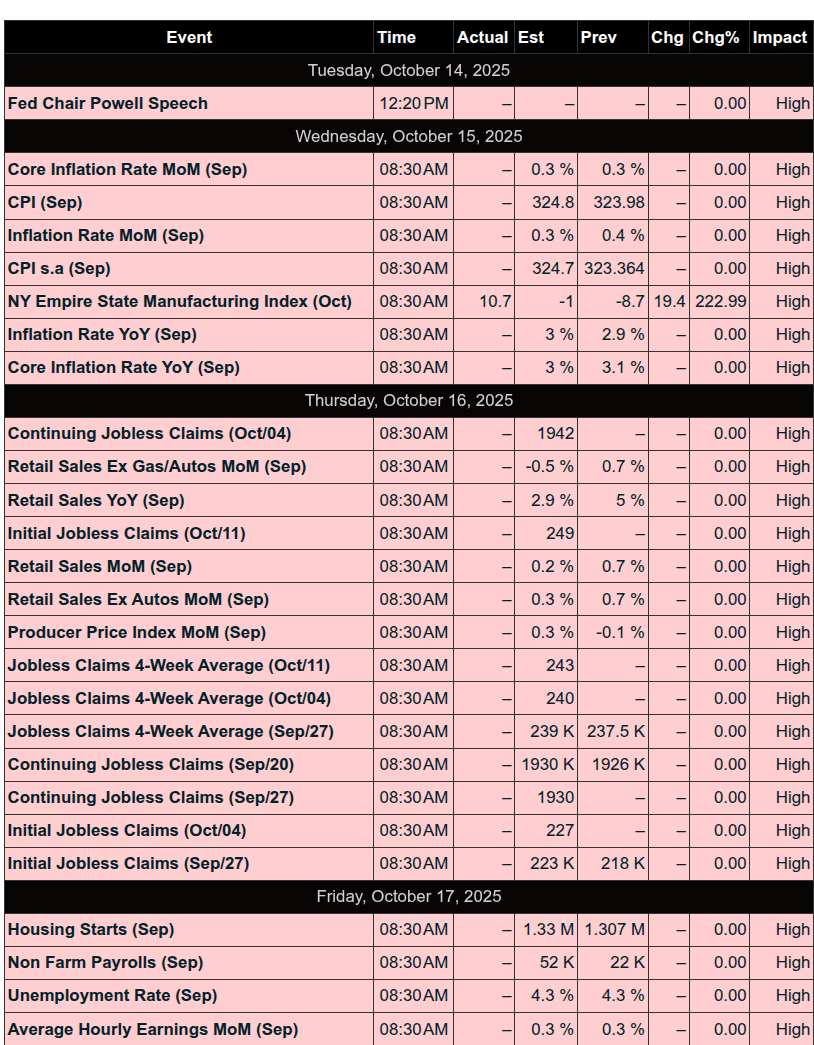
This Week’s High Importance
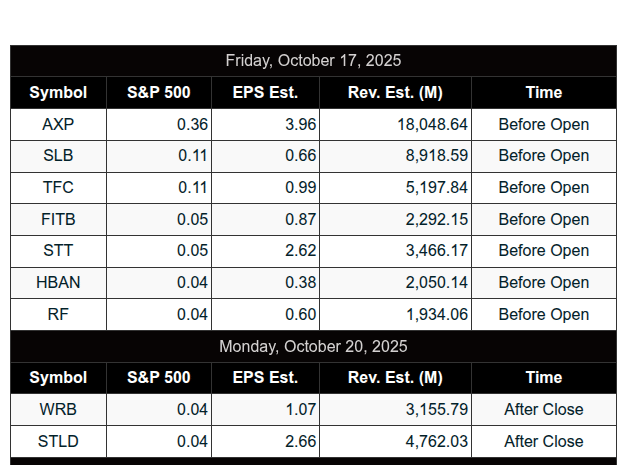
Earnings:
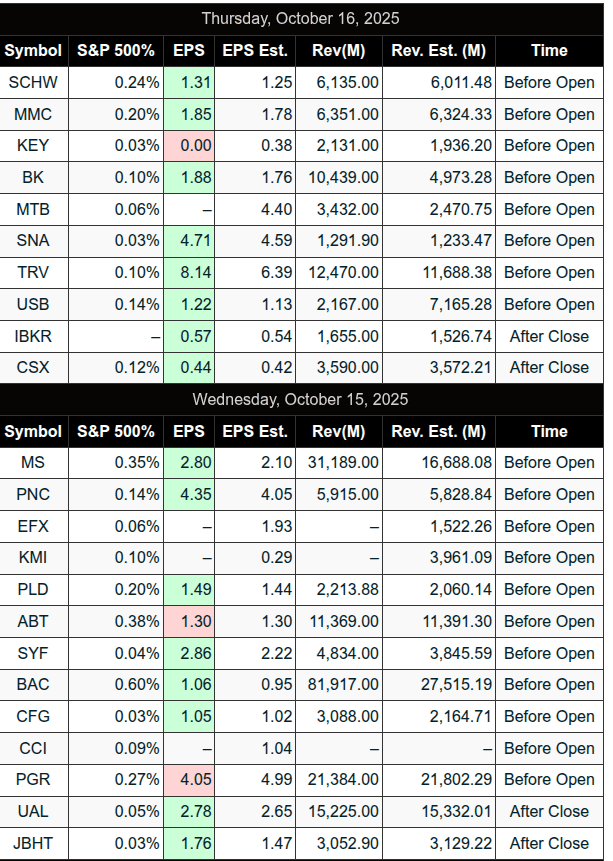
Trading Room News:
Polaris Trading Group Summary – Thursday, October 16, 2025
Thursday was a volatile and choppy trading session, marked by large swings and indecision, with VIX > 20 driving increased ranges. Despite these conditions, the PTG room navigated with caution, discipline, and a strong emphasis on alignment and timing. The market displayed characteristics of neutral-to-bearish action, with multiple attempts by bulls failing to reclaim critical zones.
Positive Trades & Key Levels Hit:
-
Early Bullish Target Achieved:
PTGDavid noted that the initial upside target zone (6740–6745) was fulfilled early in the day. A successful follow-through from overnight support long ideas provided early wins. -
D-Level 6636 – Precision Tag & Bounce:
The highlight of the day was the D-Level tag at 6636, which was called in real time by PTGDavid and used as a take-profit level for shorts.-
David: “Boom 36 tag… good for +10.”
-
Manny: “Nice A4”
-
Followed by a clean ripper off that level after PL (6651) was reclaimed.
-
-
Support Buy at ES 6714.50:
This setup was referenced multiple times, including a late morning trigger. Manny highlighted the reclaim of this level, aligning with the buy plan posted pre-market. Although early morning action was mixed, those who followed this level cautiously saw setups unfold.
Lessons Learned & Key Takeaways:
-
Stay Nimble and Aligned:
-
PTGDavid stressed: “Be Nimble, Be Quick” and “Do not overstay any trade.”
-
Emphasized that day types like yesterday can chop traders up. Caution, flexibility, and quick exits were critical.
-
-
D-Level – A Community Edge:
-
The 6636 D-Level once again proved its strength.
-
David called it “our secret” and reminded members of its repeatable value.
-
This level offered a +10-point profit window, and a potential base for a reversal once bulls reclaimed PL.
-
-
Bearish Failure Signals Were Clear:
-
Manny noted the failure to convert 6696, a clear signal that bulls lacked strength.
-
Sellers added consistent supply in the afternoon, pressuring price lower until the D-Level caught.
-
-
No Bull Shift, No Guessing:
-
Strong discipline was exercised. David reminded the group: “No Bull Shift…No Guessing…Just Follow the Rules.”
-
-
Large Market Order (MOC) Imbalance:
-
A late-session $3.5B buy imbalance added confirmation of strong underlying flows despite intraday weakness.
-
“Forever buying,” as David put it—hinting at broader accumulation themes despite surface volatility.
-
Cycle Timing Notables (From Manny’s Guide):
-
10:00–10:55 High
-
11:00–11:45 Low
-
2:00–2:55 Low → Played out cleanly with the 6636 tag and afternoon bounce.
Final Thoughts:
Despite a challenging environment with early neutrality and intraday sell pressure, the PTG team remained patient and capitalized on key levels—especially the D-Level, which once again proved to be a defining edge for the room.
Yesterday reinforced core PTG principles:
Discipline over prediction. Alignment over bias. Precision over emotion.
Winning Trade of the Day:
Short to D-Level 6636, then long on reclaim of PL (6651) for a clean afternoon bounce.
Key Level to Remember: 6636 – D-Level “Voodoo” magic
DTG Room Preview – Friday, October 17, 2025
-
Macro & Fiscal: Treasury reported Trump-era tariffs brought in $195B in revenue through Sept, but trade deficit only shrank by $41B. The U.S. posted a record $198B surplus in Sept, driven by a sharp 87% drop in Department of Education outlays.
-
Regional Bank Worries: Zions (ZION) took a $50M charge-off; Western Alliance (WAL) filed fraud claims over a credit facility. Fallout from Tricolor and First Brands bankruptcies adds pressure. JPM’s Jamie Dimon warns of economic “cockroaches.”
-
Markets Reaction: UST yields and stock futures falling; USD on track for worst weekly drop in 3+ months.
-
China Trade & Tech: Chinese exporters pivoting away from U.S., exports to U.S. down 7.1% YTD. Micron (MU) to halt server chip sales to China following continued fallout from semiconductor tensions.
-
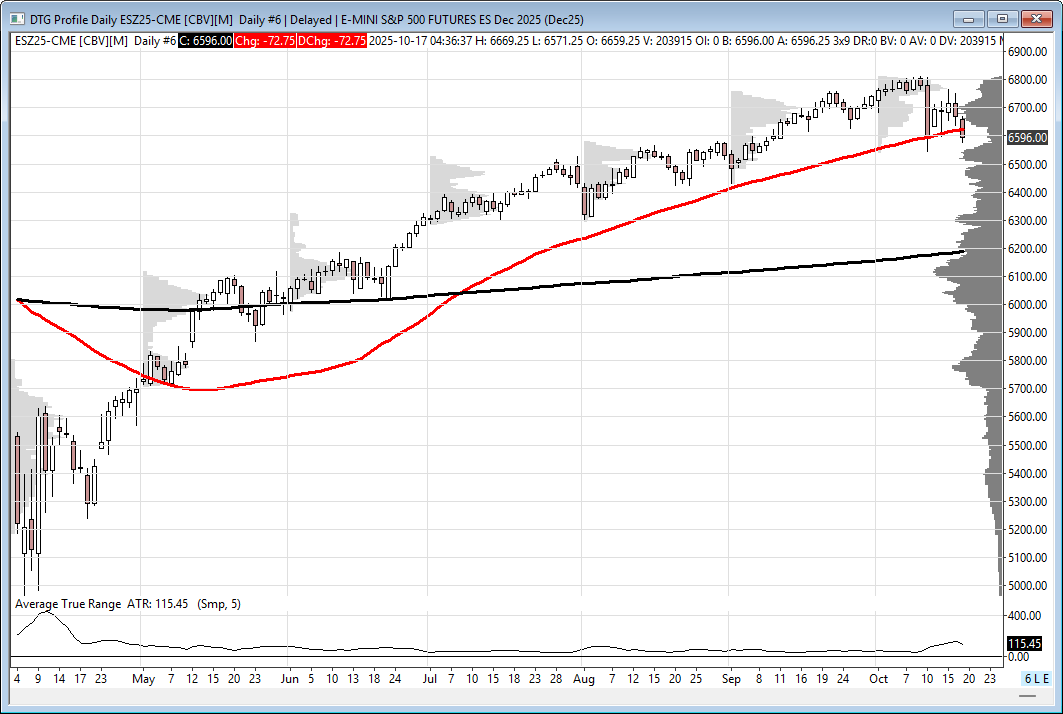
Technical Picture: ES sliced through its short-term uptrend channel and breached 50MA (6623), turning bias short-term bearish. Resistance seen at 6632/37, 6744/39; Support near 6455/50.
-
Other Notes: Volatility remains elevated (ES 5-day avg range: 149 pts). No clear whale bias overnight. Fed’s Musalem speaks at 12:15 pm. Economic calendar light.
Affiliate Disclosure: This newsletter may contain affiliate links, which means we may earn a commission if you click through and make a purchase. This comes at no additional cost to you and helps us continue providing valuable content. We only recommend products or services we genuinely believe in. Thank you for your support!
Disclaimer: Charts and analysis are for discussion and education purposes only. I am not a financial advisor, do not give financial advice and am not recommending the buying or selling of any security.
Remember: Not all setups will trigger. Not all setups will be profitable. Not all setups should be taken. These are simply the setups that I have put together for years on my own and what I watch as part of my own “game plan” coming into each day. Good luck!!
Follow @MrTopStep on Twitter and please share if you find our work valuable!
This post goes out as an email to our subscribers every day and is posted for free here around 2 PM ET. To get your real-time copy, sign up for the free or premium version here: Opening Print Subscribe.
Comments are closed