This post goes out as an email to our subscribers every day and is posted for free here around 2 PM ET. To get your real-time copy, sign up for the free or premium version here: Opening Print Subscribe.
Follow @MrTopStep on Twitter and please share if you find our work valuable!
Our View
Well, the proof will be in the pudding as the US and Iran negotiations come to a close. As I said, I’m not changing the OP, no matter what the outcome is, because Iran is not backing down. According to US intelligence, Iran has thousands of missiles left and can retrieve more of its launchers. Remember the old cigarette ad, “I would rather fight than switch?” Well, that’s where this is right now.
Our Lean
It is Sunday at 1:30 p.m. and the deal is that there is no deal: Iran will not give up its nuclear program, and while the U.S. has sunk most of its navy, the Islamic Revolutionary Guard Corps’ fast-attack craft and speedboat fleet remains intact. Meanwhile, Iranian state media reports that the navy has sent special forces to the southern coast, signaling readiness for a potential invasion, as President Trump announced the U.S. Navy would begin blockading “any and all ships trying to enter or leave the Strait of Hormuz.”
It is 6:00, and the ES just traded down to 6770.00, down 1.2%. It seems to me that we have now entered Phase 2 of the Iran war; the first part was before the two-week pause, and the second part is the announced U.S. military blockade that begins this morning for all maritime traffic entering and exiting Iranian ports.
Our lean: My guess is we see some type of bounce, but I expect a jump in volatility and tons of headlines. I can’t rule out a pop, but until Iran backs down—which I still think it won’t—the markets will remain unstable, especially if CL and LNG continue going up. You can buy the early weakness and sell the rallies, or just be patient and sell the big rips.
Below are the ES Claude 100% Market Profile AI levels and comments. I am still trying to refine the approach, but I think they are getting better all the time.
Resistance
Level
Price
Source
Notes
Strength
R5
7,082.25
Dataset high
All-time high for period — structural ceiling
●●●
R4
7,065.25
Swing high
02/11 swing — rejected hard, -1.58% next session
●●●
VAH
7,035.00
Value area high
Upper bound of 70% composite value area
●●●
nPOC
6,957.04
Col A / MA
Descending MA — confluent with POC zone overhead
●●○
R3
6,953.50
Swing high
03/05 high — sold off three consecutive days after
●●○
POC
6,924.00
Composite POC
Most time spent across all 48 sessions — strong magnet
●●●
R1
6,888.00
Session high / nPOC
04/10 session high; naked POC cluster begins here
●●○
Current Price
Label
Price
Source
Notes
NOW
6,855.25
Last close
Inside value area · below POC · above VAL
Close Date
04/10/2026
—
Current price reference date
Support
Level
Price
Source
Notes
Strength
S1
6,846.25
Session low / nPOC
04/10 low; immediate floor — break opens nPOC cluster
●○○
S2
6,826.75
Low cluster
03/04–03/05 lows tested twice in same zone (6,825–6,828)
●●○
S3
6,802.00
Low cluster
02/06 + 03/11 lows confluent at 6,800–6,804 zone
●●○
S4
6,792.50
nPOC
04/09 session POC — unvisited downside magnet
●●○
S5
6,768.00
Low cluster
03/03 + 03/06 lows at 6,766–6,770; two-session base
●●○
S6
6,718.75
Low cluster
03/12 + 03/17 lows at 6,715–6,722; held twice
●●○
VAL
6,651.00
Value area low
Lower bound of 70% composite VA — key acceptance test
●●●
S7
6,631.50
Swing low + vol
03/09 swing low; overlaps high-volume session ranges
●●●
S8
6,571.08
Low cluster
03/24 + 04/06 + 04/07 lows (3 touches) — dense TPO zone
●●●
S9
6,520.38
Low cluster
03/20 + 03/26 lows; high-vol session anchor (2.01M)
●●●
S10
6,483.50
Swing low + vol
03/23 swing low; 2.18M vol session — institutional range
●●●
S11
6,389.00
Vol anchor low
03/27 low; 1.92M vol — base of selloff range
●●●
S12
6,353.25
Dataset low
03/31 absolute low — highest-volume session in dataset
●●●
Resistance — key levels to watch
The most important overhead level is the composite POC at 6924, which represents where the market spent the most cumulative time across all 48 sessions. Price is currently 69 points below it, and the descending column A MA at 6957 sits just above, creating a tight confluence zone between 6924–6957 that will be very difficult to push through without a significant shift in sentiment. Above that, the VAH at 7035 and the swing highs at 7065/7082 form a layered ceiling, but those are secondary concerns until the POC/MA cluster is reclaimed.
The immediate resistance is the 6888 level, which was the 04/10 session high and also a naked POC. Any bounce from current price will likely stall here first before attempting the POC zone above.
Support — key levels to watch
The most critical support is the VAL at 6651. This is the lower boundary of the 70% value area; a close below it would signal that the market is rejecting value entirely and shifting to a lower price range, which historically triggers accelerated selling. It’s not just a number; it’s a structural statement about where the market considers price fair.
Just above it, the 6571 cluster (S8) is arguably the most technically significant near-term support below current price. Three separate sessions (03/24, 04/06, 04/07) all found their lows within a few ticks of each other there. That kind of repeated defense at the same level signals genuine buyer interest and makes it a high-conviction bounce zone if tested.
On the downside, if both the VAL and 6571 give way, the 03/31 high-volume session range (6353–6583) becomes the major structural floor. That session printed the highest volume in the entire dataset at 2.36M. The sheer amount of institutional activity that changed hands there makes it the strongest support on the board if price gets that deep.
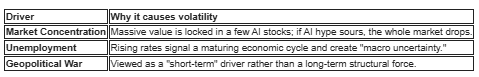
Goldman says 2 forces will drive stock volatility higher for longer, and the Iran war isn’t one of them.
According to the Goldman Sachs report, while geopolitical tensions like the war in Iran often cause short-term market spikes, two structural “non-macro” forces are expected to drive stock volatility higher for a longer period.
-
Extreme Market Concentration
-
The stock market has become historically top-heavy, fueled largely by the AI trade.
-
Historical Parallel: Goldman notes that market concentration is at its highest level since 1932, during the Great Depression.
-
The AI Risk: High valuations in AI-related stocks mirror the tech boom of the late 1990s. As the AI cycle matures, uncertainty over whether the actual benefits of AI justify these valuations is expected to trigger ongoing swings.
-
-
Rising Unemployment
-
Goldman’s volatility model identifies a direct link between labor market data and equity stability.
-
Economic Indicators: Higher unemployment is traditionally associated with increased market volatility because it signals a shift in the economic cycle.
-
Uncertainty: The bank found a “statistically significant relationship” between labor market volatility and stock volatility, primarily because fluctuations in jobs create uncertainty about the broader macro outlook.
-
Summary Table: Volatility Drivers
Market Recap
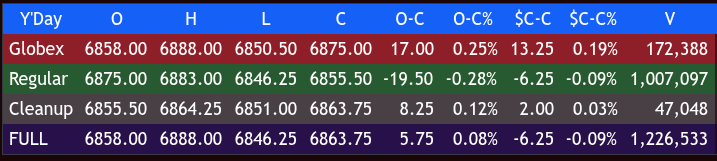
The ES traded down to 6850.50 and rallied up to 6880.00, only a 30-point range on Globex, and opened Friday’s regular session at 6875.00, up 13.25 points or +0.19%.
After the open, the ES traded up to 6881.00, then sold off to 6862.50 at 10:00. It rallied to a new high by 3 ticks at 6881.75 at 10:30, then pulled back to 6866.25. The ES slowly rallied to a new high at 6883.00 at 11:20, then sold off 30 points to 6853.25 at 12:05. It then traded up to a lower high at 6863.25 at 12:15 before selling off 16 points to 6847.00. The ES then rallied up to a lower high of 6859.00 at 12:50, sold off to 6846.50 at 1:30, and rallied up to a 6857.50 “double top” at 1:55.
After that, it traded 6850.75, rallied to 6859.00, and pulled back to 6850.75 at 2:40. The ES then rallied up to 6862.25 at 3:10 and started to drift lower to 6848.75 at 3:46. It traded 6855.50 as the 3:50 cash imbalance showed $1.7 billion to buy, and traded 6855.50 on the 4:00 cash close.
After 4:00, the ES traded 6851.00 at 4:05, and did a sideways to higher grind up to 6855.25 where it settled, down 8 points or -0.15%, up 7 of the last 9, down 1 and 1 unchanged, the NQ has been up 8 of the last 9 sessions with one unchanged and settled at 25,281.25, up 29.95 points or +0.12%. The YM settled at 49,129, down 287 points or -0.59%, up 6, down 4 of the last 10 sessions, and the RTY settled at 2,644.40, down 7.20 or -0.27%, up 7 of the last 9 with 1 down and 1 unchanged.
In the end, the entire day was a slow slog, with a little action in the first hour and the last hour. In terms of the ES’s overall tone, the ES weathered both the CPI number that showed inflation jumped to the highest level in 4 years and the constant negative headlines tied to the US and Iran meeting in Islamabad. In terms of the ES’s overall trade, volume was low at 1.227 million contracts traded.
I’m writing at 8:30 a.m. Saturday morning and have not read anything about the US/Iran negotiations other than the US has agreed to release Iranian frozen funds that have been locked up in Qatar, and in the next two weeks, China is set to deliver new air defense systems. I am not going to change the OP even if the news comes out better, but I still believe that Iran has the upper hand. There were already high tensions and threats going back and forth before they met in Islamabad. I think the big question is: Will Iran overplay its cards? As I said on my Twitter livestream late Friday, I think it’s going to require US “boots on the ground” to open the strait.
I also think Friday’s CPI number was no surprise; inflation was already trending high, and with gas and oil price increases, it is no wonder inflation jumped. Driven by a sharp 12.5% surge in energy prices—largely due to the war in Iran and the closure of the Strait of Hormuz—the Consumer Price Index (CPI) jumped to 3.3% in March, marking a two-year high despite core inflation remaining slightly below expectations at 2.6%. This spike in gasoline and fuel costs has heavily impacted transportation and airline fares, squeezing household budgets and driving consumer sentiment to record lows as real-wage growth drops. Consequently, the Federal Reserve faces a difficult dilemma, as this energy-driven inflation, combined with a cooling labor market, complicates the path for future interest rate cuts.
On Tap Today
10:00: Existing Home Sales
6:20: Fed Governor Stephen Miran speaks

Guest Posts
Manny – https://x.com/manny_trends
The Trap Before the Move
If this feels like a setup…
It probably is.
We came into Sunday with no real agreement on the macro front, and yet price is holding up.
That alone should get your attention.
Because in this type of tape, when the market refuses to break on “bad” news, you have to start asking a different question.
Is this weakness real… or is this another trap?
Early read here, but this has the look of a bear trap.
The Bigger Picture
Let’s zoom out for a second.
I have been consistent on this.
I do expect a major event at some point over the next year or so.
Call it a crash, call it a reset, call it whatever you want.
But here is the part most traders miss.
Markets do not crash from weak positioning.
They crash from complacency.
Which means before anything meaningful happens to the downside…
We likely need a leg higher first.
From a structural standpoint, that still leaves the door open for:
• A backtest toward 6878 (SPX 6915)
• And even a push into 7015–7103 (fresh highs)
Do I think that is guaranteed?
No.
But I would not be surprised if we see it.
Because structurally, that is how these cycles tend to complete.
And one more thing.
War is not a crash trigger.
It creates volatility.
But it does not create the type of positioning needed for a true unwind.
My Approach Right Now
I am a technician.
I use a mix of structure and flow data.
Price comes first.
But when structure starts to get less clean, you pivot.
Right now, that means leaning more on flow.
Because this is not a clean trend environment.
This is a positioning-driven tape.
What GEX Is Telling Us
GEX is giving us a pretty defined map today.
Support:
• 6718 (SPX 6755)
Decision Zone:
• 6728 (SPX 6765) → no flow region
Resistance:
• 6763 (SPX 6800)
And the key shift level:
Weakness only below 6708 (SPX 6745)
So the structure is clear.
Above support, the market can still rotate higher.
Lose it, and things open up quickly.
Open Interest Levels
OI is reinforcing the same structure.
6713 (SPX 6750) is your downside inflection.
Break that, and the next magnet comes in around:
• 6643 (SPX 6680 PUT wall)
On the upside:
6763 (SPX 6800) remains your key resistance level.
Break and hold above that, and we start talking about a move higher.
Until then, that level caps things.
What Today Likely Looks Like
The broader expectation here is not for a massive trend day.
The book is suggesting more of a controlled, rotational session.
With a wider range developing over the week.
From a weekly perspective, the range in play is roughly:
• 6713 to 6813 (ES equivalent of 6750–6850 SPX)
That is about a 100-handle range.
Plenty of movement.
But not necessarily clean direction.
What to Watch
There are two simple conditions today.
Below 6713 → weakness expands
Above 6763 → strength builds
Everything in between?
That is where traders get chopped up.
And given the current environment, that is where most of the day may be spent.
The Bottom Line
Structure is still leaning bullish for now.
A pullback into 6713 is not only acceptable, it is healthy.
That is how positioning resets.
That is how the market reloads.
But lose that level, and the tone shifts quickly.
So the job here is simple.
Respect the levels.
Trust the structure.
Let price confirm.
Because if this is a trap…
You do not want to be on the wrong side of it.
If this bigger picture is the map, my daily setups are the execution plan. I post them each morning on my X feed, @manny_trends, where I share the levels and structure I am watching for the day ahead. Members of IMPRO are often the beneficiaries of that work.
Manny Payano
@manny_trends
MiM
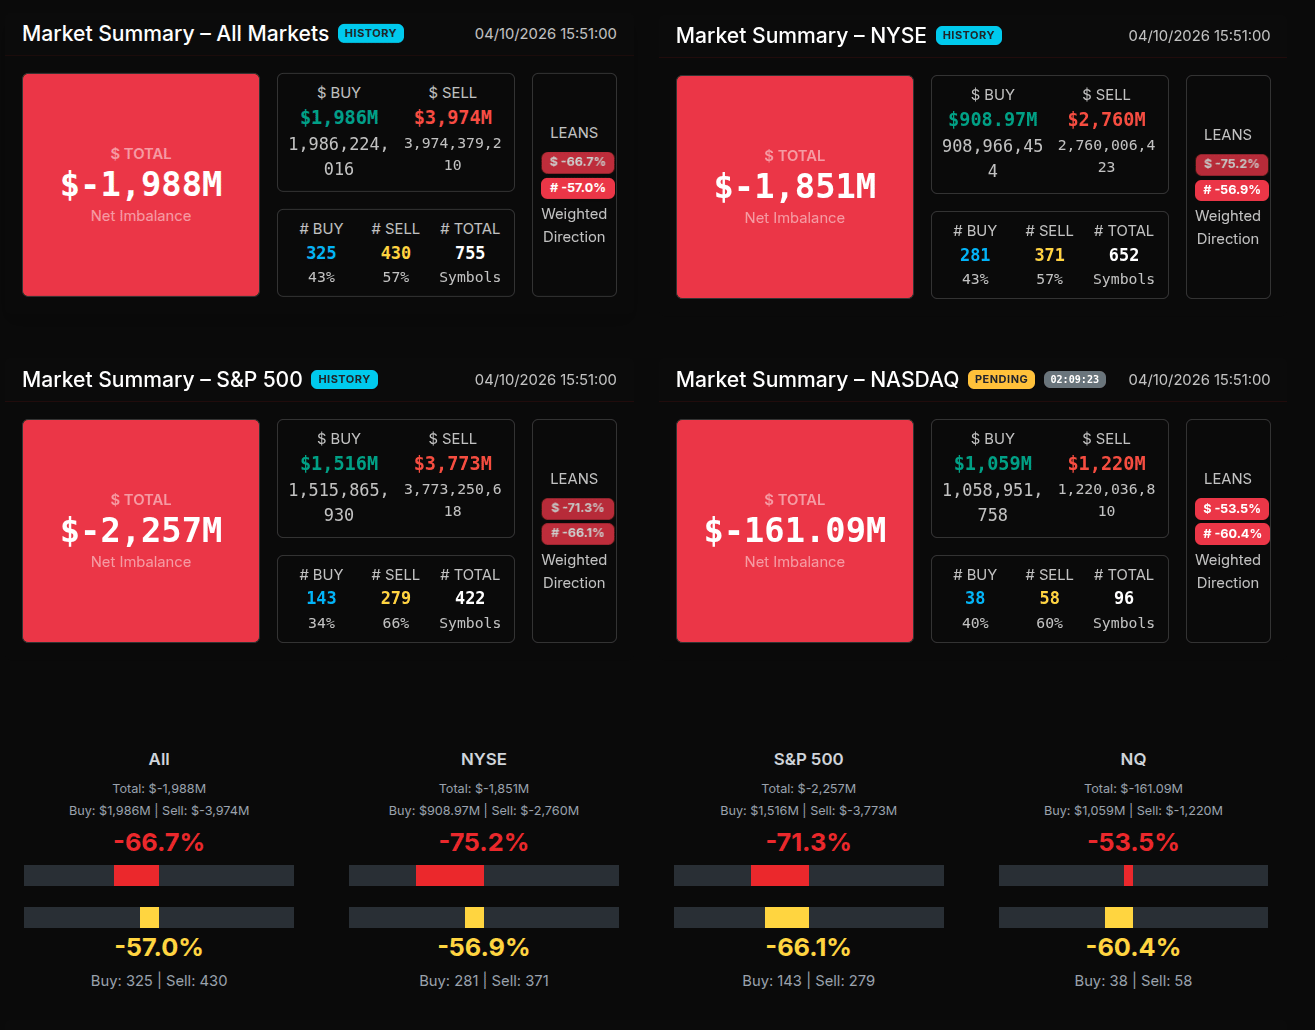
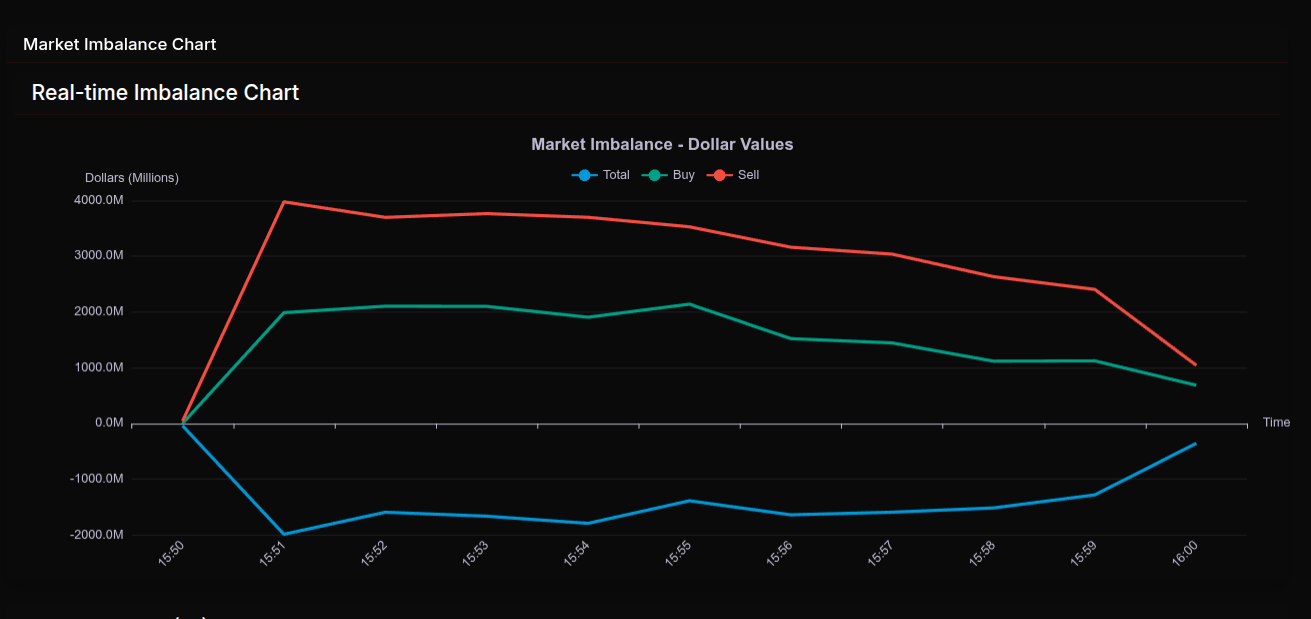
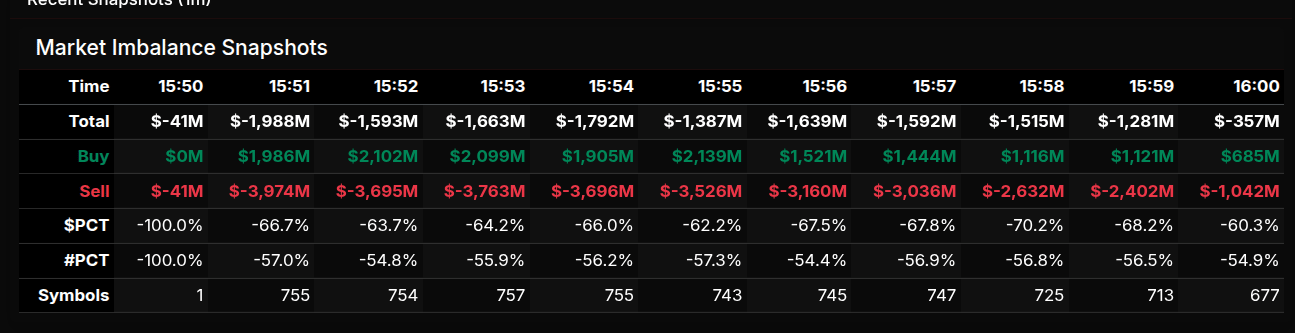
The MOC session opened with immediate and aggressive sell-side pressure, setting the tone for a broadly imbalanced close. At 15:50, the market was effectively one-sided with a -100% lean, albeit on minimal volume, but by 15:51 the true picture emerged: a sharp expansion to roughly -$2B total imbalance driven by nearly $4B in sell programs versus ~$2B in buy interest. This established a clear institutional sell bias early in the auction.
From there, the session remained persistently offered. Total imbalances hovered between -$1.5B and -$1.8B through most of the window, with sell pressure consistently dominating. Notably, the $PCT leaned between -62% and -70% for the majority of the session, indicating steady directional selling rather than rotational flows. The slight moderation into the close (-60.3% at 16:00) reflects some late buy participation, but not enough to shift the overall tone.
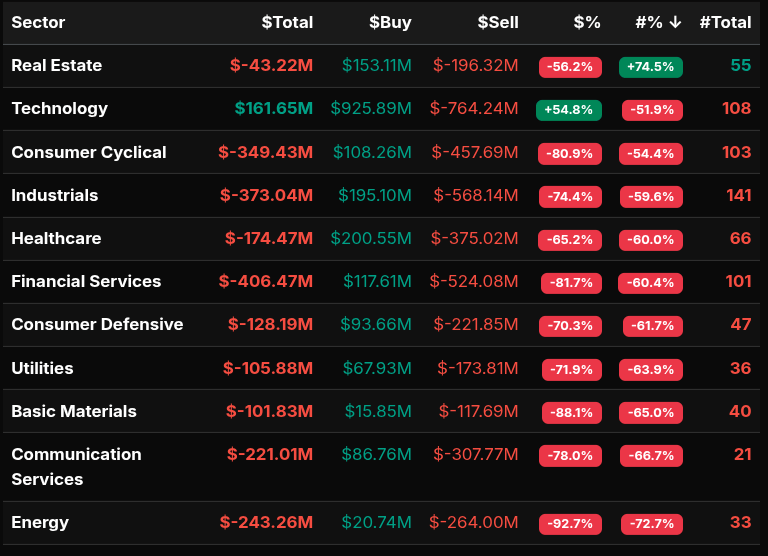
Sector-wise, this was a near-universal liquidation. Energy (-92.7%), Basic Materials (-88.1%), and Financials (-81.7%) showed extreme sell-side dominance—well beyond the -66% threshold—indicating wholesale institutional exits. Industrials, Consumer Cyclical, and Communication Services also printed deeply negative, reinforcing the broad risk-off posture. Technology stood out as the lone buy-leaning sector (+54.8%), suggesting relative strength and selective accumulation rather than outright rotation.
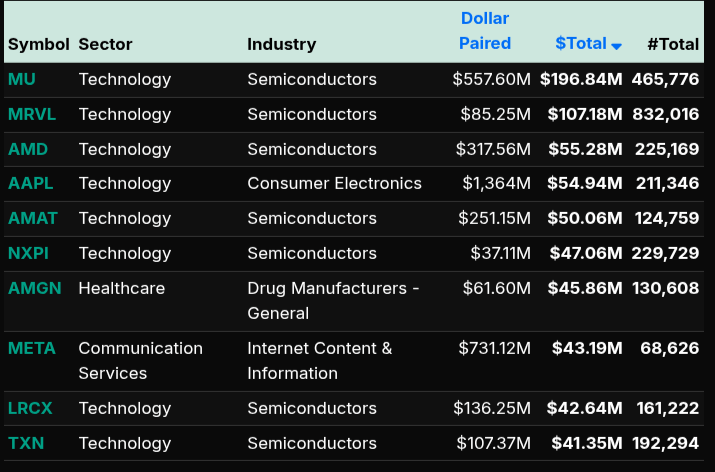
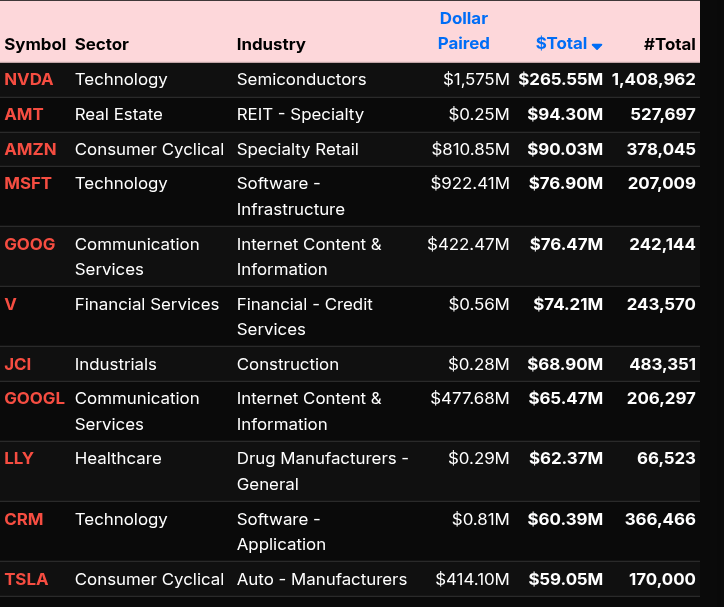
At the symbol level, flows were concentrated and telling. NVDA (+$265M), MU (+$196M), and MRVL (+$107M) led the buy side, highlighting strong semiconductor demand. Additional accumulation in names like AMD, AAPL, and AMAT confirmed a clear tech/AI-driven bid. Meanwhile, sell pressure was expressed through broader index and cyclical exposure, with names like AMZN and TSLA showing weaker participation relative to their sectors.
Overall, this MOC was not rotational—it was directional. With aggregate leans of -66.7% (dollar-weighted) and -57.0% (symbol count), the session reflected systematic de-risking into the close, with capital concentrating narrowly into large-cap technology while exiting cyclicals and macro-sensitive
Technical Edge
Fair Values for April 13, 2026
-
SP: 37.03
-
NQ: 160.07
-
Dow: 195.47
Daily Breadth Data 📊
For Friday, April 10, 2026
• NYSE Breadth: 43% Upside Volume
• Nasdaq Breadth: 58% Upside Volume
• Total Breadth: 53% Upside Volume
• NYSE Advance/Decline: 44% Advance
• Nasdaq Advance/Decline: 40% Advance
• Total Advance/Decline: 42% Advance
• NYSE New Highs/New Lows: 90 / 53
• Nasdaq New Highs/New Lows: 178 / 177
• NYSE TRIN: 1.07
• Nasdaq TRIN: 0.48
Weekly Breadth Data 📈
For Week Ending April 10, 2026
• NYSE Breadth: 55% Upside Volume
• Nasdaq Breadth: 67% Upside Volume
• Total Breadth: 63% Upside Volume
• NYSE Advance/Decline: 68% Advance
• Nasdaq Advance/Decline: 40% Advance
• Total Advance/Decline: 51% Advance
• NYSE New Highs/New Lows: 220 / 122
• Nasdaq New Highs/New Lows: 410 / 419
• NYSE TRIN: 1.77
• Nasdaq TRIN: 0.33

Today’s BTS Levels:
ES M
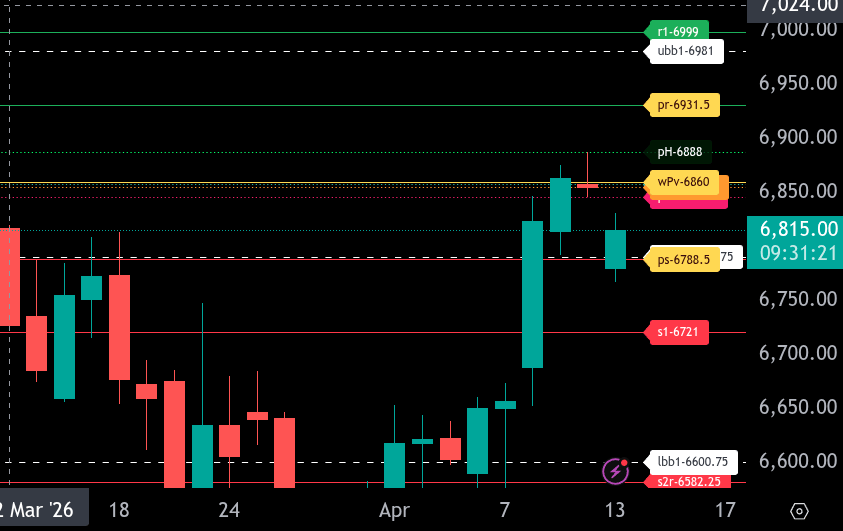
The bull/bear line for the ES is at 6860.00. This remains the key pivot for today’s session. Acceptance above this level will shift momentum back to the upside, while continued rejection keeps the market in a weaker, corrective posture.
Currently, ES is trading around 6815.00, holding below the bull/bear line after a strong prior push higher. This puts the market in a neutral-to-bearish stance early, with sellers defending the 6860.00 area. If price continues to stay below this level, look for a move down into 6788.50, which is the lower range target for the session. A break below 6788.50 opens the door to 6721.00, with further downside extension toward 6600.75 if selling accelerates.
On the upside, initial resistance comes in at 6888.00, just above the bull/bear line. A clean break and hold above 6860.00 should lead to a test of 6888.00, followed by the upper range target at 6931.50. If buyers can push through 6931.50, the next major upside objective sits near 6981.00.
Overall, the market is in a decision zone around 6860.00. Below it, expect rotational to lower trade targeting 6788.50 and potentially 6721.00. Above it, momentum shifts back to buyers with 6888.00 and 6931.50 as key upside targets. Patience around the bull/bear line will be critical early in the session.
NQ M
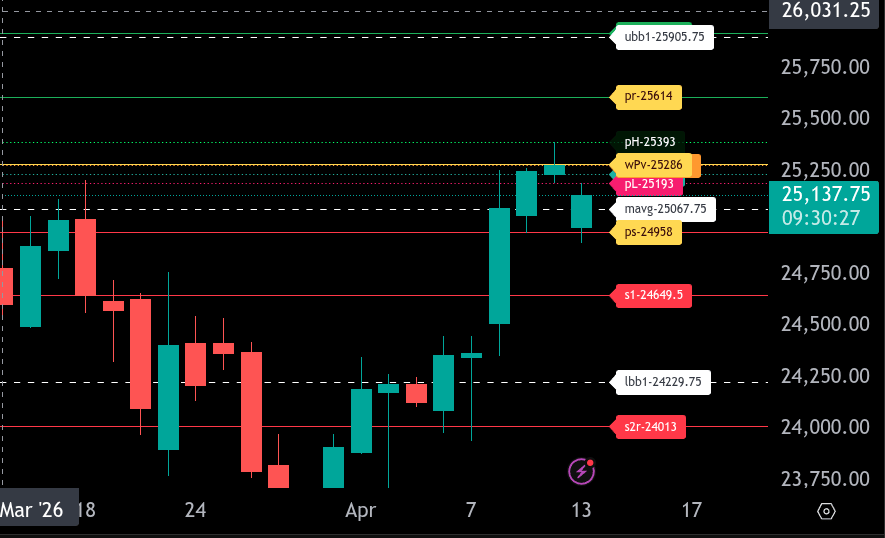
The bull/bear line for the ES is at 25286.00. This is the key level that will dictate intraday sentiment. Holding below this level keeps the market in a weaker posture, while reclaiming it shifts momentum back to the upside.
ES is currently trading around 25137.75, remaining below the bull/bear line. As long as price stays under 25286.00, downside pressure remains in play, with an initial move toward 24958.00 as the lower range target. A break and acceptance below this level opens the door to further downside continuation toward 24649.50 and potentially 24013.00.
On the upside, resistance comes in first at 25193.00 and then 25393.00. A reclaim of 25286.00 followed by acceptance above 25393.00 would signal strengthening bullish momentum, opening the path toward 25614.00, which is the upper range target for the session. Above that, 25905.75 becomes the next major upside extension level.
Overall, the market is attempting to stabilize after a strong move higher, but remains below the key pivot at 25286.00. Sellers maintain control unless that level is reclaimed, while buyers need sustained acceptance above it to continue the upward trend.
Room Summaries:
Polaris Trading Group Summary – Friday, April 10, 2026
Friday was a lighter, more rotational “FRYday” session in the PTG room. David emphasized caution early and stayed consistent with that tone as the day developed. The market did not offer a clean expansionary move for much of the session, so the focus was on trading lighter, respecting levels, and protecting capital into a potentially headline-driven weekend.
Opening Tone / Market Context
-
Standard PTG morning setup with links, disclaimer, and mindset quote to start the day.
-
Early observation from Ram that price hit the D-level and reversed, giving the room an important structural read before the main session.
-
David also reminded traders in funded accounts to review prop firm rules around announcements.
Morning Trade Read
-
The market felt choppy and rotational rather than directional.
-
David summed it up as “Vee—Waap Chop!”
-
Best guidance of the morning: “Keep it Light…Keep it Tight until there is an expansionary move.”
-
Ram commented it felt like a “summer Friday,” which matched the slower, less committed price action.
Positive Trade / Process Notes
-
Blibby reported being “50%+ done” early, a nice sign of getting paid quickly and not overstaying.
-
Ram’s early D-level reversal read was one of the better market calls mentioned in chat.
-
Peter shared a solid adjustment in sizing down to 5 micros and focusing on base-hit trades, which fit the day’s conditions well.
-
The room overall showed good awareness of adapting to the market rather than forcing bigger trades in chop.
Risk Management Lessons
-
David’s reminder about prop firm rules around announcements was especially important for funded traders.
-
Ram noted he does not trade during big news events, but still studies the chart reactions — a strong example of discipline.
-
Peter shared a costly lesson about losing $2,000 after overshooting a prop daily limit.
-
Big takeaway: on slower, trickier sessions, rule discipline matters just as much as trade selection.
Room Education / Coaching Themes
-
David reinforced patience and capital preservation over aggression.
-
The discussion around smaller size, base hits, and waiting for expansion fit PTG’s emphasis on staying aligned with market conditions.
-
Dani’s arrival added some good conversation around trader development and self-awareness, which tied into the broader “trader way” mindset discussion.
Late-Day / Closing Tone
-
By late morning, the session still appeared to be shaping into a “D” type day.
-
Geopolitical headlines around Iran and Trump shifted attention toward possible weekend risk.
-
David flagged it as looking like a possible “risk-off” weekend play.
-
He closed with the key message of the day: “Capital Preservation FRYday folks!”
-
Final note: MOC Sell Imbalance came in at $2 Billion, reinforcing the defensive tone into the close.
Main Takeaways
-
Respect key reference levels like D-levels.
-
In chop, reduce size and focus on base hits.
-
Be extra careful around news events and funded account rules.
-
On a Friday with headline risk, capital preservation is a win.
DTG Room Preview – Monday, April 13, 2026
-
Macro focus: Middle East conflict and the Strait of Hormuz blockade remain the dominant drivers of sentiment, with geopolitics continuing to outweigh inflation data and broader macro inputs.
-
Geopolitics: Weekend US-Iran talks failed, and Trump responded by announcing a US naval blockade on traffic entering and exiting Iranian ports while allowing other vessels to transit the strait starting Monday at 10:00 ET. Iran warned it would not accept the embargo and threatened to respond, keeping escalation risk elevated.
-
Oil watch: Crude surged nearly 8% following the blockade announcement. Market participants are now focused on how long the disruption lasts, with some warning a prolonged standoff could drive a much sharper move higher in oil.
-
Volatility: Friday’s inflation data had limited market impact, reinforcing the view that Middle East developments remain the main volatility driver. Even with vol collapsing into the end of last week, ES 5-day ADR held at 103.
-
Earnings: Q1 earnings season begins this morning with Goldman Sachs. Tuesday’s key reports include BlackRock, Citigroup, Johnson & Johnson, JPMorgan, and Wells Fargo.
-
Today’s data: Existing Home Sales at 10:00 ET. Otherwise a light economic calendar.
-
Market conditions:
-
Whale bias leaning bullish into the US session open
-
Stocks remain relatively buoyant despite geopolitical risk
-
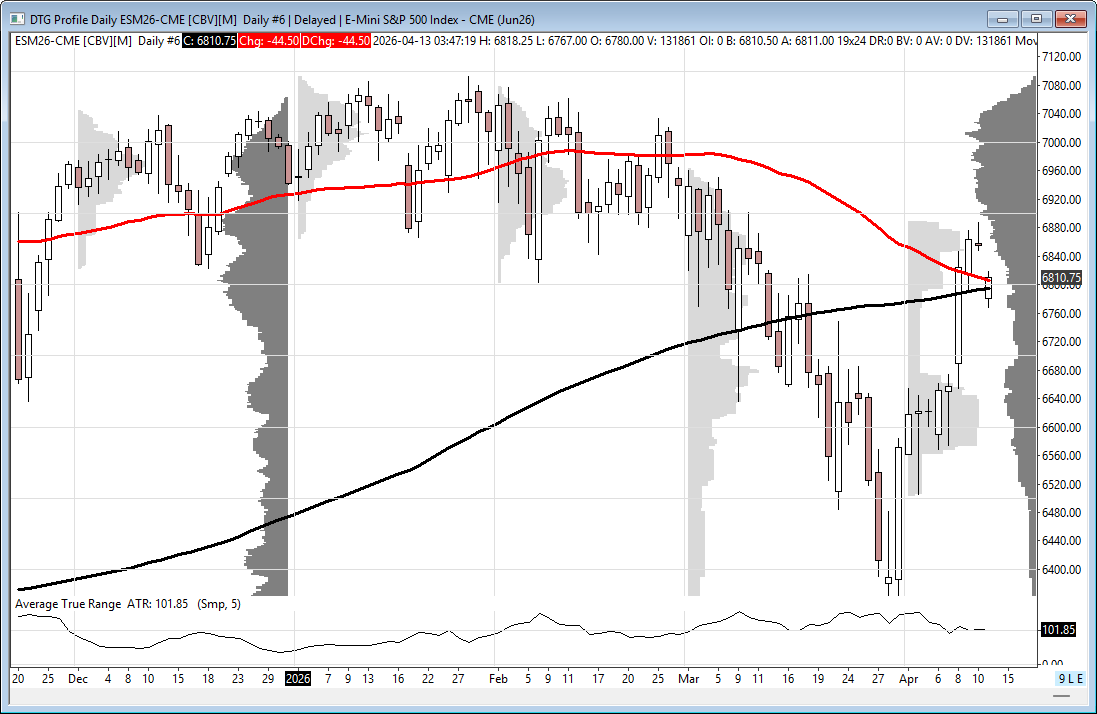
Bulls regained the 50-day MA (6806.50) and 200-day MA (6795), which are now acting as loose support
-
-
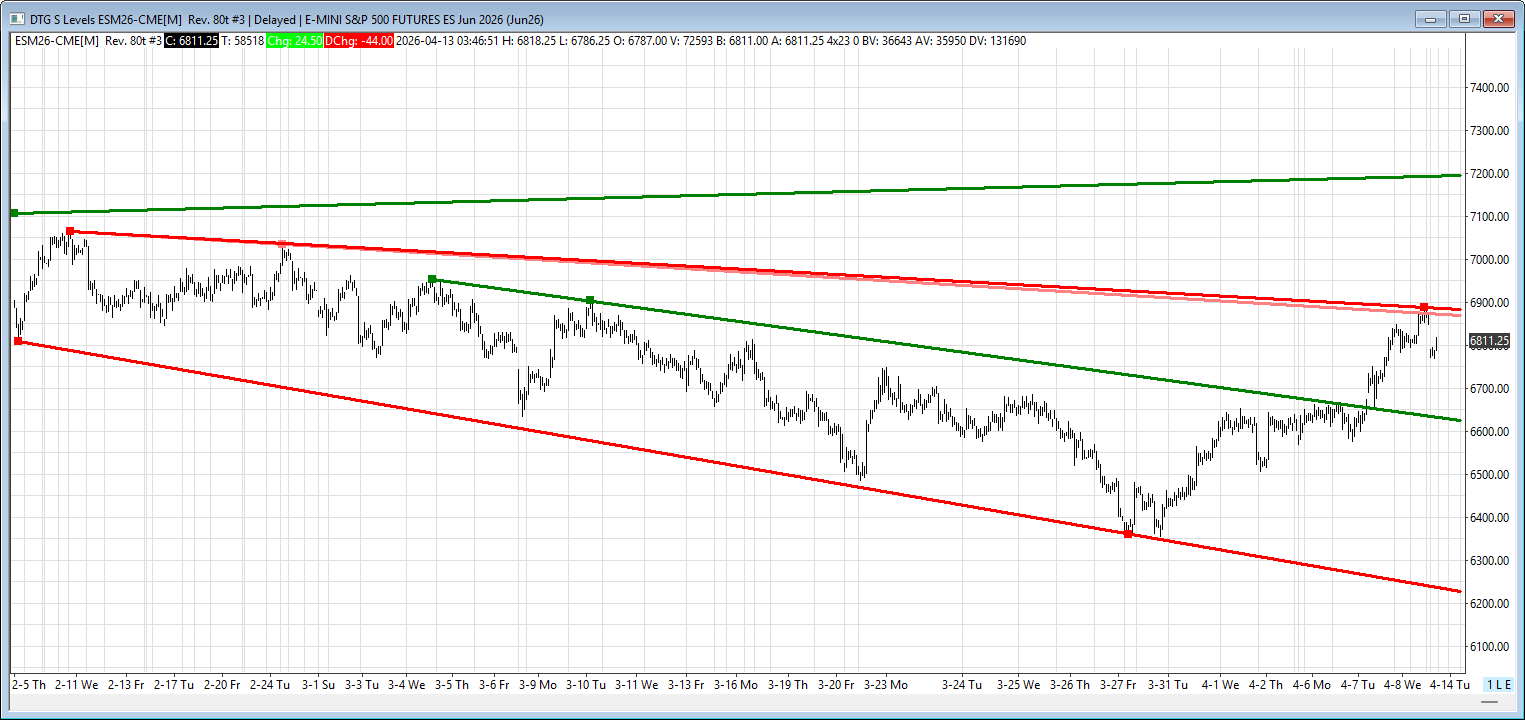
ES Technicals:
-
Resistance: 6887/84s, then 7195/00s
-
Support: 6627/22s, then 6225/20s
-
Intermediate-term downtrend channel top at 6887/84s held Friday’s highs
-
Bulls need a clean break above that trendline resistance to open a move into the 6900s
-
Bears still have room to work lower toward 6627/22s if momentum fades
-
-
Bottom line: Geopolitics remain firmly in control heading into the open. Bias is modestly bullish for now, but bulls still need to reclaim and clear 6887/84s to extend higher; otherwise, the broader trend structure leaves room for a move back toward 6627/22s.
Affiliate Disclosure: This newsletter may contain affiliate links, which means we may earn a commission if you click through and make a purchase. This comes at no additional cost to you and helps us continue providing valuable content. We only recommend products or services we genuinely believe in. Thank you for your support!
Disclaimer: Charts and analysis are for discussion and education purposes only. I am not a financial advisor, do not give financial advice and am not recommending the buying or selling of any security.
Remember: Not all setups will trigger. Not all setups will be profitable. Not all setups should be taken. These are simply the setups that I have put together for years on my own and what I watch as part of my own “game plan” coming into each day. Good luck!
This post goes out as an email to our subscribers every day and is posted for free here around 2 PM ET. To get your real-time copy, sign up for the free or premium version here: Opening Print Subscribe.
Comments are closed