This post goes out as an email to our subscribers every day and is posted for free here around 2 PM ET. To get your real-time copy, sign up for the free or premium version here: Opening Print Subscribe.
Can Nvidia Turn The AI Tide?
Follow @MrTopStep on Twitter and please share if you find our work valuable!
Our View
Remember the phrase from Star Wars: “May the force be with you?” Well, that’s where we are. I tried to explain why the NVDA earnings would be good—because everyone was short into the event—and that the PPT doesn’t want the markets to crash.
I also told the PitBull that this decline wouldn’t last into the end of the month and that there would be a big month-end rip and a push back up in December. That said, the markets are volatile because everything is so unstable, and the Bureau of Labor Statistics’ decision to do three months of jobs data all at once is just nuts.
How can the banks or the government quote treasuries? It’s like an extension of the economic blackout caused by the government shutdown.
Our Lean
I have an old saying: you’re supposed to embrace the chop—but that hasn’t been easy to do. Yes, the sellers have had the upper hand, but we all know how these declines end. It takes days and weeks to knock the ES down, and only one day—or just a few—to turn it around.
Like I said yesterday, I think people are getting chopped up. My guess is we see a decent pullback and then rally again. I’m not ready to say the selloff is over, but NVDA’s earnings were a good start and will help push up some of the beaten-down tech and AI names. And chopping up the September jobs numbers is probably a positive, too.
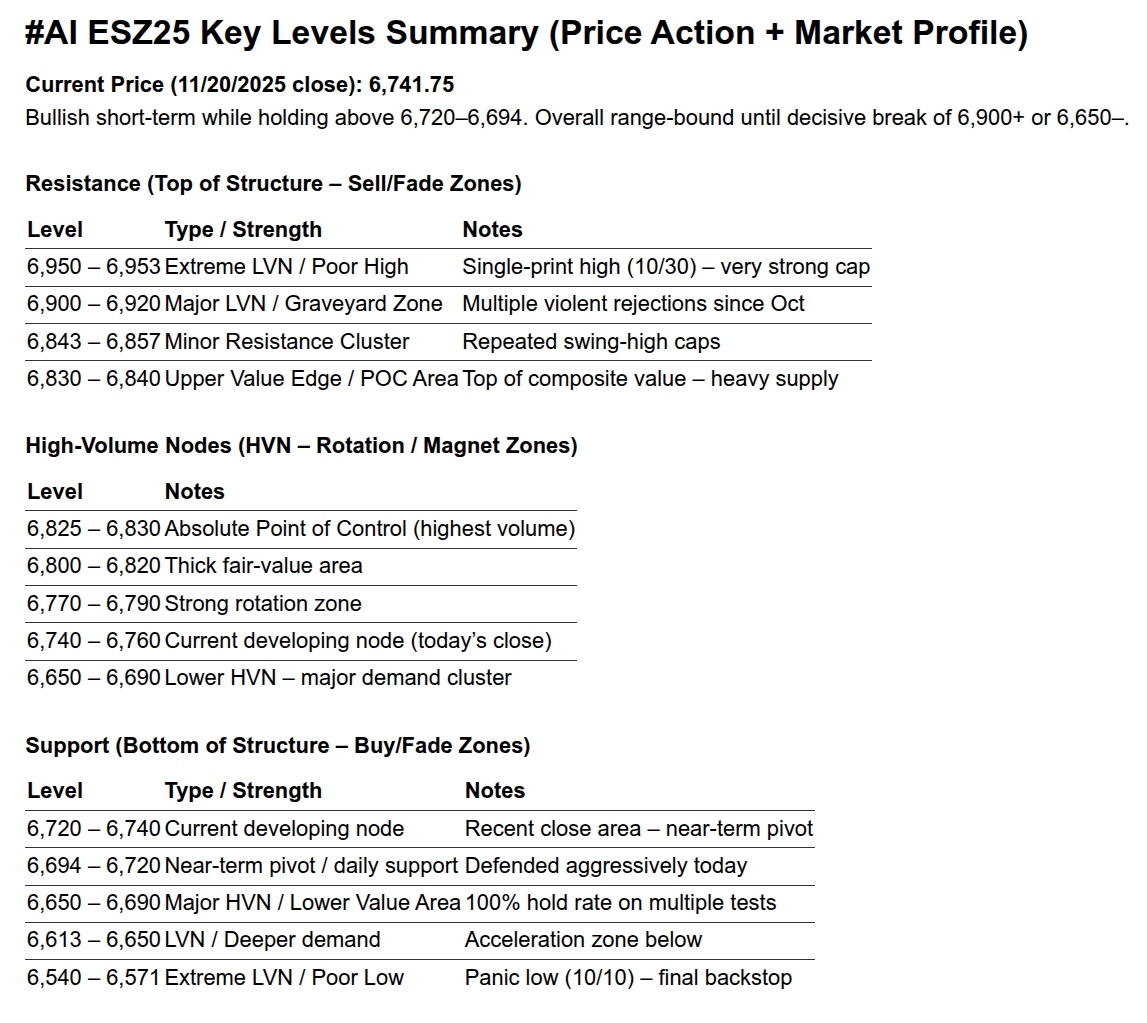
Below are my AI levels. I’m long again with a big lead. I’ve been trying for the last 6 days to hold a long ES, thinking that when the constant NQ selling lets up, the S&P and Nasdaq will start to recover. NVDA’s numbers were monstrous and could be a turning point for some of the non-stop tech/AI selling.
I don’t think 6800–6830 is unreasonable. Remember how big the moves were yesterday and how far both the ES and NQ have rallied. Yesterday’s pullback could all be part of FRYday, the Week 3 options expiration, and a gamma explosion.
Thin to Win and the End of November
Like I told the Bull: the ES is going to rally into the end of November. During U.S. Thanksgiving week, CME Equity Index Futures (ES, NQ, etc.) and Interest Rate Futures will follow normal hours until a regular but early-close session on Wednesday, November 26 (normal open at 6:00 PM ET the prior evening, closing at 5:00 PM ET).
Markets will be fully closed all day on Thanksgiving Thursday, November 27 (no trading from 6:00 PM ET Wednesday to 6:00 PM ET Thursday), and resume with a holiday-shortened session on Friday, November 28 (pre-open 5:45 PM ET, regular open 6:00 PM ET, early close 1:15 PM ET).
That leaves only four trading days left in November counting today, with next Friday counting as a half-day.
From Jeff Hirsch from @AlmanacTrader
Week before Thanksgiving Historically Bullish, But Mixed Recently
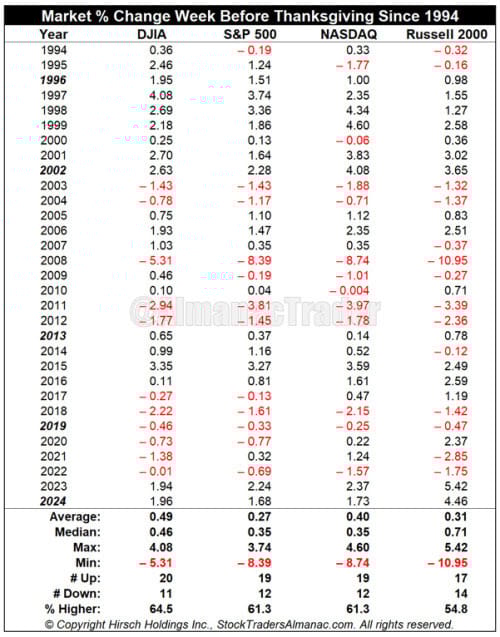
DJIA has a fair track record over the last 31 years, rising 20 times the week before Thanksgiving with an average gain of 0.49% in all years. But the other major U.S. stock market benchmarks are not as strong and there has been more weakness the past eight years. Since 2017, DJIA has advanced just twice during the week before Thanksgiving.
Over the same time frame, S&P 500 and NASDAQ have both been up 19 times, with average gains of 0.27% and 0.40% respectively. Russell 2000 has been the weakest, up 17 times but with an average gain of 0.31%. During the last two years, the week before Thanksgiving, has enjoyed solid across-the-board gains lead by impressive back-to-back Russell 2000 gains exceeding 4%.
This year, the week before Thanksgiving is also November’s monthly option expiration week. This is not always the case. In some years like 2024, the week before Thanksgiving was the week after November’s monthly option expiration. Those years are noted in bold, italic in the accompanying table. Historically, the week before Thanksgiving has been slightly more bullish than November’s option expiration week.
Any weakness this week could potentially be a set up for the historical Thanksgiving trade of buying into weakness the week before Thanksgiving and selling into any strength around the holiday and/or during typical November end-of-month strength. Given heightened market volatility recently, trade management is likely to be even more important during this year’s Thanksgiving trade.

Market Recap:
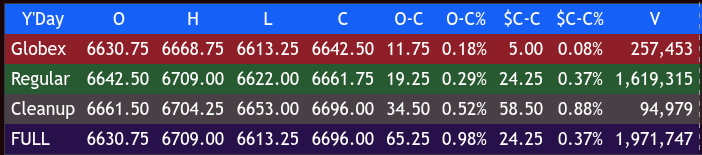
The ES and NQ had another wild day of swings ahead of the Nvidia earnings report. The ES traded down to 6613.25 and up to 6668.75 on Globex, then opened Wednesday’s volatility-filled session at 6642.50.
After the open, the ES quickly traded down to 6635.75, then rallied 73.25 points up to 6709.00 at 10:15. It then sold off 86.5 points down to 6622.50 at 12:40, rallied back up to 6668.75—just 3 ticks below the RTH high of 6669.50—then traded down to 6642.75 at 1:45. From there, it rallied up to a lower high at 6665.25 and then sold back off down to 6628.25 at 2:38.
After that low, the ES rallied to 6655.50 at 2:55, sold off to 6679.75, dropped down to 6664.24 at 3:24, then rallied up to 6683.50 at 3:35. It sold off again down to 6652.75 at 3:47 and traded 6656.75 as the 3:50 cash imbalance showed small to buy. That widened to $1.6 billion to buy. The ES then traded down to 6656.00, rallied to 6671.75, dropped to 6659.75 at 3:58, and traded 6651.75 on the 4:00 cash close.
After 4:00, the ES rallied back up to 6665.00 as the market waited for NVDA to report Q3 earnings. It then shot up to 6696.00 at 4:21, pulled back, and traded up to 6699.76 after Nvidia delivered a strong beat:
-
Q3 revenue: $57.0B (vs $55.2B est)
-
EPS: $1.30 (beat)
-
Data Center: $51.2B (beat)
-
Margins: 73.6%
-
Raised Q4 guidance to $63.7–66.3B (well above $62B consensus)
AI demand remained red-hot, and NVDA jumped +3% after-hours.
The ES settled at 6661.50, up 21.75 points or +0.33%. The NQ settled at 24,721.75, up 126 points or +0.51%.
In the end, there were so many 30, 50, 80, and 100-point swings that it was hard to keep up with. In terms of the ES’s overall tone, it was the same price action—sell the dead cat rips.
In terms of the ES’s overall trade, volume was 1.977 million contracts traded, down from Tuesday’s 2.514 million contracts.
OnTap – BLS Jobs Flip-Flop

The Labor Department has canceled the full October 2025 jobs report because the 43-day government shutdown prevented the household survey needed to calculate the unemployment rate, and that data cannot be collected retroactively.
Instead, the available October payroll figures from employers will be combined with November’s data and released together in a full November jobs report on December 16. As a result, the September jobs report being released today will be the last complete labor market snapshot Federal Reserve policymakers have before their December 9–10 meeting, where they will decide on interest rates without fresh October unemployment figures.
Earnings
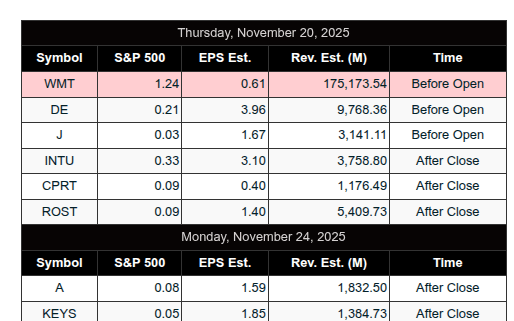
Pre-market earnings from $WMT Walmart (7 AM, holiday guidance key), $NTES NetEase, $J Jacobs Solutions, and $WMG Warner Music.
After the close (4–6 PM ET), we get earnings from $INTU Intuit (AI and tax-software focus), $ROST Ross Stores (off-price retail read), $DASH DoorDash, $VEEV Veeva Systems, and $CPRT Copart.
Futures Action
Both the ES and NQ continued to rally on Globex.
The ES traded up to 6743.25, that’s a 130.50-point rally off the 6612.75 Globex low, and 121.25 points off its 6622.00 low at 12:39.
The NQ traded a high of 25,162.00, a 717-point rally off Wednesday’s 24,445.00 Globex low, and 654 points off the 12:36 low at 24,508.
MiM
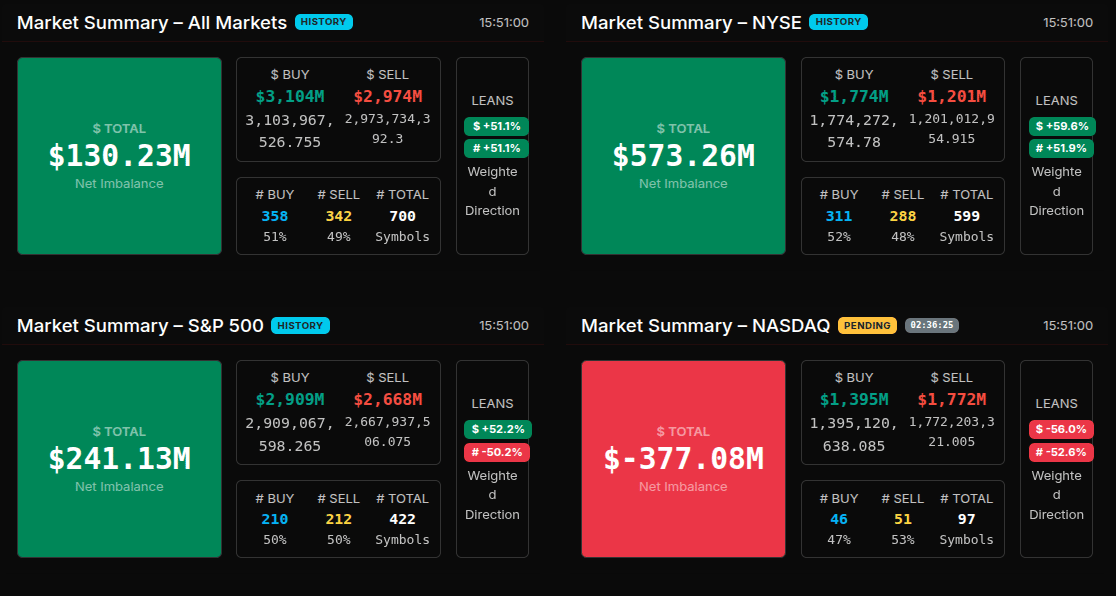
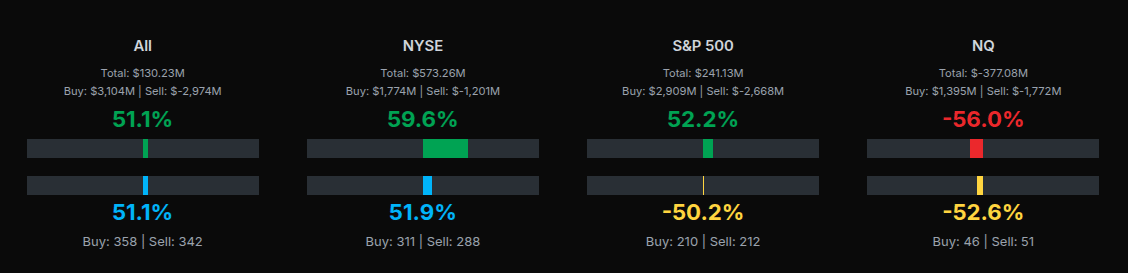
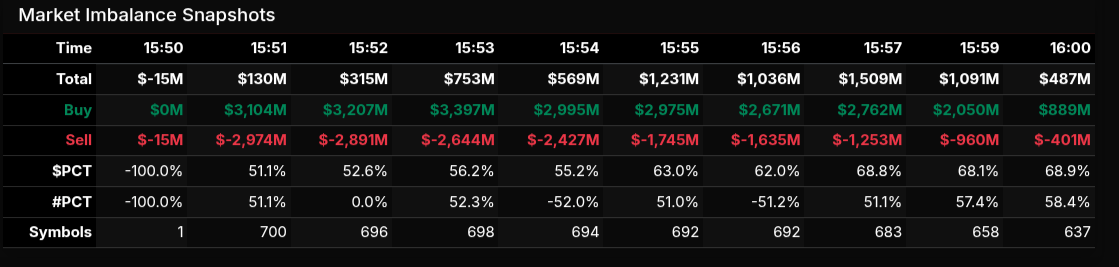
The MOC opened soft but quickly transitioned into a broad-based buy program, led by strong NYSE demand that overshadowed weakness in Nasdaq. At 15:50, the tape showed a small –$15M net imbalance, but within one minute it flipped to +$130M, driven by a surge of $3.1B buy interest against $2.97B in sells. That early pivot set the tone: the first wave leaned 51% buy, a rotational but constructive start.
The NYSE was the engine. It printed a $573M net buy with a 59.6% lean—well above the wholesale threshold—and maintained that bias through the entire window. Symbol counts confirmed it: 311 buys vs 288 sells, a mild breadth edge. S&P 500 flows tracked similarly, finishing at +$241M with a 52.2% lean, a classic rotational imbalance rather than a directional stampede.
The outlier was Nasdaq. It remained negative longer, but by 15:53, it was joining in the buy party as the sell side paired off much faster than the buy side, showing bullish tendencies.
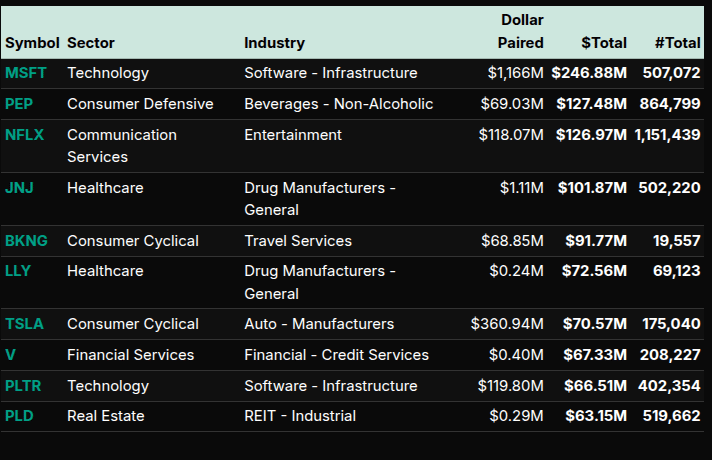
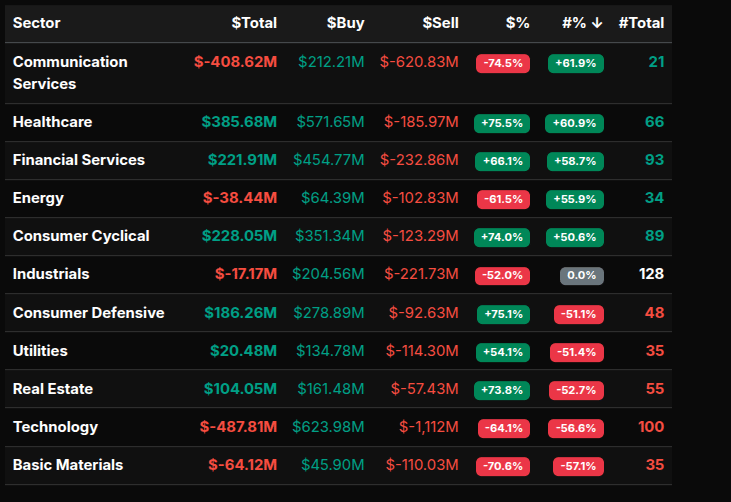
On the buy side, Healthcare led with +$385.7M (lean +75.5%), followed by Financials (+$221.9M, lean +66.1%). Consumer Cyclical and Real Estate also saw strong buying.
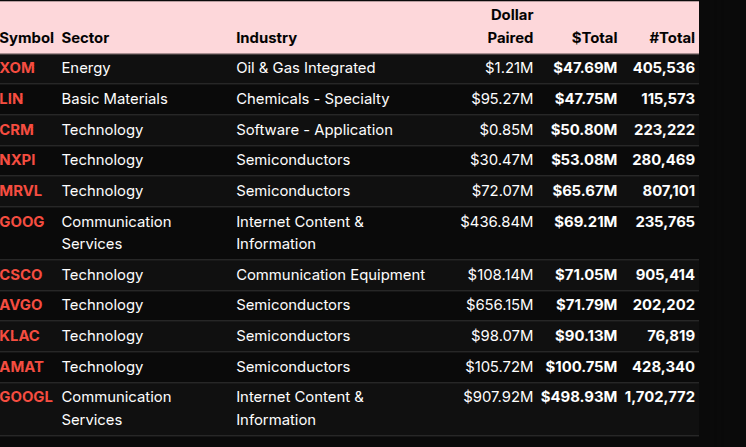
Symbol-level flows showed concentrated institutional demand in MSFT, PEP, NFLX, JNJ, and PLTR, while the largest sell programs hit XOM, LIN, CRM, MRVL, AVGO, GOOGL, and GOOG. Several names showed leans above ±66%, indicating true wholesale activity—particularly the big-cap tech sells.
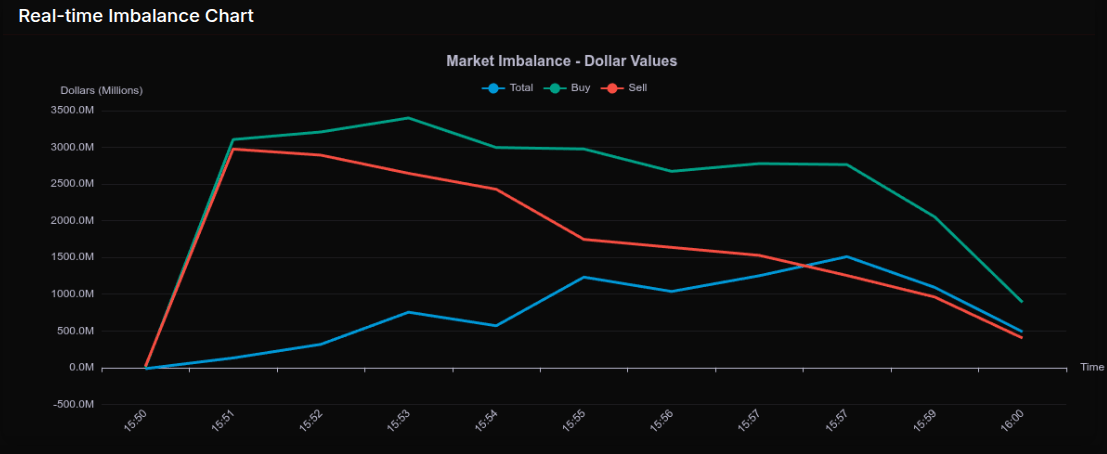
The intraday curve peaked early: by 15:53, total buy interest hit $3.39B, then gradually backed off toward the close. ES mirrored this flow, lifting into 15:57 before fading into the 16:00 match at 6662.75, about seven points off the 15:56 high.
Net takeaway: broad NYSE and SPX buying produced a mixed but ultimately positive MOC dominated by defensive and financial sector inflows while tech bore the brunt of the liquidation.
Guest Posts:
Dan @ GTC Traders
Different Takes on Being Short and Taking Profit
We have been somewhat public in our social media streams, that as of late, our longer term core holdings have been hedged up. And our Long-Short Valuation book was running a pure short against the index through a specific short-only equity strategy we designed.
Great.
Wonderful.
Any idiot can get involved in a trade, and it begins to go in their favor and have unrealized gains. That’s not the trick of trading.
The real question was: what to do once you have a winner?
Well, as we said in our “How to Begin Investing and Trading” series (yes, yes, we’re still flushing that series, and more content is on the way) … we have stated that you need to understand the objective of any account. What is it you are trying to do?
Understanding your objective and how objectives differ is going to help answer that question. Different trading programs and accounts with different objectives will have different ways they approach managing winning trades and taking profits.
Take for example, our Equity Fixed Income Hybrid Core. What is the objective of that account?
Holding assets for a long period of time, building yield-on-cost … taking the dividends, coupons and distributions so you can build an account that will pay you an income.
Ok, then think about that for a second … when it comes to the hedge that we have currently placed against the market in that account ( presently that means that we have roughly 9% of the net-liq of the account short the S&P 500 Index in the Equity Fixed Income Hybrid Core ). Why do we have that hedge on at the moment? To protect the fluctuating value of the assets we hold, right?
Ok.
Then doesn’t it make sense, that you may want to hold such a hedge … for a longer period of time until such time on longer periodicities … that either:
A ) the danger is over, and the bulls clearly have control, and the downside risk is no longer present as the market rally continues or …
B ) the market appears to be bottoming out, and your hedge has protected a down turn and the bulls are making a firm stance
That makes sense, right? You’re trying to protect the held assets … and since that is the objective? You want to hold that hedge for as long as possible.
But then look at the Long-Short Valuation Account. What is the difference in the long-short valuation account? Shorter periodicity long-short valuation trades based around value. Right? Look at our “Neutral-Carry Short” Program that we are running at 100% of the account. The ‘barbell-carry’ is printing positive basis points regardless of what the market does.
So we can hold onto the short for a longer period of time. Even if we do take profits earlier, the account instantly goes back those positive basis points, regardless of market direction. So in the Valuation account, we are not trying to protect the value of something else. The objective is simply to print basis points. The “Neutral-Carry Short” program is not trying to protect other assets, as the hedge is in the Equity Fixed Income Hybrid Core Program.
Do you see how the difference in the objective, can differ how you look at the same type of short against the market?
So, yesterday afternoon, we had the Nvidia earnings ahead of us. We did not know if that would portend good, or bad for Equity Indices. And we didn’t need to pretend to know.
So as mentioned in our chat … we took profits on our Valuation short before earnings were released as the market was on a down leg…
Now the carry can continue to move that account higher as we look for another short entrance down the road.
But we kept the hedge, in the Equity Fixed Income Hybrid Core. Two different Programs. Two different objectives. And this meant two different approaches, to the same profitable type of trade.
The difference?
Objective.
Until next time, stay safe and trade well …
Technical Edge
Fair Values for November 20, 2025
-
S&P: 18.52
-
NQ: 78.17
-
Dow: 67.25
Daily Breadth Data 📊
For Wednesday, November 19, 2025
• NYSE Breadth: 38% Upside Volume
• Nasdaq Breadth: 44% Upside Volume
• Total Breadth: 43% Upside Volume
• NYSE Advance/Decline: 38% Advance
• Nasdaq Advance/Decline: 40% Advance
• Total Advance/Decline: 39% Advance
• NYSE New Highs/New Lows: 33 / 141
• Nasdaq New Highs/New Lows: 82 / 382
• NYSE TRIN: 1.08
• Nasdaq TRIN: 0.83
Weekly Breadth Data 📈
For the Week Ending Friday, November 14, 2025
• NYSE Breadth: 48% Upside Volume
• Nasdaq Breadth: 49% Upside Volume
• Total Breadth: 49% Upside Volume
• NYSE Advance/Decline: 45% Advance
• Nasdaq Advance/Decline: 41% Advance
• Total Advance/Decline: 43% Advance
• NYSE New Highs/New Lows: 286 / 170
• Nasdaq New Highs/New Lows: 401 / 522
• NYSE TRIN: 0.85
• Nasdaq TRIN: 0.71
BTS Levels:
ESZ2025
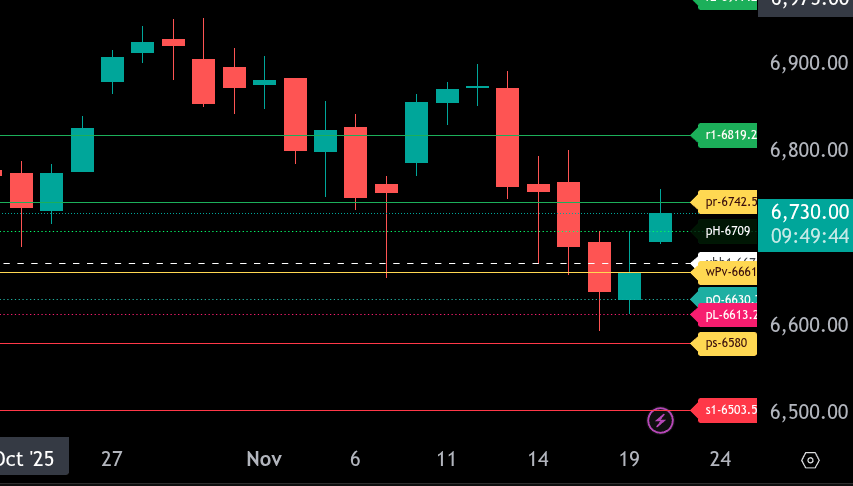
The bull/bear line for the ES is at 6661.25. Price is currently trading near 6730.00, holding above this line and showing early-session strength.
Upside, the immediate target is 6742.50, the upper range target for today. A sustained push through this zone opens room toward 6819.25, which is the next major resistance level.
Downside, first support sits at 6630.75. Below that, the lower range target comes in at 6580.00. A break under 6580.00 exposes deeper support at 6503.50.
As long as ES stays above 6661.25, the bias favors continued attempts higher. A move back below that level shifts momentum toward testing supports and the lower range target.
NQZ2025
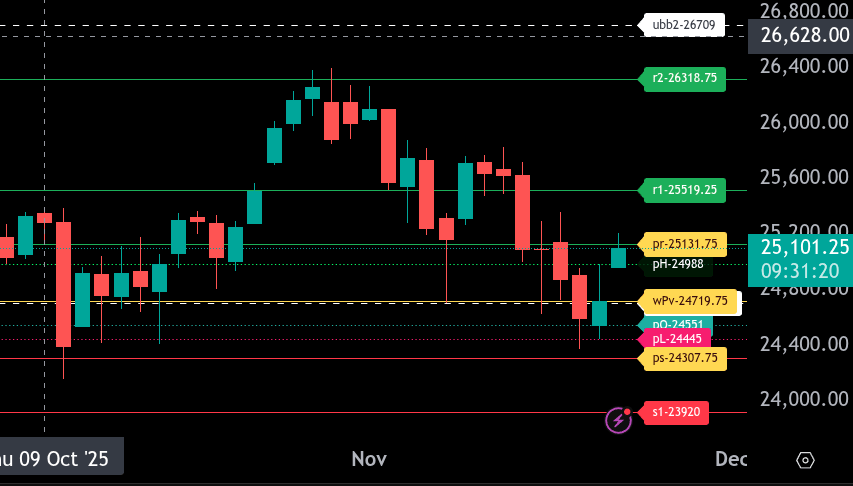
The bull/bear line for the NQ is at 24,719.75. Trading above this level shifts bias to the upside; below it keeps pressure on the downside.
NQ is currently trading near 25,082.25 in the Globex session, comfortably above the bull/bear line. This favors continuation higher if buyers hold above 24,719.75.
Resistance overhead includes 24,988 and the upper target at 25,131.75. A sustained move through this area opens the door for further upside toward minor resistance levels around prior session highs. Clearance above 25,131.75 strengthens bullish momentum.
Lower range target is down near 23,920. A move back below the bull/bear line would target intermediate supports at 24,551 and 24,445 first, then 24,307.75 on deeper pressure.
Holding above 24,719.75 keeps buyers in control for now.
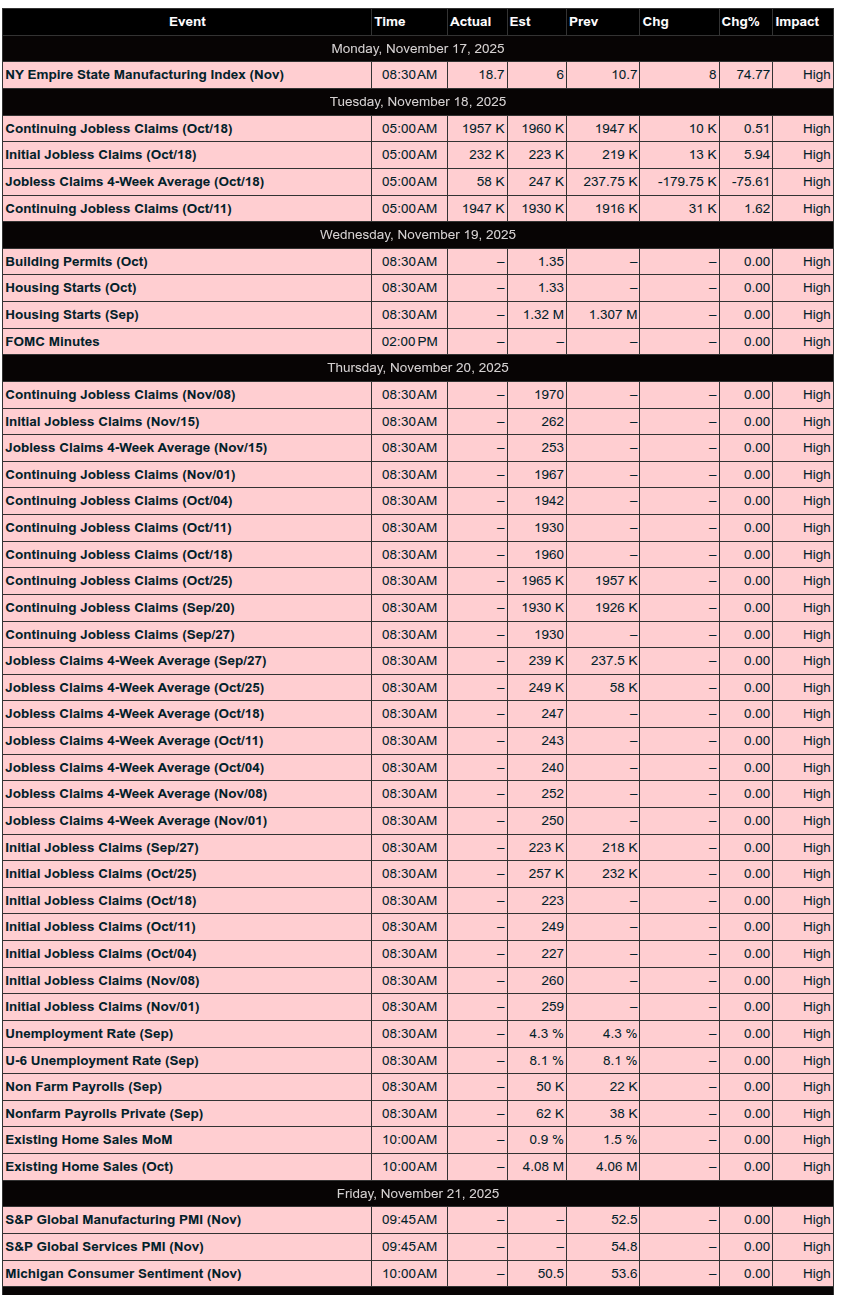
Economic Calendar Today
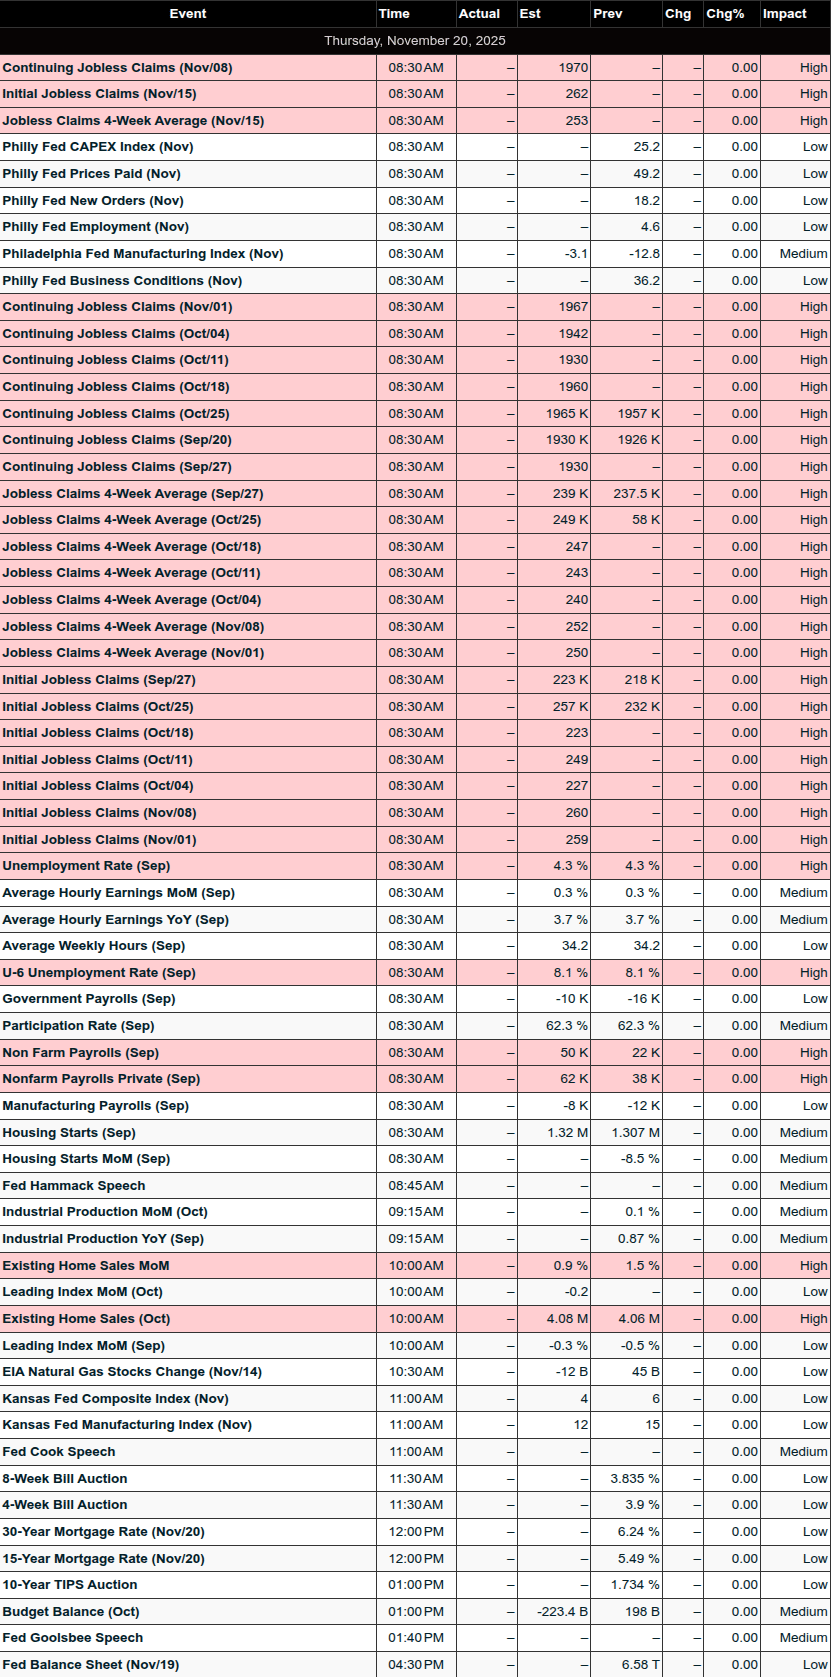
This Week’s High Importance
Earnings:
The bull/bear line for ES is 6876.00. Price is trading below this level, showing continued weakness in the Globex session.
Upside, the first resistance sits at 6900.50, followed by the upper range target at 6928.50. A push through these levels opens the door toward 6977.75 and yesterday’s high near 6985.75.
Downside, support comes in at 6852.00, then the lower range target at 6823.50. Below that, the next major support is 6774.25.
ES remains bearish while below 6876.00. A reclaim and hold above this level is needed to shift momentum back toward the upper targets.Released
Trading Room News:
PTG Room Summary – Wednesday, November 19, 2025
Yesterday’s session was a high-volatility, two-sided trading day marked by a strong opening squeeze, intraday reversals, and ultimately a waiting game ahead of Nvidia’s earnings release. Both upper and lower trade plan targets were hit with precision in the ES and NQ, showcasing excellent premarket preparation. Several solid trade setups played out, and the day was packed with market lessons and strong reminders about discipline, psychology, and adaptability.
Premarket & Trade Plan
-
Manny posted a comprehensive multi-zone trade plan, including several support buys, a resistance sell, and two LB&F (Look Below & Fail) setups.
-
ES key levels included 6642–6646, 6617–6621, and 6652–6656 for support buys, with resistance at 6717–6721.
-
PTGDavid noted both bullish and bearish scenarios centered around the 6640 pivot — both targets played out “near perfectly,” validating the Daily Trade Strategy (DTS).
Key Trades & Execution Highlights
-
Manny scored a +60 point gain from the 6642–6646 Support Buy zone, though he acknowledged exiting too early on some size. His best cover was +22 points from 6648 into the 6670s.
-
Bosier executed a well-managed short at 6653.25, scaling out into 51.25 and 52.75 — great scalp through volatile price action.
-
Additional support buy at 6642–6646 also yielded +5 and +10 point partials early in RTH.
-
Traders exercised good judgment avoiding shorts into an open drive squeeze, with several noting the lesson in restraint and not chasing extended moves.
-
Afternoon action turned highly volatile again with 15–20 handle swings — David described this as “double heartbeat city.”
Market Rhythm & Commentary
-
The initial open drive was flagged by David as a “jam-job squeeze” rather than genuine accumulation, confirmed by lack of follow-through and pullback weakness.
-
Market eventually settled into a “range-runner” rhythm — unpredictable and fast — as the day wore on.
-
Bulls successfully defended the 6620 prior value low by 2PM, but market drifted into a holding pattern ahead of Nvidia earnings.
Lessons & Observations
-
Emotional control was a major theme. Manny shared valuable personal growth on not acting on frustration or fear — “I curse and slam stuff, but I don’t act on the sting.”
-
Roy reflected on his evolving definition of “chasing” and how years of trading have made him more cautious, perhaps overly so.
-
David reminded the room: “Never think you’ve cracked the code… The market will take it back just as fast.”
-
“Starling Pattern” analogy was introduced — market following the lead order flow, reinforcing the need to track dominant players, not outguess randomness.
End of Day
-
Bulls had the ball late day, but the market lacked structure — described as a “crap shoot” with no clear rhythm.
-
MOC Buy Imbalance grew from $800M to $1.6B, helping lift the market to VWAP at close.
-
Final mood: A day of black eyes, bruising and broken egos, but rich with learning and opportunity.
Summary:
A high-opportunity day with a strong open, responsive support levels paying out, and volatility demanding fast reactions. The room did a solid job executing planned setups while avoiding common traps like chasing or fading aggressive moves. Emotional discipline and readiness to adapt were as important as the technicals today. Nvidia earnings loomed large into the close — setting the stage for tomorrow.
Standout Quote:
“Knowing is not enough. We must APPLY. Willing is not enough. We must DO.” – Bruce Lee
DTG Room Preview – Thursday, November 20, 2025
Nvidia Headlines Tech Rally
-
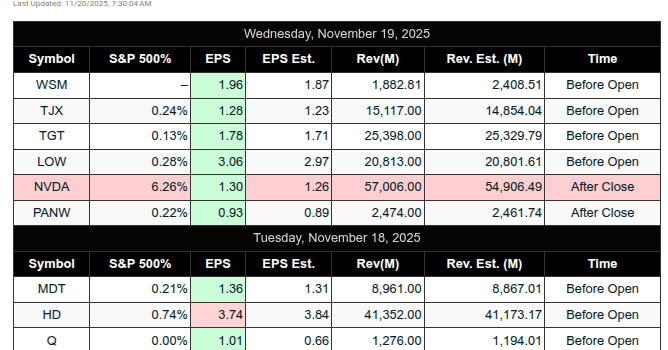
NVDA jumped +6.5% after-hours (closed +2.85%) on strong earnings:
-
EPS: $1.30 vs est. $1.26
-
Revenue: $57.01B vs est. $55.2B
-
Data Center: $51.2B vs est. $49.3B
-
Gaming: $4.3B vs est. $4.4B (slight miss)
-
-
CEO Jensen Huang: “Blackwell sales off the charts… AI is going everywhere, doing everything, all at once.”
-
AMZN, MSFT, GOOGL, META, MU all moved higher in after-hours on NVDA’s results
-
White House urges Congress to reject the GAIN AI Act, which would restrict AI chip exports to China
Economic Focus
-
September Jobs Report (delayed due to shutdown) due at 8:30am ET
-
Other key data:
-
Philly Fed Index – 8:30am ET
-
Existing Home Sales – 10:00am ET
-
-
Fed outlook:
-
October meeting minutes showed mixed views on inflation vs. labor risk
-
FedWatch: December rate cut odds down to 33.8%
-
Today’s Fed speakers:
-
Beth Hammack at 8:50am ET
-
Lisa Cook at 11:00am ET
-
Austan Goolsbee at 12:40pm ET
-
-
Market Technicals & Flow
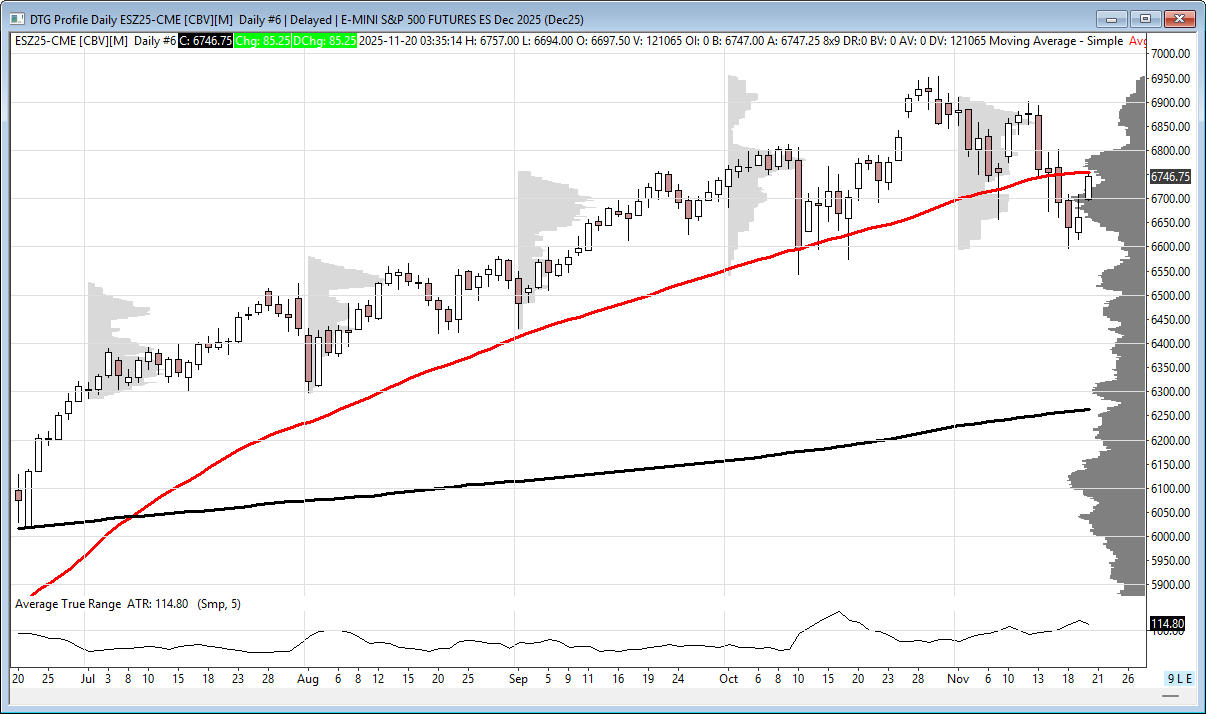
-
Volatility elevated: ES 5-day ADR at 125 points
-
Overnight:
-
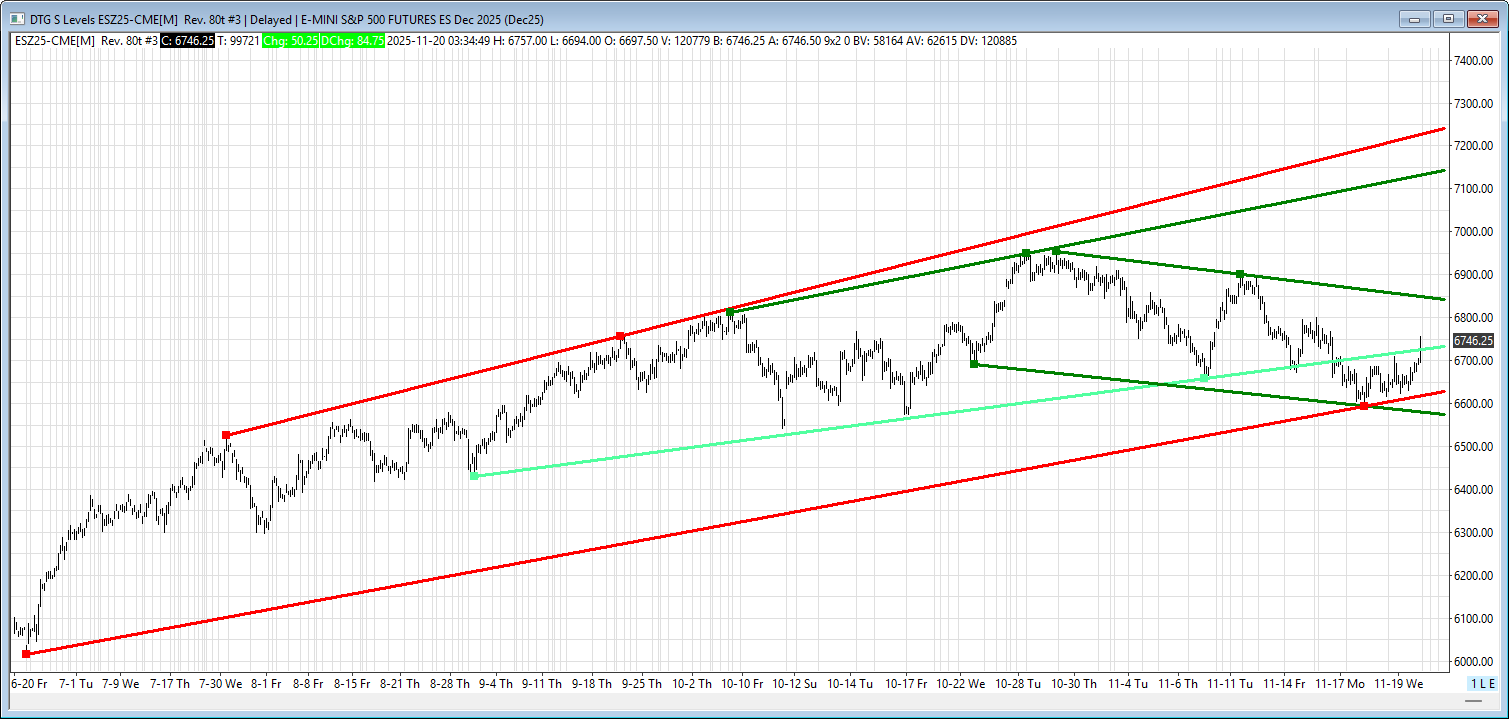
ES bounced back into its short-term uptrend channel
-
Met resistance at the 50-day MA (6755.25)
-
-
Trend bias:
-
Short-term: downtrend
-
Intermediate-term: uptrend
-
-
Key Levels:
-
Resistance: 6845/40s, 7143/48, 7245/50s
-
Support: 6623/28s, 6574/69s
-
-
Whale bias: Bullish lean on light overnight large trader volume
Earnings Watch
-
Premarket: NTES, WMT, J, VIPS, WMG
-
After Close: CPRT, INTU, ROST, VEEV
-
Friday AM: BJ
Affiliate Disclosure: This newsletter may contain affiliate links, which means we may earn a commission if you click through and make a purchase. This comes at no additional cost to you and helps us continue providing valuable content. We only recommend products or services we genuinely believe in. Thank you for your support!
Disclaimer: Charts and analysis are for discussion and education purposes only. I am not a financial advisor, do not give financial advice and am not recommending the buying or selling of any security.
Remember: Not all setups will trigger. Not all setups will be profitable. Not all setups should be taken. These are simply the setups that I have put together for years on my own and what I watch as part of my own “game plan” coming into each day. Good luck!
This post goes out as an email to our subscribers every day and is posted for free here around 2 PM ET. To get your real-time copy, sign up for the free or premium version here: Opening Print Subscribe.
Comments are closed