Can Stocks Stabilize After Yesterday’s Beating?
Nasdaq has worst day since Oct. 2022
Follow @MrTopStep on Twitter and please share if you find our work valuable!
Every week, MrTopStep invites traders to an “Own the Close” contest where the closest guesstimate where the SPX will settle on Friday’s 4:00 cash close.
The winners get a free week’s access to the MrTopStep Chat and trading tools. Enter your guess now!
Our View
If you’re surprised by the U-turn, I don’t think you should be. The new reality is that lower rates have prompted a shift out of the Nasdaq (tech) and into small caps. Just one company among the ‘Magnificent 7’ has a market cap larger than the entire Russell 2000 total market capitalization.
Clearly, big institutional accounts have been selling off the NASDAQ over the past two weeks, and the deluge of negative news served as yesterday’s catalyst for the drop. According to Dow Jones Market Data, the Magnificent Seven stocks collectively lost $768 billion in market value, marking the largest such wipeout on record since Meta Platforms went public as Facebook in 2012.
Our Lean
Jeez, the markets acted bad yesterday, but what do you expect after a ~44% rally in two years? If you have been reading the OP, you know a few things about what I have been writing. I think we are going higher, but I kept putting stats about how much the ES has rallied, trying to keep things in perspective.
The PitBull just told me he did his work and if the ES rallies up to 5550 he’s a seller and said according to his work, the ES can read down to 5300 to 5200. I, on the other hand, want to keep an eye on the 50% retracement from the 5551.75 high to the 5462.00 low. That’s an 89.75 point range, so ~5507.00 is the level I’m watching. Above there I have the 5512 level and above there I don’t see any resistance until the PitBull’s 5551.75 level that traded at 9:33 am.
I do not think we are going to 5200-5300. I think there is a good possibility we will bounce. I just don’t know how far. One of the MrTopStep rules is that the ES and NQ go sideways to higher after a big drop…we shall see.
My good friend Jeff Hirsch of the Stock Trader’s Almanac had this to say:
Looks like the mean reversion correction we have been expecting is upon us, but this should set up the next leg up and August is the #1 NASDAQ month in election years.
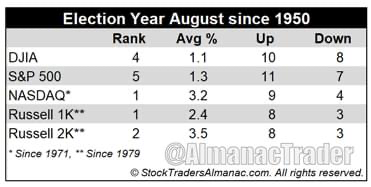
Agriculture made August a great stock market month in the first half of the Twentieth Century. It was the best DJIA month from 1901 to 1951. Now it is the worst DJIA and second worst S&P 500, NASDAQ, Russell 1000, and Russell 2000 month over the last 36 years, 1988-2023 with average performance ranging from 0.1% by NASDAQ to a -0.9% loss by DJIA. In 2022, DJIA, S&P 500, NASDAQ, and Russell 1000 all declined over 4% in August and in 2023 they declined 1.8% or more.
Contributing to this poor performance since 1988; the second shortest bear market in history (45 days) caused by turmoil in Russia, the Asian currency crisis and the Long-Term Capital Management hedge fund debacle ending August 31, 1998, with the DJIA shedding 6.4% that day. DJIA dropped 1344.22 points for the month, off 15.1%—which is the second worst monthly percentage DJIA loss since 1950. Saddam Hussein triggered a 10.0% slide in August 1990. The best DJIA gains occurred in 1982 (11.5%) and 1984 (9.8%) as bear markets ended. Sizeable losses in 2010, 2011, 2013, 2015 and 2022 of over 4% by DJIA have widened its August average decline.
However, in election years since 1950, Augusts’ rankings improve: #4 DJIA, #5 S&P 500, #1 NASDAQ (since 1971), #1 Russell 1000 and #2 Russell 2000 (since 1979). Average election year performance ranges from a modest 1.1% by DJIA to a solid 3.5% from Russell 2000. The last election year with sizable across the board August losses was 1992. In 2004 and 2016, August was mixed. Some of these historical August gains may have been pulled forward already this year.
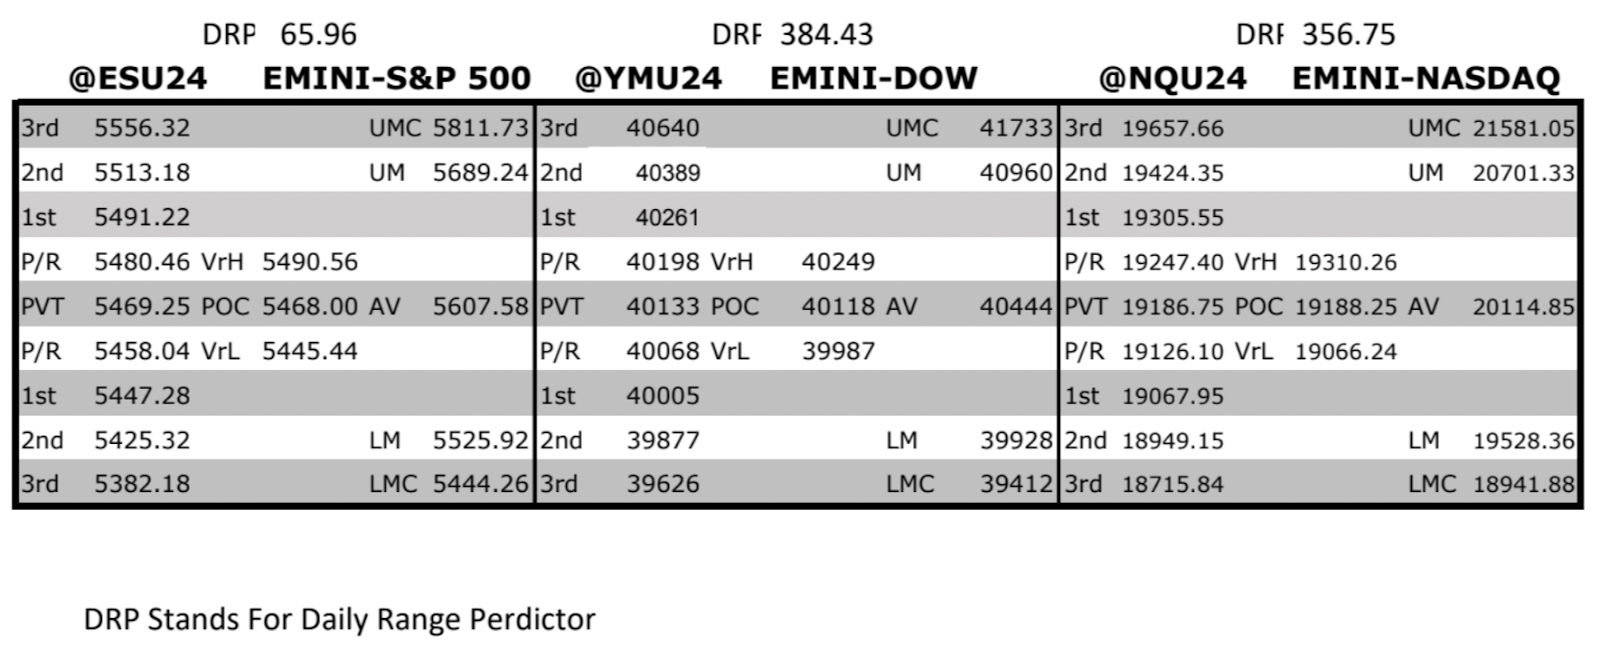
MrTopStep Levels:
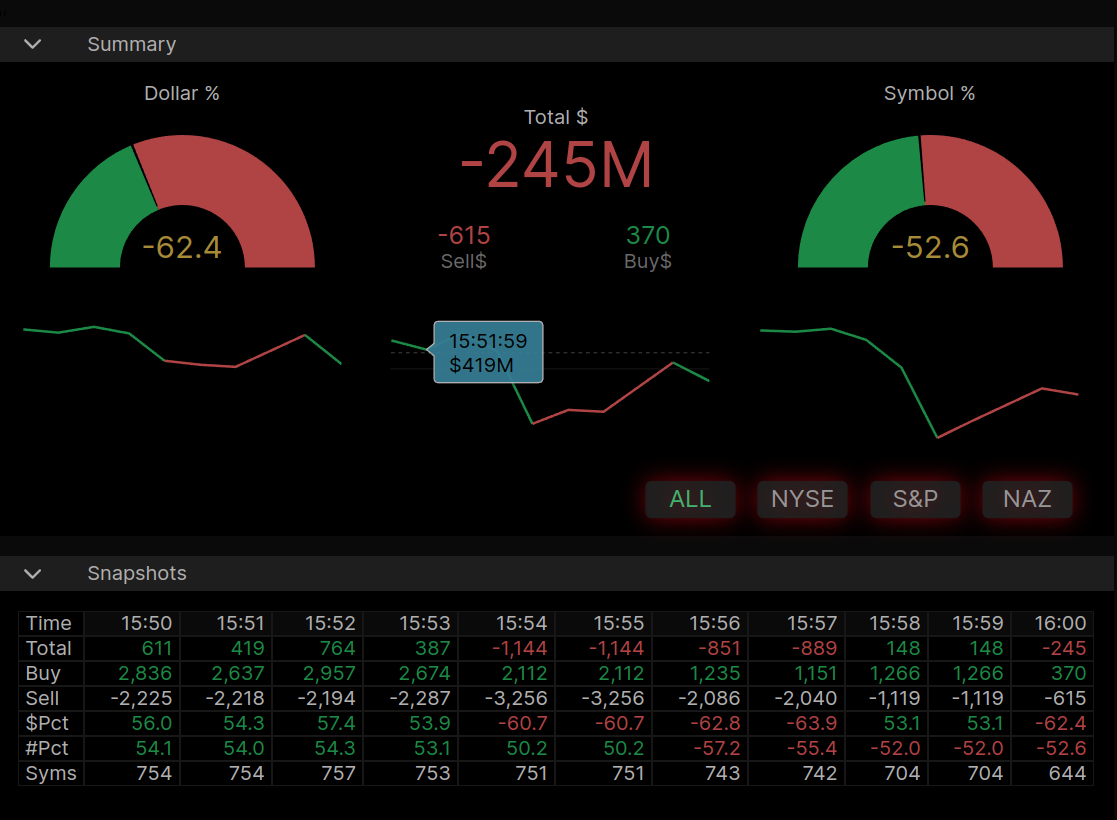
MiM and Daily Recap
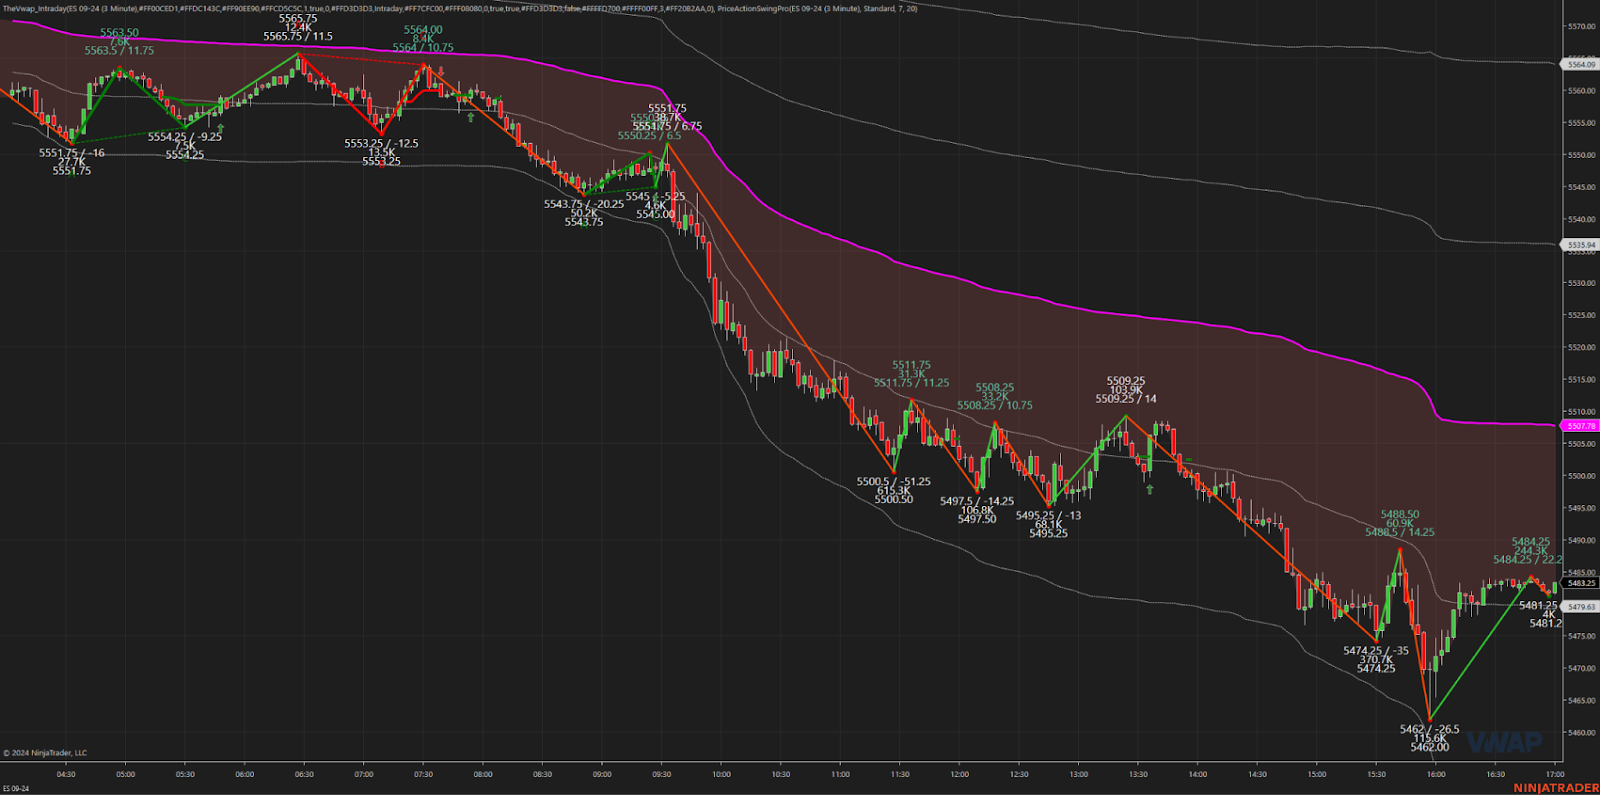
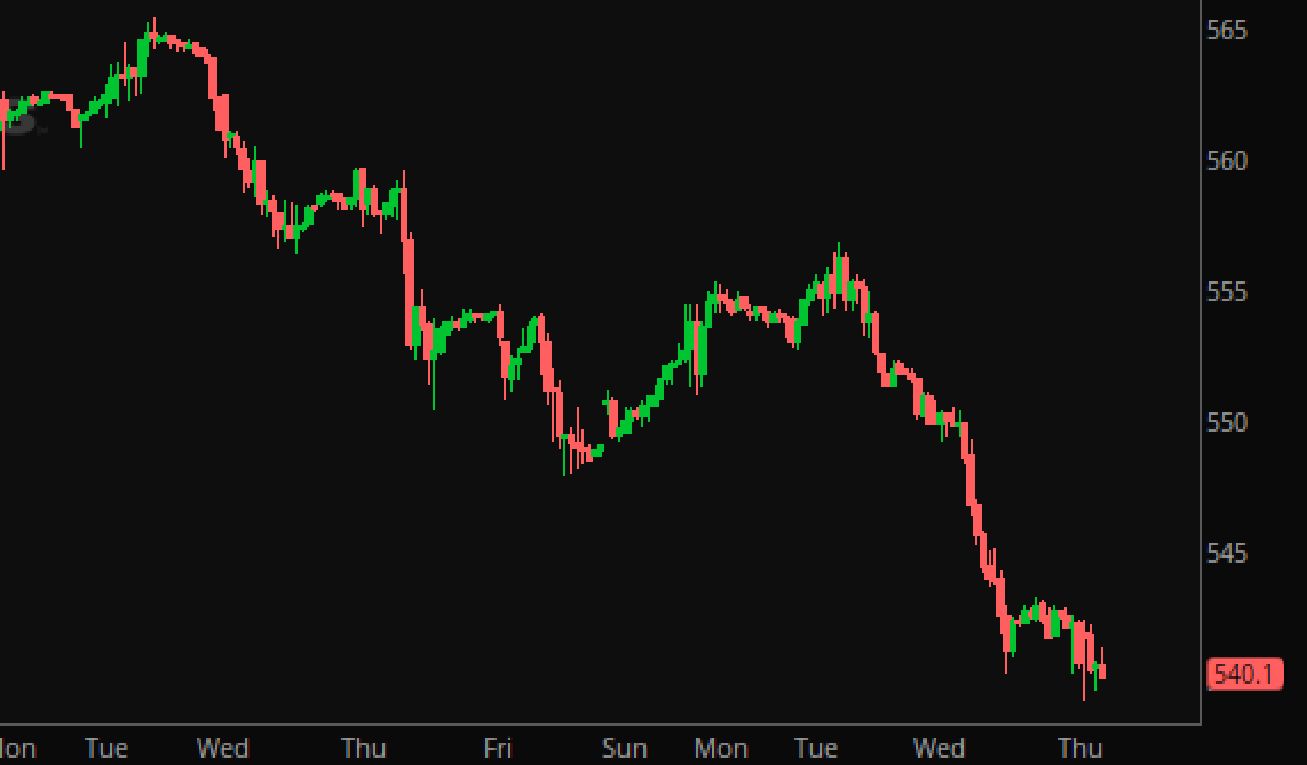
ES Recap
The US market took a hit overnight as Deutsche Bank reported a global sales slowdown. The ES sold off to 5543.75 and opened Wednesday’s regular session at 5548.50, down about 50 points on the day. After the open, the ES traded 5546.75, rallied to 5551.75, but then began to decline as the NQ accelerated lower, reaching 5513.25 at 10:18. It then bounced to 5521.50 at 10:32, before dropping to a new low at 5511.50, and later rallying to another lower high at 5518.00. The ES then fell to a new low at 5500.50 by 11:26, rallied to 5511.75 at 11:34, and subsequently dropped to 5497.50 at 12:08. Another rally brought it to 5508.25 by 12:18, followed by another low at 5499.25 at 12:44. It then rallied to 5509.25 at 1:22, before dropping to a higher low at 4499.50 and briefly popping up, only to fall to 5476.50 at 2:54.
After this low, the ES traded up to 5485.00 at 3:03, before slowly pulling back to a new low at 5474.25 by 3:33. It then traded up to 5488.50 at 3:42, then sold off to 5476 and traded 5579.00 as the 3:50 cash imbalance showed $700 million to buy. Subsequently, it dropped to a new low at 5462.00 by 3:55 and closed at 5472.25 at the 4:00 cash close. After 4:00, the ES rallied to 5484.25 and settled at 5483.25, down 119 points or -2.12%. The NQ settled at 19,269.50, down 680.75 points or -3.4%. Yields on the 10-year note held roughly steady at 4.285%, and the VIX rose to its highest level since April. Oil prices ticked upward by 0.8%, closing at $77.59, while copper fell for its eighth consecutive session.
In the end, it was just a matter of time. In terms of the ES and NQ’s overall tone the only word to describe is horrible. Every up-tick was sold without prejudice. In terms of the ES’s overall trade, volume was high at 2.053 million contracts traded.
The ES drop was the worst since December 2022, the NQ drop was the worst decline since October 2022 when Federal Reserve officials were cranking up interest rates to tamp down inflation.
Technical Edge
-
NYSE Breadth: 22% Upside Volume
-
Nasdaq Breadth: 43% Upside Volume
-
Advance/Decline: 17% Advance (!)
-
VIX: ~18.50
-
+22.5% yesterday and highest since April
-
Guest Post — Dan at GTC Traders
Aggregation of Marginal Gains During Losses …
Last week we eyed up a simple options strategy. While tech stocks had only begun to move lower, the Russell had rallied …
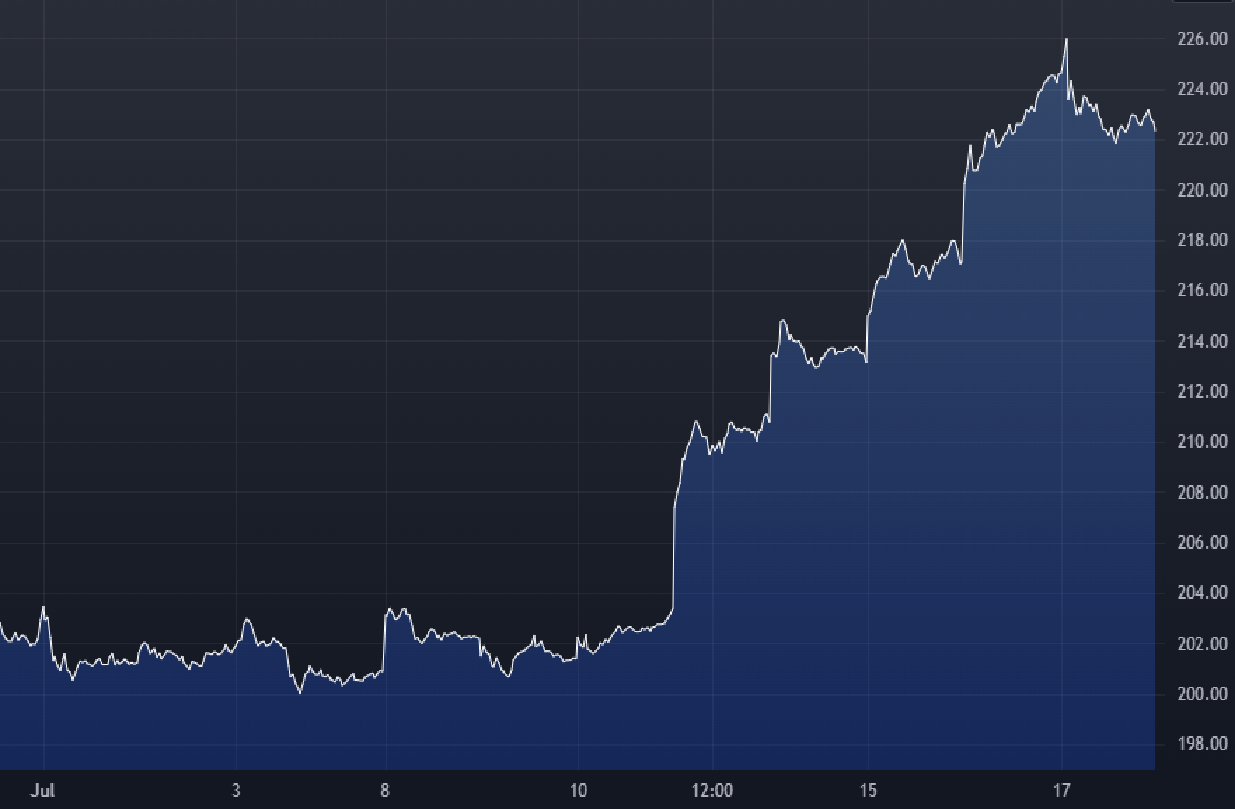
iShares Russell 2000 ETF – 10 Minute Chart Last Week
And we waited until we broke below the Weekly Central Pivot (Solid Pink line) and the Weekly VWAP (Dotted Blue Line) …
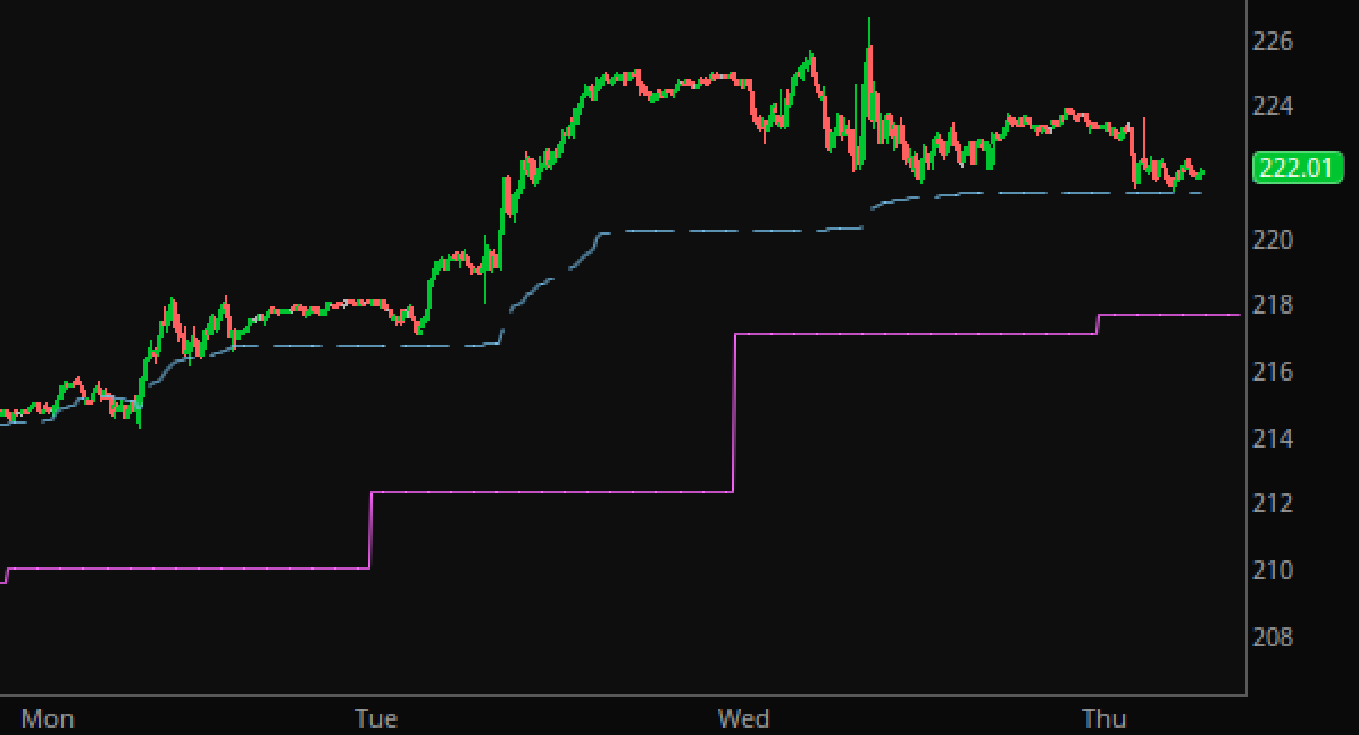
IWM – 10 Minute Chart Last Week
This came to pass ….
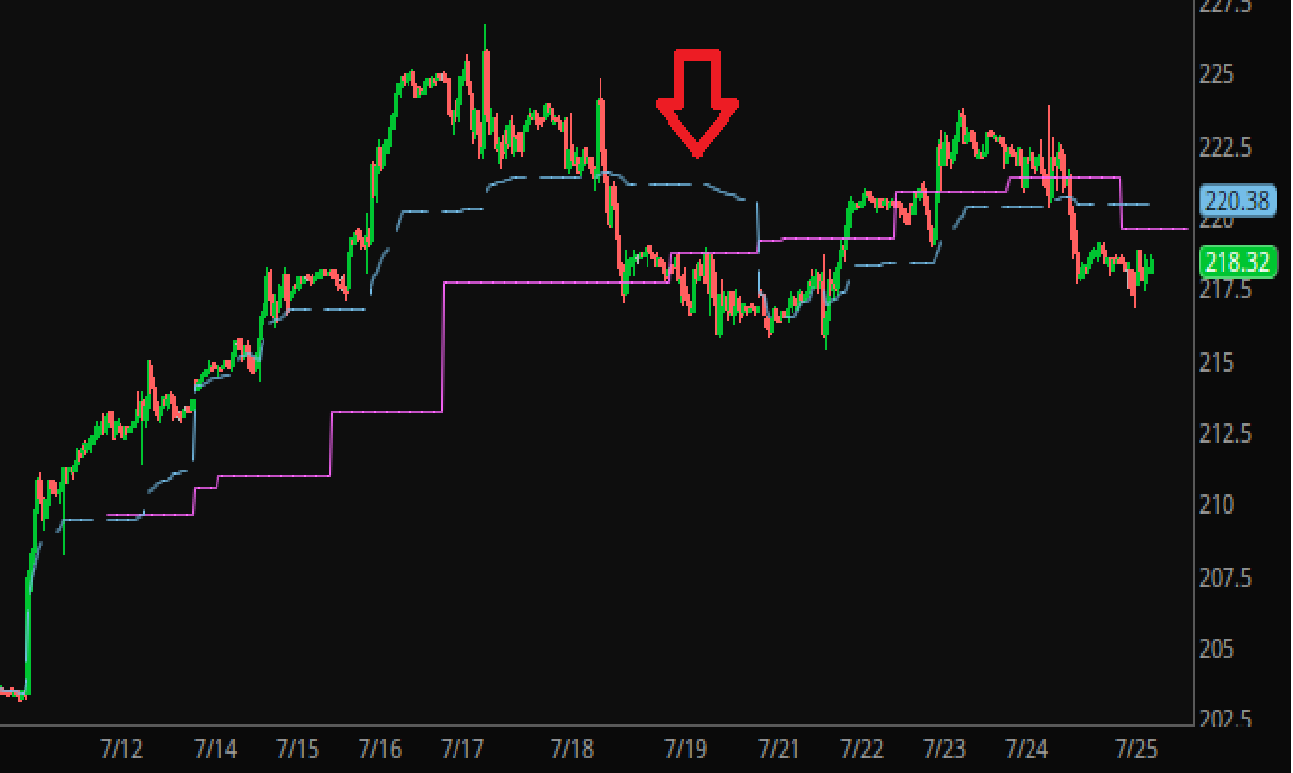
IWM – 10 Minute Chart
This was enough of a signal that the momentum of the up trend had been broken, that we sold spreads. We actually sold spreads for a bit more credit than we had discussed. We had discussed selling the August 23, IWM 245 Calls, and buying the 255 Calls, could bring in 0.54 per option spread sold. We actually sold the August 23 IWM 240 / 250 Call spread for 0.68 per option spread sold.
Why sell such distant spreads? Why not come in a little closer to the money, and make more profit?
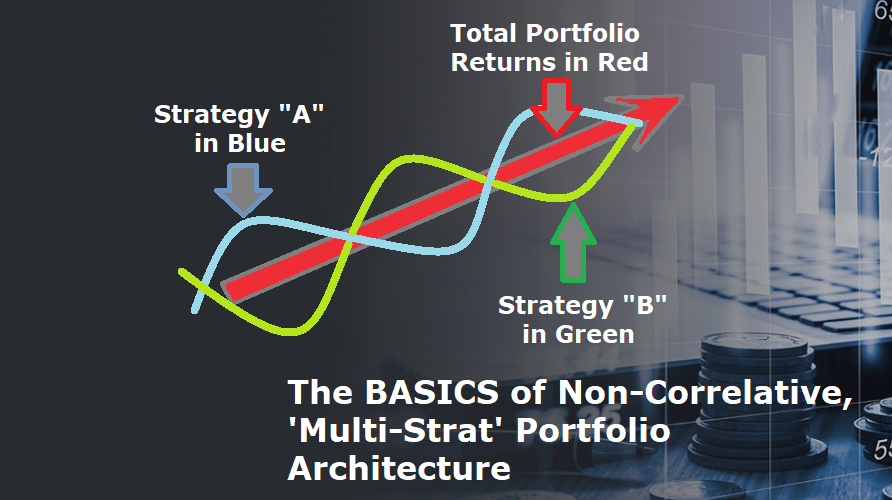
Our thought has been to make these trades higher probability. There is a Quantitative Concept known as the “Aggregation of Marginal Gains”. In other words, small gains, add up. And we run that, as a separate strategy.
And, as we have stated before, we run a Multi-Strat book. Or, a Non-Correlated (as to strategy thesis, not as to ‘diversified holdings) Multiple-Strategy portfolio …
So while we are making marginal gains with such option trades? And that option trade at the moment still looks fine in regards it’s deltas (we did put that trade on in our own portfolios) …
We run another strategy that we refer to as a “Math Advantaged” strategy, or program.
And as all traders know?
Sometimes you just don’t get the cards. We tried to play a small bounce in risk a few days ago in the SPY, and it just didn’t work out …
SPY – 1 Hour Chart
That’s trading.
Real trading. In fact, we’ve had three losses now, in a row, in our ‘math advantaged program’. They’re not all going to be winners. Especially on a ‘math advantaged’ program. Every real trader knows this. Many newer traders do not understand that many professional firms that are wildly profitable may run only a 40% accuracy rate, on a “math advantaged” program.
But, while we had a few losses in our math advantaged program? These have all been lessened by our higher probability option trades. All of which are profitable this month; in addition to the Treasury Bills we hold.
No strategy is perfect. There are going to be losses in trading. But running a Non-Correlated Strategy Thesis? The aggregation of those marginal gains in a higher probability program? Means that that our drawdown is lessened, and thus, our performance is improved. While we undergo a bit of drawdown in another program. And this month has been a perfect example of this truth.
Stay safe, and trade well …
For more about GTC Traders, please visit them here.
Economic Calendar
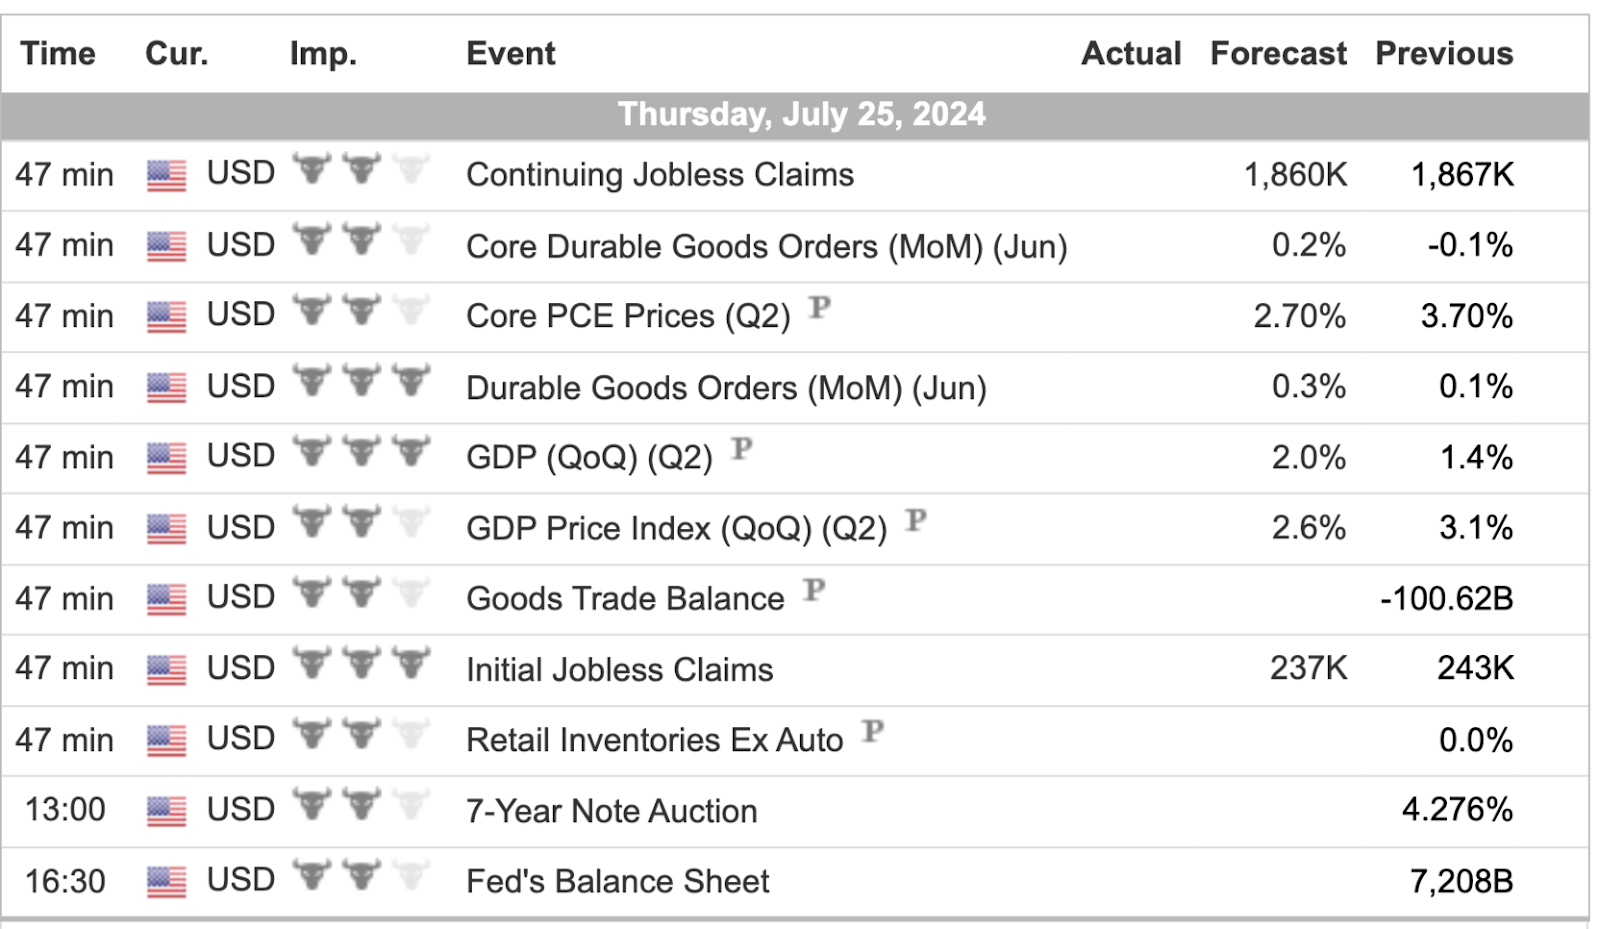
For a more complete Economic Calendar see: https://mrtopstep.com/economic-calendar/
Comments are closed