This post goes out as an email to our subscribers every day and is posted for free here around 2 PM ET. To get your real-time copy, sign up for the free or premium version here: Opening Print Subscribe.
Chop City: Rally, Dump, Repeat
Follow @MrTopStep on Twitter and please share if you find our work valuable!
Our View
One of the patterns that has been sticking out over the last five sessions is when the ES gaps higher, it sells off quickly and then moves back up. I just hung up with the PitBull , he sold out his stock into the early highs and said he was going to be gone for three hours. I told him not to worry, that he’s not going to miss anything, that it’s going to be like this for a long time. His response: “I know.”
I have been saying we live in an ever-changing environment forever, most of which was directed at the markets and electronic trading — i.e., the algos and HFT — but it’s not just the S&P and Nasdaq that are changing. Yields have risen significantly, and several well-known economists and heads of big hedge funds have been warning about the treasuries and their sustainability.
Last night, I came across a story I wrote about a few weeks ago: what if China started unloading their US notes and bonds? Look at gold — it’s at $3,300 — what’s it going to, $3,500? It sure looks that way. Everything is evolving or shifting, and most of it is not in favor of the US or its economy.
So the question is: how sustainable is the current stock market rally? Is it just another dead cat bounce? Will the ES and NQ make new lows, or do they trade in a big trading range until some major events take place?
The dollar just sold off down to 0.8766, down 0.57%, after this headline hit:
China Foreign Ministry says no calls between Trump-Xi: “As far as I know, there have not been any calls between the two presidents recently. Let me make it clear one more time that China and the U.S. are not engaged in any consultation or negotiation on tariffs.”
The headlines have been both good and bad for the markets. After making a 5492.00 low, the ES rallied all the way up to 5578.75 as the NYSE imbalance showed $3.3 billion to buy, and then sold off down to the 5545 area after 4:00. Like I said earlier, it was going to be a two-way street — and it was.
After yesterday’s oversized OP, I’m going to cut back a bit today.
Our Lean
Today has four economic reports, no Fed speak, and T+1. It looks like the end-of-the-month rotation is buying stocks, but we still have two more trading days. If today is anything like yesterday, we could easily see ES 5600. After the sell-off and weakness in some of the big tech stocks like NVDA, I think the late push was tied to the end-of-the-month rebalance.
Our lean is the same as yesterday: if the ES gaps higher, I may look to sell it, but ideally, I am still looking for higher prices and looking to buy the big drops, which I did yesterday.
It seems the pattern of the day is, like I said, rally early, sell off, and then make new highs. ES volume was only 1.135 million; if today is like yesterday, I suspect we will see the same type of price action.
MiM and Daily Recap
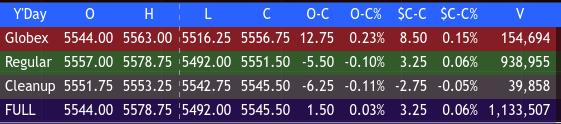
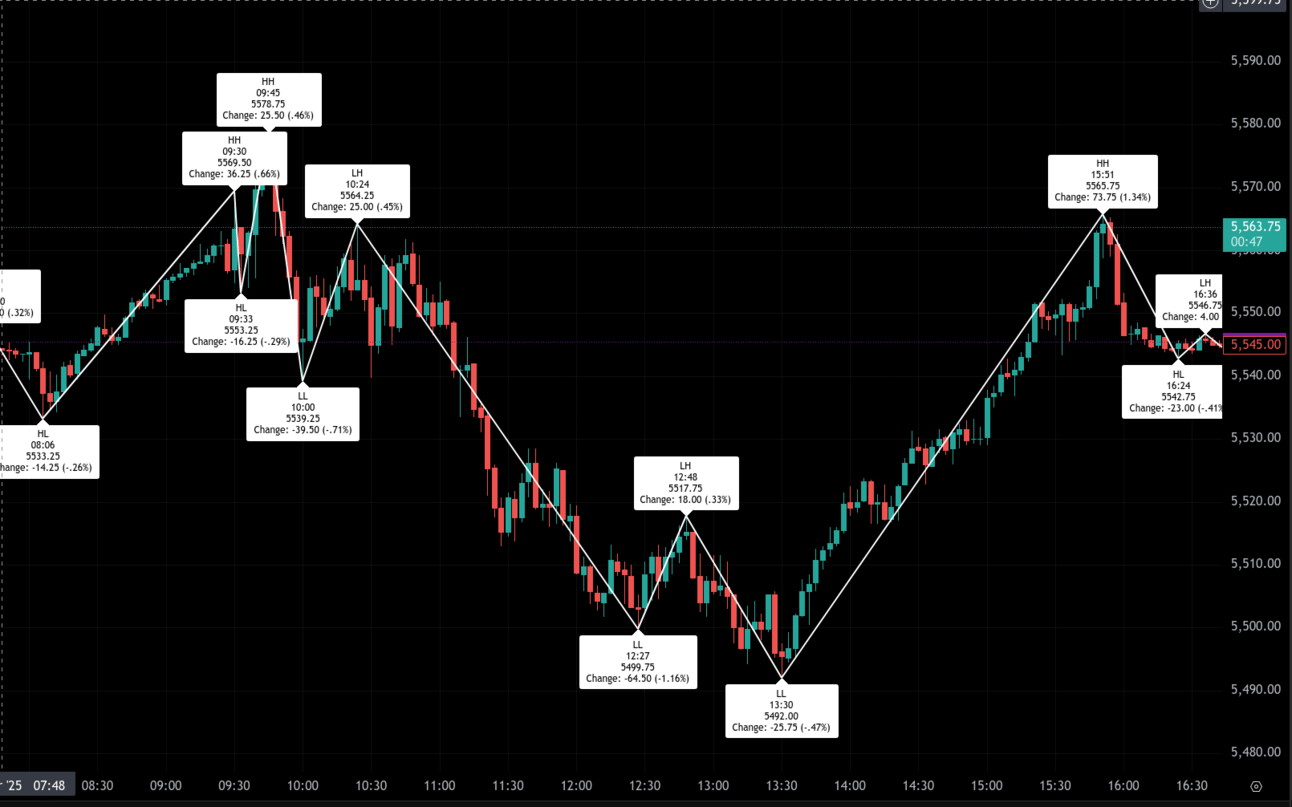
The S&P 500 futures opened the week with upward momentum out of the overnight Globex session, starting at 5544.00 and reaching a high of 5563.00. Globex buyers pushed ES up 12.75 points to settle the session at 5556.75. The regular session, however, opened higher at 5557.00 but saw immediate weakness. After a 9:30 AM candle high of 5569.50, the market briefly pulled back to 5553.25 at 9:33 AM before reversing back down. Sellers accelerated pressure, driving ES to a low of 5539.25 by 10:00 AM.
A modest bounce to 5564.25 at 10:24 AM (+25.00 points from the low) gave way to further downside into midday. A sharp decline into 12:27 PM brought ES to 5499.75, marking a 78-point drop from the morning high of 5578.50. The market staged a recovery into early afternoon, with a lower high at 5517.75 by 12:48 PM, but then fell again to 5492.00 at 1:30 PM, establishing a marginal new low.
The real momentum shift came shortly after, with ES rallying through the afternoon in a strong bid. A major leg higher extended from the 5492.00 low to a late-session peak of 5565.75 at 3:51 PM—a 73.75-point rally (+1.34%). The final hour saw some retracement, with a dip to 5542.75 at 4:24 PM and a bounce to 5546.75 at 4:36 PM. The regular session closed at 5551.50, down 5.50 points on the day, a -0.10% decline from the prior cash close. Including the Cleanup session, ES finished at 5545.50.
From a session-change perspective, the Globex session contributed +12.75 points, while Cleanup shed -6.25 points. The full session posted a modest net gain of +1.50 points, or +0.03%, showing how strong afternoon buying helped erase earlier losses.
Despite early session weakness and multiple lower lows into midday, buyers eventually regained control, turning the tone more constructive into the close. Volume was healthy, with 938,955 contracts traded during the regular session and a combined total of 1,133,507 for the day, suggesting sustained interest and participation across the board.
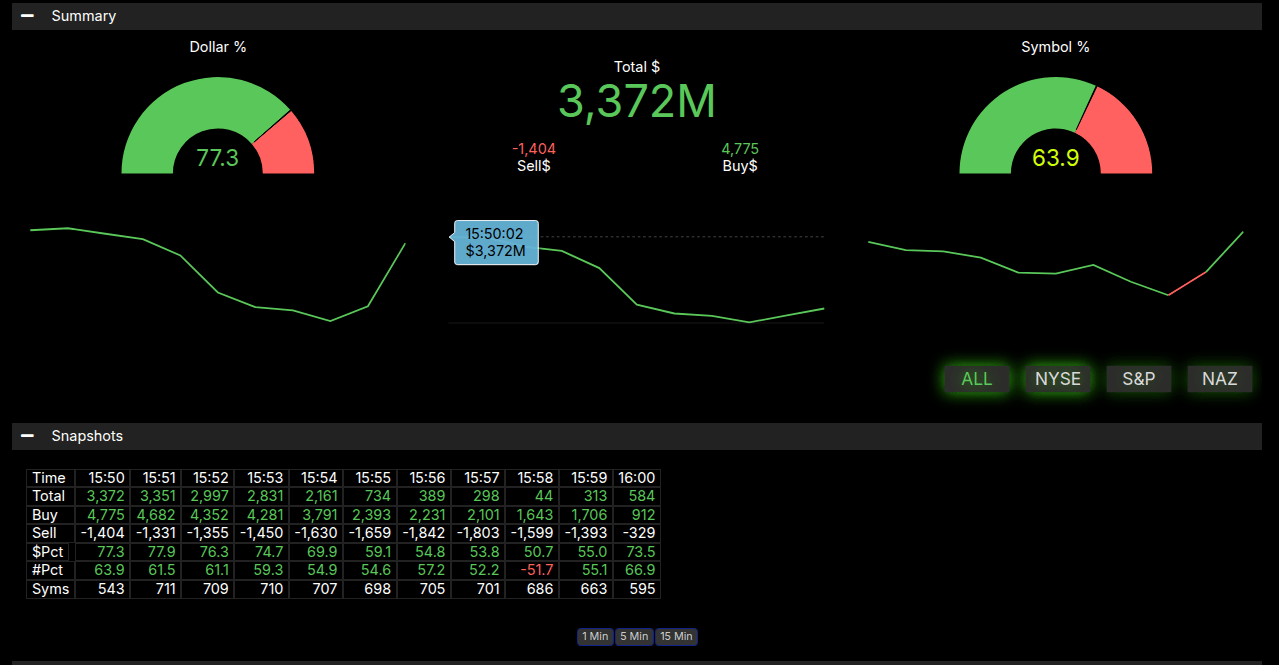
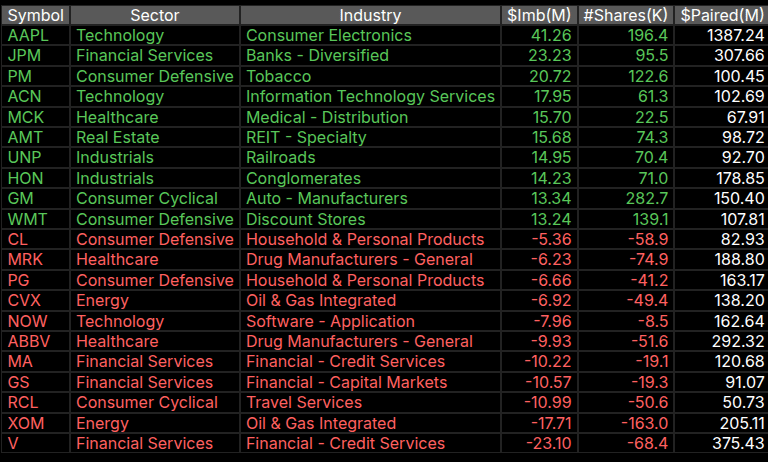
The Market-on-Close (MOC) imbalance data registered $3.372B to buy at 3:50 PM, with a 77.3% dollar-weighted imbalance to the buy side and 63.9% of symbols favoring buyers—just shy of the 66% threshold for a strong buy signal. Nonetheless, the sizable imbalance aligned with the afternoon rally and likely helped anchor prices near the upper end of the range.
Overall, Monday’s session ended on a neutral-to-slightly bullish note. The sharp reversal from the 1:30 PM low to the 3:51 PM high demonstrated resilient dip-buying interest, setting the stage for potential follow-through into Tuesday if afternoon strength carries forward.
Technical Edge
MrTopStep Levels:
Fair Values for April 29, 2025:
-
SP: 24.32
-
NQ: 100.71
-
Dow: 132.93
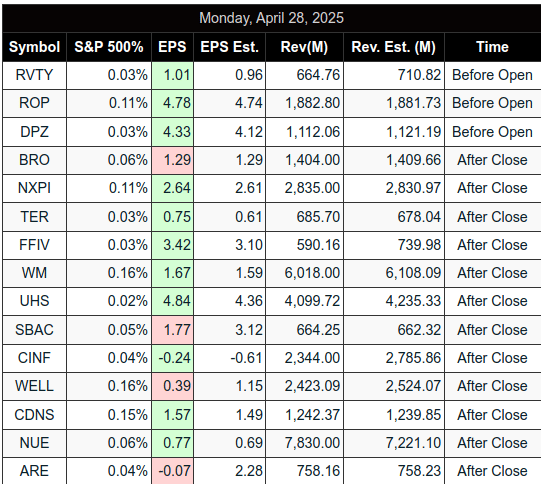
Daily Market Recap 📊
-
For Monday, April 28, 2025
-
NYSE Breadth: 70% Upside Volume
-
Nasdaq Breadth: 77% Upside Volume
-
Total Breadth: 74% Upside Volume
-
NYSE Advance/Decline: 63% Advance
-
Nasdaq Advance/Decline: 54% Advance
-
Total Advance/Decline: 59% Advance
-
NYSE New Highs/New Lows: 26 / 14
-
Nasdaq New Highs/New Lows: 94 / 63
-
NYSE TRIN: 0.65
-
Nasdaq TRIN: 0.37
-
Weekly Breadth Data 📈
-
Week ending Friday, April 25, 2025
-
NYSE Breadth: 63% Upside Volume
-
Nasdaq Breadth: 68% Upside Volume
-
Total Breadth: 66% Upside Volume
-
NYSE Advance/Decline: 80% Advance
-
Nasdaq Advance/Decline: 79% Advance
-
Total Advance/Decline: 79% Advance
-
NYSE New Highs/New Lows: 65 / 128
-
Nasdaq New Highs/New Lows: 162 / 313
-
NYSE TRIN: 0.52
-
Nasdaq TRIN: 0.57
-
Trading Room Summaries
Polaris Trading Group Summary – Monday, April 28, 2025
Overview of the Day:
-
The session began with bearish overnight action, trading down into the 5525–5515 target zone outlined in the Daily Trade Strategy (DTS).
-
Cycle Day 2 (CD2) behavior was expected: a bullish lean after the prior day’s decline, favoring a back-and-fill trading range.
-
Key level (“Line in the Sand”) was 5550 — price movement above or below this pivot provided trade direction.
Positive Trades and Progress:
-
Early Long Bias: PTGDavid noted an early long lean when price traded above VWAP.
-
Crude Oil (CL) Trade: An Open Range Long Target 1 was filled early, signaling good execution on oil setups.
-
ES Futures:
-
Initial bull target at 5575 was achieved, reinforcing the morning’s bullish strategy.
-
After a midday break of 5550, long bias was halted, transitioning to two-way cycle rhythms.
-
-
Afternoon Recovery:
-
Bulls successfully reclaimed 5515, followed by a steady rally back towards 5541 and beyond.
-
The closing rotation was strong, with a BOOM move back above 5550, in alignment with the dominant bullish force.
-
A massive MOC Buy Imbalance of $3.5 billion confirmed the late-day bullish push.
-
-
Lesson Emphasized: Stay ALIGNED with the DOMINANT FORCE at all times — critical for staying in sync with institutional players (“The Big Boyz”).
Key Lessons and Reinforcements:
-
Primary Directive: Always stay in alignment with price — no guessing.
-
TRIPLE A (AAA) Process:
-
Alignment with dominant force,
-
Assignment of trade plan,
-
Attack on the right setups.
(Full AAA explanation shared here: PTG Glossary Link)
-
-
V-shaped Recovery: Price action formed a classic V Victory pattern, showcasing the textbook CD2 behavior David highlighted.
Community Interaction:
-
Positive and engaged discussions on trading strategies, chart tools (DMI indicators), screen setups, and thank-you notes to David for his guidance.
-
Some humor and camaraderie during the midday grind kept the atmosphere upbeat.
Final Thought from David:
“Those who align with price action walk alongside the Big Boys. Those who guess… get left behind.”
Discovery Trading Group Room Preview – Tuesday, April 29, 2025
-
Morning Market Summary
Markets remain focused on trade tensions despite being in the heart of Q1 earnings season. Overnight, stocks found some support after a White House official indicated a reprieve for imported automobiles from steel and aluminum tariffs. Treasury Secretary Bessent noted that the US has shifted its focus from China to negotiating with 15–17 other nations. However, China pushed back, demanding that the US end its “wrongdoing” on tariffs, causing oil prices to dip while Treasury yields and the dollar edged higher; gold fell 1.2%.
The Wall Street Journal reported that the administration plans to ease tariff impacts on US automakers by reducing duties on certain foreign parts, a move confirmed by the White House.
Port of Los Angeles activity is being closely watched as an economic indicator: declining volume could signal cooling US growth, higher inflation, and weaker consumer demand.
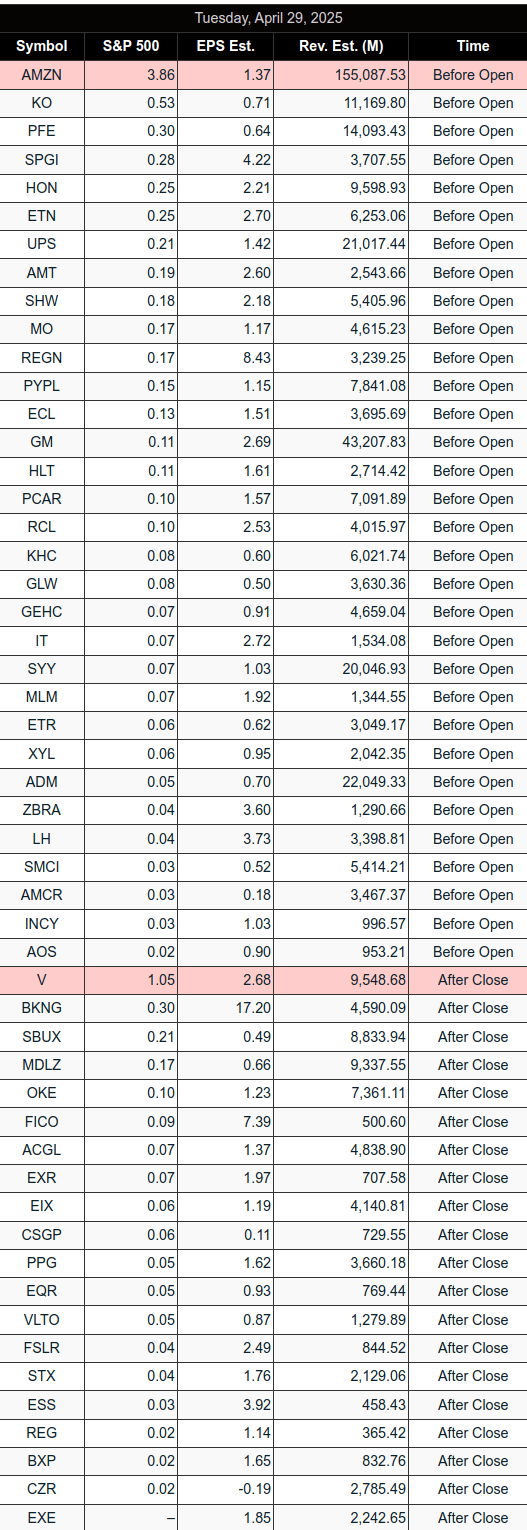
Earnings Highlights:
-
Premarket: MO, AMCR, AMT, AZN, BP, GM, PFE, PYPL, KO, UPS, among others.
-
After the bell: SBUX, SNAP, Visa (V), MDLZ, and others.
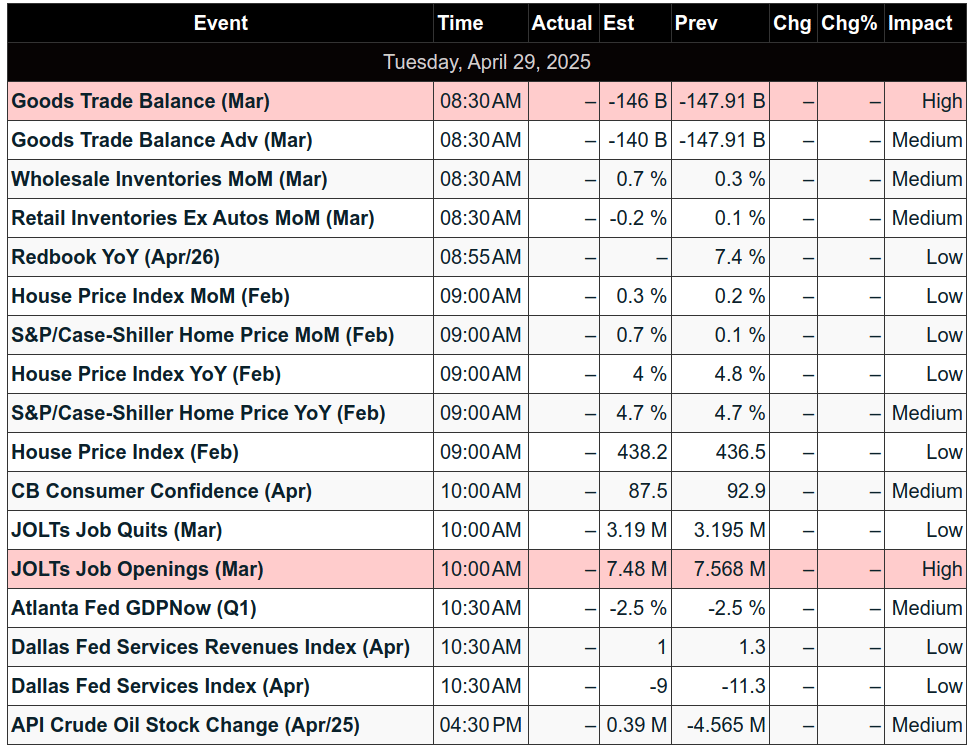
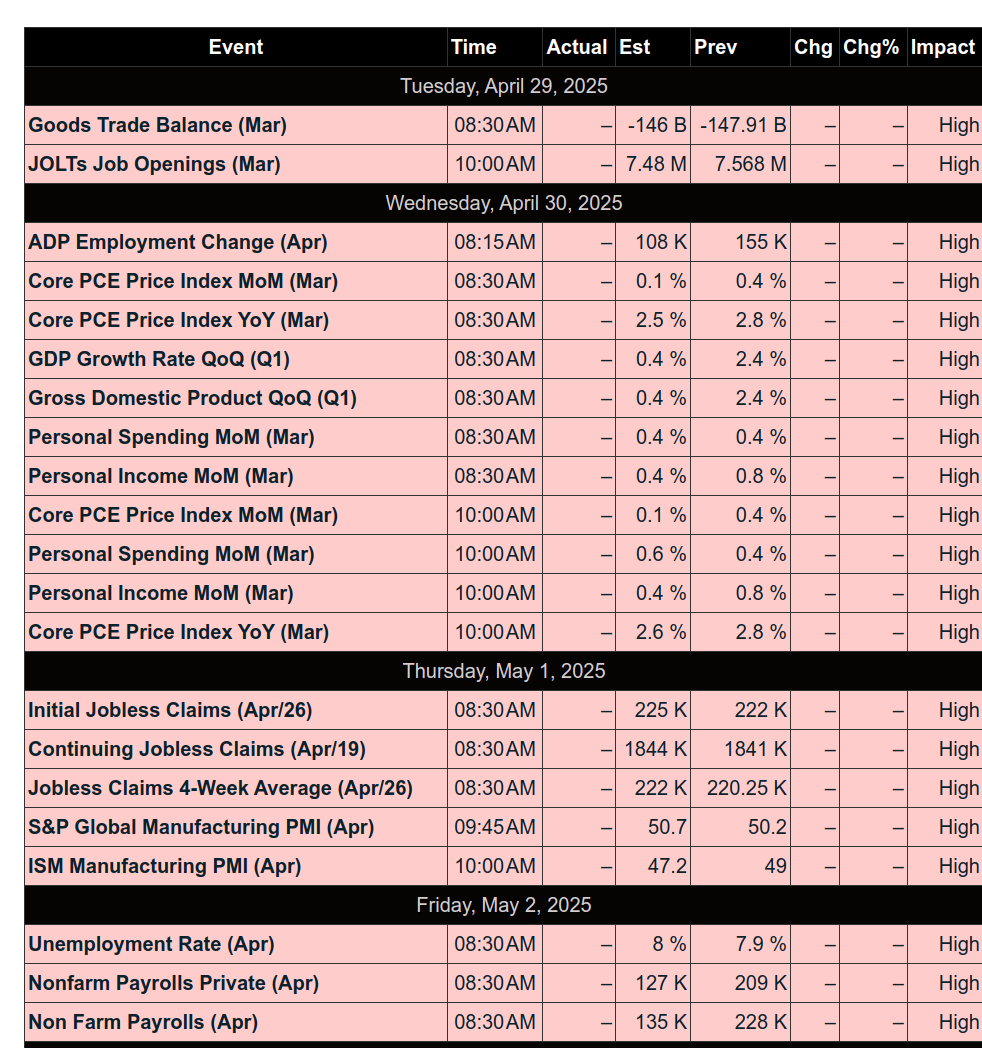
Key Economic Data Today:
-
Goods Trade Balance and Wholesale Inventories (8:30 AM ET)
-
S&P/Case-Shiller HPI (9:00 AM ET)
-
JOLTS Job Openings and CB Consumer Confidence (10:00 AM ET)
Market Technicals:
-
Volatility continues to contract with ES 5-day ADR at 141.5 points.
-
Whale bias is bullish into the US open on stronger overnight volume.
-
ES support levels: 5498/93s, 5456/51s, 5198/03s, 5110/05s, 4940/50s.
-
Resistance target: 5795/05s.
-
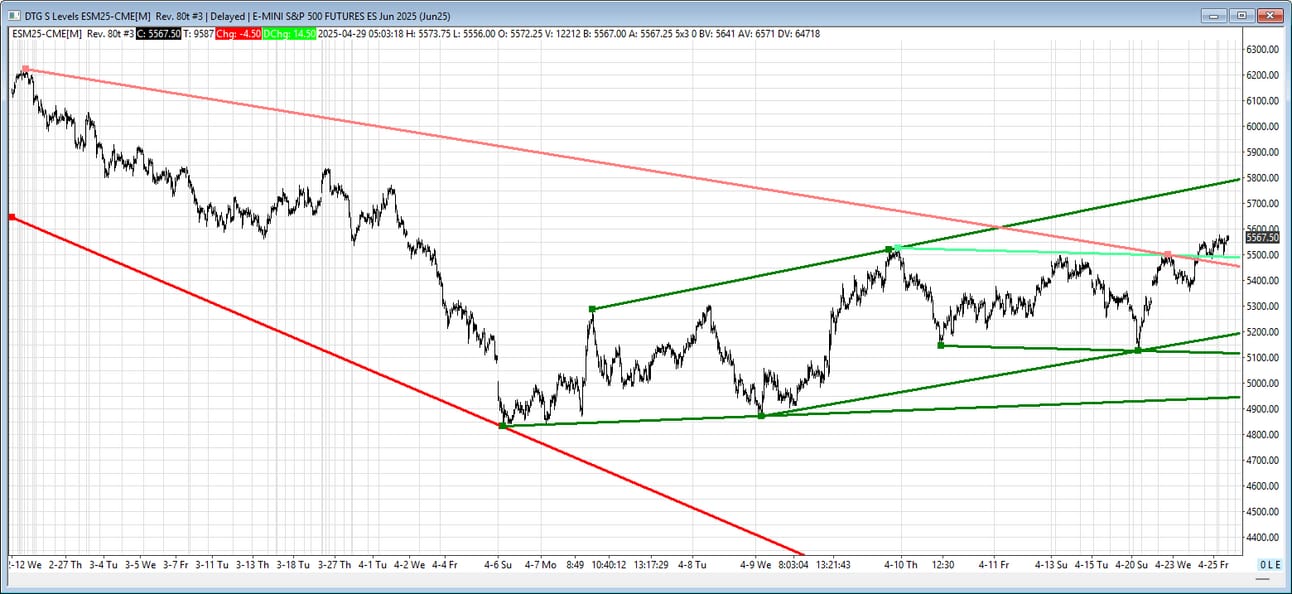
ES
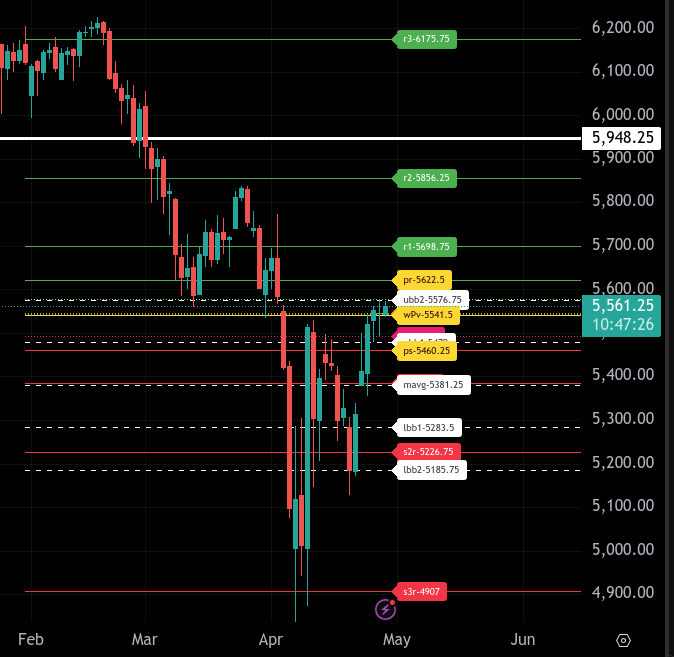
The bull/bear line for the ES is at 5541.50. This is the key pivot level for today. Price action is currently trading at 5562.25 during the Globex session, which places ES slightly above the bull/bear line, suggesting a bullish tone to start the day.
If ES holds above 5541.50, upward continuation could target 5576.75, which marks initial resistance. A break above this level sets the stage for a push toward 5622.50, today’s upper range target. Beyond that, the next resistance level is 5698.75, corresponding to the R1 level.
Should the market reverse and fall back below the bull/bear line, initial support sits at 5492.00 and 5479.00, followed by a lower range target of 5460.25. Breach of that could open the door toward 5381.25, where the 5-day moving average comes in, and then 5283.50 as the next downside support.
Overall, sentiment leans bullish above 5541.50, with the key test being if buyers can push through 5576.75 and sustain above it. Failure to hold 5541.50 flips bias back to neutral-to-bearish and shifts the focus toward testing lower support zones.
NQ – Week to Week
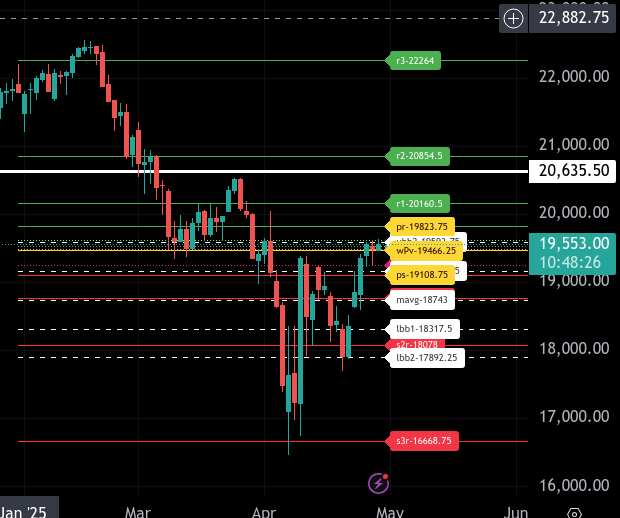
The bull/bear line for the NQ is at 19,466.25. This is the key pivot for determining directional bias today. Trading above this level favors buyers, while sustained action below it supports bearish continuation.
Currently, NQ is trading around 19,554.00, which places it firmly above the bull/bear line. As long as the price holds above 19,466.25, the path of least resistance remains to the upside. Initial resistance sits at 19,623.00. A breakout above that opens the door to the upper range target of 19,823.75. Beyond that, the next major resistance stands at 20,160.50.
If price reverses lower, first support comes in at 19,524.50, followed by the bull/bear line itself at 19,466.25. A breakdown below that would likely shift control back to sellers, with 19,257.25 offering intermediate support before the lower range target at 19,108.75. Below that, deeper downside support can be found at 18,757.25 and then 18,078.00.
Overall, NQ maintains a bullish posture while above 19,466.25, with upside momentum targeting 19,623.00 and 19,823.75. However, failure to hold the bull/bear line could quickly shift focus to the 19,200s and eventually sub-19,000 zones.
Calendars
Economic Calendar
Today
Important Upcoming
Earnings
Affiliate Disclosure: This newsletter may contain affiliate links, which means we may earn a commission if you click through and make a purchase. This comes at no additional cost to you and helps us continue providing valuable content. We only recommend products or services we genuinely believe in. Thank you for your support!
Disclaimer: Charts and analysis are for discussion and education purposes only. I am not a financial advisor, do not give financial advice and am not recommending the buying or selling of any security.
Remember: Not all setups will trigger. Not all setups will be profitable. Not all setups should be taken. These are simply the setups that I have put together for years on my own and what I watch as part of my own “game plan” coming into each day. Good luck!
This post goes out as an email to our subscribers every day and is posted for free here around 2 PM ET. To get your real-time copy, sign up for the free or premium version here: Opening Print Subscribe.
Comments are closed