Correction Continues As Recent Lows Are on Watch
News out of China adds weight to the selloff
Follow @MrTopStep on Twitter and please share if you find our work valuable.
Our View
Yesterday’s action was tricky. While yesterday’s Lean said to sell the 20 to 30-point rallies (and specifically, sell 4502 in the ES), the mood changed with the selloff on Globex.
That Globex dip should have had traders looking to buy the open and if they did, it was a good one. That said, sellers had their chance, too.
The ES rallied 32.50 points off the morning low and 29 points off the opening price, topping at 4501.50. It later hit intra-session highs of 4503.25 and 4502.25, with each high triggering a dip of 10 to 14 points.
That said, there’s a lesson in all of this. In this game you have to be willing to change your opinion quickly or lose in the process. Monday was a two-way tape where you could have been bullish from the open and bought the 10-15 point dips or you could have been bearish and sold the rallies above 4500.
I’m not going to do a big View today. The crowd is short and there are more stops to run on the upside. That said, let’s get more specific now.
I want to remind everyone, Rich Miller — AKA @HandleStats — gave us the S&P yearly and monthly study and will be doing a 30-minute webinar on Wednesday. I will MC the event and then turn it over to Rich. Here is the link to the study. I encourage all readers to jump on this free offer.
If interested in the webinar, please register for the Study on Year Highs and Lows by Month in the SPX on Aug 16, 2023 at 11:30 AM EDT here. (After registering, you will receive a confirmation email containing information about joining the webinar).
Our Lean
As you can tell from the timestamps below, I did some reflecting on the ES last night and posted the following:
-
IMPRO: Dboy :(9:51:14 PM) : 4519 BIG
-
IMPRO: Dboy :(9:51:27 PM) : maybe hard to just pop thru there
-
IMPRO: Dboy :(9:52:07 PM) : also, recently and 50 to 60 pnt rally has been sold
China is the No. 2 economy in the world and if it’s on the brink, the global economy is too. Yesterday we talked about how one of the largest Chinese firms is nearing collapse and the news flow out of that country is not reassuring.
Earlier this month, import and export data for China badly lagged economists’ expectations. Now, more data signals an issue. China Industrial Production grew 3.7% year over year, missing expectations of 4.3%. Further, China Retail Sales grew just 2.5% vs. expectations of 4.0%.
Similarly, Foxconn, “the world’s largest contract electronics maker downgraded its outlook for full-year revenue to a slight decline from a previous guidance of flat as it joins other companies grappling with a weak global economy and a sluggish recovery in China.”
And finally, in a pivot away from China (but still an issue) is this: “Fitch warns it may be forced to downgrade dozens of banks, including JPMorgan Chase.” The Russian ruble also continues to collapse against the dollar.
Our Lean: Coming into today, I was looking to buy the dip into the 4485 to 4490 area. But then the news out of China threw cold water on the markets and my approach is changing. An open below yesterday’s ES low at 4469 would be extremely bearishes.
It’s a “sell the rallies” type of day and our lean is to sell the ES if it gets up toward the ~4500 area (and remember our 4493 to 4503 zone).
MiM and Daily Recap

ES 10-min chart
The ES traded down to 4465 on Globex and opened Monday’s regular session at 4472.50. After the open, the ES sold off down to 4469.75, rallied up to the VWAP at 4489.25 at 10:26, pulled back to 4482.50 and then rallied up to 4501.50 at 10:56. Right after that rally, I put this in the MTS room:
-
IMPRO: Dboy :(10:56:44 AM) : this should be an area of resistance.
Then the ES dropped down to the 4491 level at 11:15, rallied back up to 4503.25, dropped down to 4489 and rallied up to a lower high at 4202.25 at 1:24. From there, it traded back down to the VWAP at 4488.25 at 2:32 and then back up to 4495.25. While I am doing my best to write about the ES, it’s actually been a very ugly, choppy trade from 2:00 to 3:30. The ES traded 4498.75 as the 3:50 cash imbalance showed $114 million to sell and traded 4506.75 on the 4:00 cash close. After 4:00, the ES rallied up to 4507.75 and settled at 4506.50 on the 5:00 futures close, up 22.5 points or 0.59% on the day.
In the end, the rule about looking for the PitBull’s Thursday/Friday low the week before the expiration proved reliable, as the NQ and ES posted nice gains on the day. In terms of the ES’s overall tone, it was firm but not as much as the NQ was (+1.16%). In terms of the ES’s overall trade, volume was steady with 248k ES contracts traded on Globex and 991K contracts on the day session for a grand total of 1.239 million contracts traded.
Technical Edge
-
NYSE Breadth: 41% Upside Volume
-
Advance/Decline: 40% Advance
-
VIX: ~$16
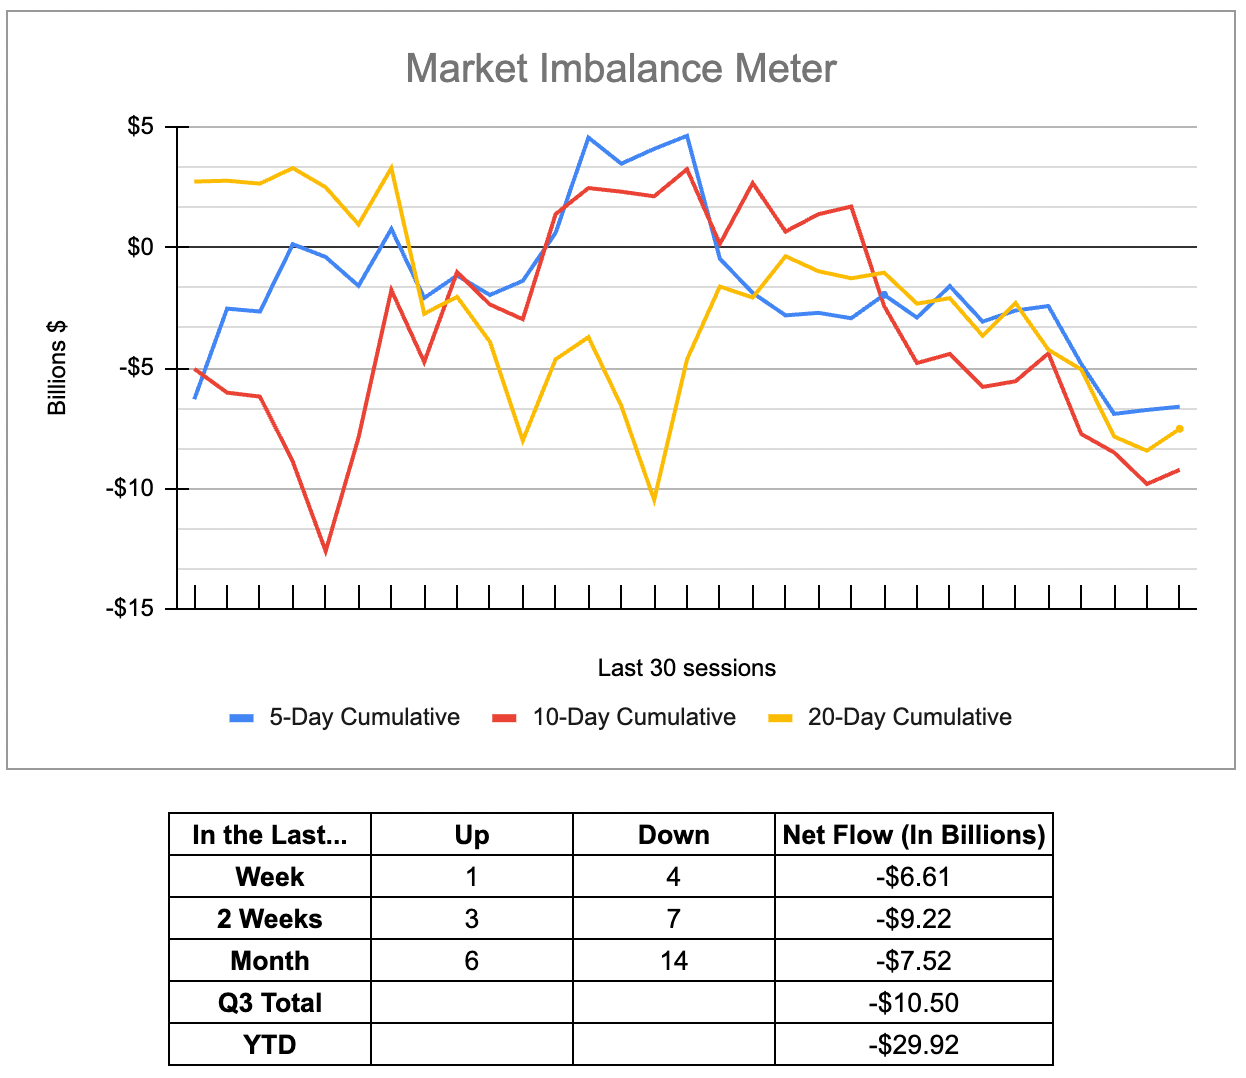
So far this month, volume on the up days has been considerably lighter than the down days. Now that’s not all that uncommon (given the emotional connection to losses vs. gains). It’s why this saying exists: “Take the escalator up and the elevator down.”
Down moves can create a wave of sell-stops, triggering market-sell orders. Especially when we decline in (effectively) 9 out of 10 days to start a new month.
Coming into Tuesday’s session under pressure (the S&P futures are down about 27 handles or 0.60% as of 7:00 a.m. ET) and today’s trade may be key in the short term.
Do bulls muster up some strength and reverse the early losses, regaining some of yesterday’s late-day traction? Or do they give up more ground to the sellers as the bears take control at short-term trend resistance and flirt with a break of the recent lows?
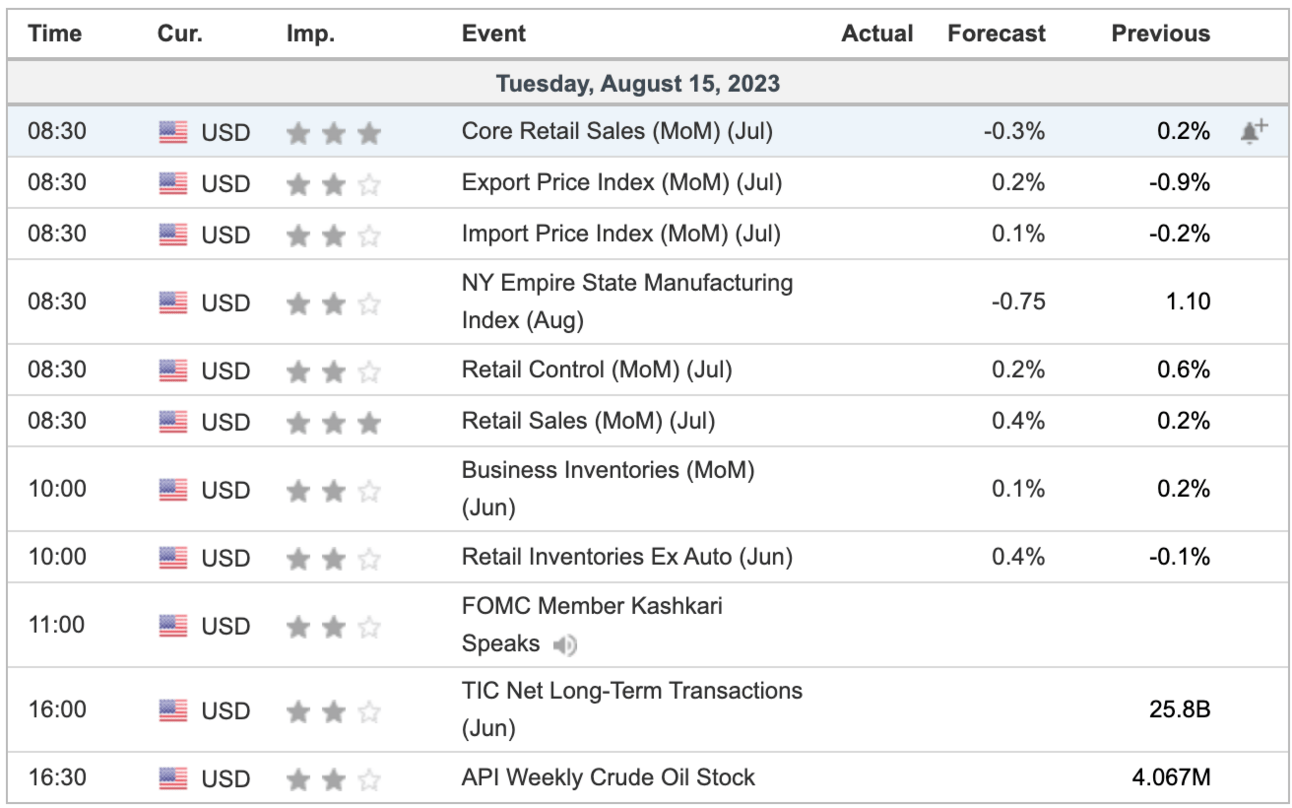
The retail sales number and retail earnings this week — with TGT, WMT, HD, etc. on deck — should give us a decent idea about the current state of the consumer.
One last thing: The dollar (DXY) rise and rally to YTD highs in yields (TNX) is an added headwind to the S&P. We need these obstacles to clear if we’re going to have a sustainable rally, IMO. And bulls will need the negative news out of China to stop, but that looks concerning too.
SPY
For now, it still looks and feels like a standard correction, although that late-day rip into the 10-day ema and subsequent pre-market pullback has to be frustrating for the longs.
Prepping for an open near the $445.50 area and active bulls will want to see this area hold. If it doesn’t, it could give us a run down to $443 to $444 area, which has been support.

SPY Daily
-
Upside Levels: $447.75 to $448, $451 to $451.50, $453
-
Downside Levels: $445.50, $443 to $444
SPX

SPX daily
-
Upside Levels: 4490-4500, 4527.50, 4540-45, 4567
-
Downside Levels: 4435-44 (wide range), 4400, 4385-88
S&P 500 — ES Futures
During Globex, we have a “look above” yesterday’s late-day high and a tag of the 10-day ema, only to be rejected and down over 30 handles. So now we have to see if the 4460-70 area can act as support…again.

ES Daily
-
Upside Levels: 4493-4503, 4512-15, 4540-42, 4550-60
-
Downside levels: ~4465, 4450-55, 4425
But — and there is always a but — the weekly chart shows a rather mild, digestive type pullback rather than a harrowing collapse. Things can change of course, but a weekly close like this may bode well for the bulls, especially if we can go weekly-up next week.

ES Weekly
NQ
That 15,300 area was a trouble spot and that’s no surprise. As noted yesterday, that was the convergence of the 50-day and 10-day moving averages and a recent support area.
Now the recent low in the low-15,000s could be key.

NQ Daily
-
Upside Levels: 15,300, 15,450-525
-
Downside levels: 15,000-30, 14,750-850 (admittedly a wide range)
QQQ
Great daily-up action yesterday over $368 to get the QQQ back into the $370s, but a gap-down this morning is going to trap a lot of bulls who are trying to swing a long here.
I don’t know if we’ll see the $364s today, but if we do, longs better hope it holds. Below $363 and it could set up an eventual move down to the $357s.

QQQ Daily
-
Upside Levels: $370.50, $372, $374.50
-
Downside levels: $363-64s, $360
Open Positions
Bold are the trades with recent updates.
Italics show means the trade is closed.
Any positions that get down to ¼ or less (AKA runners) are removed from the list below and left up to you to manage. My only suggestion would be break-even (B/E) or better stops.
** = previously mentioned trade setup we are stalking.
Down to Runners in GE, CAH, LLY, ABBV, AAPL, MCD & BRK.B. Now Add META, AVGO, UBER, CRM, AMZN, CVS, AMD, TLT and YM.
-
JPM — Many are long from $143-145. This is a longer term swing. Trimmed $153s, then $157.50+ on 7/24.
-
Down to ½ position vs. Break-even stop. Can make small, ~10% position trim if we see $160+
-
-
ARKK — Long from ~$46 — trimmed near/at $50. Still carrying ⅔ to ¾ of position. Trim at ~$52
-
Added back about ⅓ of our position around $45.50. Keep in mind, there could be room down to the 50-day moving average.
-
-
WMT — Went weekly-up over ~$156 — Trimmed above $157.55 and then $158. Down to ½ position with trim at $160+, trimmed the add portion above $159 (a high of $161.19 on 8/7). Down to ¼ or less here as we got $162.50 yesterday and earnings are on tap.
-
XOM — long from the monthly-up area at $108.50 — First ¼ or ⅓ trim is ~$112.50. Stops at $104.
-
**CRM — Would still love to see a dip down to the low-$200
Go-To Watchlist
Feel free to build your own trades off these relative strength leaders
Relative strength leaders →
(Lack of updates here but these names remain my top focus list!)
-
LLY, CAH
-
Energy stocks — VLO, SLB, EOG
-
AI stocks — NVDA, ADBE, SMCI
-
Mega cap tech — META, GOOGL, AMZN
-
Select retail — ELF, LULU, COST
-
Homebuilders ITB — TOL, KBH, DHI
-
BRK.B (new all-time highs)
-
CAT
-
Cruise stocks — RCL, CCL
-
DAL, DT, AMAT
Relative weakness leaders →
-
DIS
-
CF, MOS
-
PFE (all vaccine gains now gone)
-
EL, FL, DG
Economic Calendar
Disclaimer: Charts and analysis are for discussion and education purposes only. I am not a financial advisor, do not give financial advice and am not recommending the buying or selling of any security.
Remember: Not all setups will trigger. Not all setups will be profitable. Not all setups should be taken. These are simply the setups that I have put together for years on my own and what I watch as part of my own “game plan” coming into each day. Good luck!
Update your email preferences or unsubscribe here
© The Opening Print
228 Park Ave S, #29976, New York, New York 10003, United States
No responses yet