Our View
What started off as a strong beginning to the year has quickly turned into a fear-driven market. Rates soared on Monday but the market ignored these developments. Then bulls paid the price on Tuesday as the Nasdaq fell 200 points. On Wednesday, the index shed another 500 points.
There are two main negative forces at work here: Bonds/Rates and the Fed.
The first force was in action earlier this week and began pressuring the Nasdaq a few days ago. Even though the S&P was able to keep the Nasdaq’s losses from weighing it down, the pain in tech can only be tolerated for so long by the rest of the market.
This isn’t 1997 or 2003 where tech is a small portion of the market. We are now talking about the biggest names in the market — $11.5 trillion in combined market caps for FAANG, plus Microsoft, Tesla, and Nvidia.
The other force? The Fed.
On Wednesday, the Fed Minutes showed that the Fed is looking at a potentially more aggressive rate-hiking approach to 2022.

The longer-term outlook is a bit less clear, but the market is currently pricing in a 55% to 60% chance we see three to four rate hikes by the end of the year.
The ADP report was strong yesterday and if that means we have a strong labor report on Friday, it may only give the Fed more ammo to increase rates regardless of what that means for the stock market.
The labor market and inflation measures are the two key metrics to keep an eye on right now. If inflation cools off, perhaps the Fed will ease off the rate-hike mantra it’s on right now.
Throw in Warren Buffett’s favorite stock indicator flashing an overvalued market and some traders comparing the market to the Nikkei in 1989 and we suddenly have a lot of cautious traders in the first week of 2022.
Our Lean
With the sudden flip from bullish to bearish tones, we need to find our footing.
For the ES, it found its footing on the 50-day moving average in the overnight session. However, it is going to struggle as long as rates continue to push higher or stay elevated. That’s where we need to see some relief right now.
Right now, the Dow is holding up the best from its highs, so if there’s any index to go to in the short term, this may be it.
As for the ES, clearing 4704 could open the door to a 20 or 30 handle bounce. But let’s see how they open. There’s nothing wrong with staying on the sidelines until a more clear trend emerges.
Daily Recap
The ES made a new high in Tuesday’s pre-market (Globex session) and it has been all downhill since.
After a late-day rebound on Tuesday, the ES opened about flat on Wednesday at 4780. The market dipped 10 handles but ultimately resolved higher, climbing to 4788 at 10:25. That ended up being the session high, as the market slowly bled lower into the afternoon.
The action was filled with a series of lower highs and lower lows until the 2 p.m. Fed Minutes release.
The ES’s initial reaction was an 11-handle rally in the first few minutes but then it plunged 85 handles into the 4 p.m. cash close at 4692.
It seems like we’re skipping a lot, but the day’s action was pretty straightforward: drift lower into the Fed, followed by a small lift, then a plunge into the close. We didn’t see too much movement between 4 p.m. and the 5 p.m. futures close, with the ES closing lower by 91.75 points or 1.92% on the day.
In the End
In the end, the ES was weak in the morning and very weak in the afternoon. In terms of the ES’s overall trade, volume was 1.77 million, which is not necessarily low but seems low given the action.
As we all know, there’s no crystal ball when it comes to trading stocks, options, or futures. But the Market Imbalance Meter may be as close as it comes. Knowing how the “Big Money” is placing its bets can give our trading room a big wave to ride — or a warning sign to stay out of the water. Come check it out now, risk-free for 30 days.
Technical Breakdown
- NYSE Breadth: 76% upside volume
- NASDAQ Breadth: 78.3% upside volume
Given the decline, I’m surprised we did not have an 80%+ downside on the NYSE or the NASDAQ yesterday.
What we’re seeing now is investors reacting to the news that higher interest rates are on the way and traders trying to figure out how much of this is priced in. In other words, is the market overreacting to the news from the Fed?
On the one hand, rates may increase three to four times this year. That has me reminded of Q4 2018 when the Fed insisted on raising rates and the market rolled over hard as a result.
The S&P fell 21.4% while the Nasdaq dropped 23.9% until the Fed finally folded.
That said, many holdings have already corrected (or are in some form of a bear market already). The question becomes, are these groups already priced in for further rate hikes or will they suffer even more?
The silver lining is that, even if the Fed does go through with three to four rate hikes, we’re still talking about historically low rates and perhaps that will let inflation and some other costs cool down.

The other silver lining? Expectations.
A month ago, the market was already expecting three rate hikes by the end of 2022. So it’s not as if this is completely out of left field. The surprise is that we’ve gone from “possibly two, likely three hikes” to the assumption of “likely three hikes, possibly four.”
The other realization is that the Fed is likely to hike in two months, which previously stood at less than ⅓ chance a month ago to now a ⅔ chance today.
Put the two together and that’s worthy of some selling pressure I’d say and we’re getting it now. The question is, how much is needed?
Game Plan
Yesterday we kept it simple and wrote:
“The Game Plan is pretty straightforward: Keep an eye on tech/rates. Relief in these two areas should spell relief for the whole market. However, more pain could eventually tug the overall market lower.”
That’s pretty much the same thing today and we’re going to have to get much more selective.
The positive here is, we’ll see which stocks/industries hold up the best and which ones get swept up in the selling pressure. This relative strength will give us go-to names when the dust settles, whether that’s tomorrow, next week or next month.
Nasdaq
I hate being the “we said yesterday” guy, but in regards to the Nasdaq, yesterday’s Game Plan said:
I don’t like to say there’s a “line in the sand,” but it feels that way with how the NQ futures and the QQQ bounced from the 50-day moving average on Tuesday. A break of yesterday’s low that’s not quickly reclaimed opens the door for more selling pressure.

The Nasdaq broke the prior day’s low (shown above on the 15-minute chart for the QQQ) and that level turned to resistance. It was a real-time intraday change in tune. The ranges have been wide, but if you’re being disciplined, it’s manageable — even when you’re on the wrong side at first!
So now what?
If we zoom out to a daily chart on the NQ futures, you can see where there was support around 15,500.
If the Nasdaq can’t generate some sort of rotation higher, this area could very well be in play.
If it can rotate higher, 16,000 may be back in play, followed by a push to the 10-day, 21-day, and 50-day moving averages about 100 points higher.
We look likely to start the day under pressure, which may give bulls a chance to generate a relief rally. Generally, I look at higher opens as an opportunity for the bears in a situation like this.

If we zoom out even further to a weekly chart though, the action actually looks just like consolidation. There is a lower high in there and the NQ is leaning on the 21-week moving average…again.
But let’s keep some things in mind. First, the NQ hasn’t tested its 200-day moving average since April 2020. Neither has the QQQ. And it can only ride these trends for so long — like the 21-week — until they eventually give way.
I’m not saying I think the market will plunge, but I am keeping my mind open to the fact that we could see a 12% to 15% correction down to the 200-day/50-week moving averages and the Q4 lows.

It would be a rough ride but somewhat expected after a 155% rally from the 2020 low amid a rising-rate environment. That’s all. The world won’t end.
And besides, would a Q1 reset really be that bad? If anything, it may set us up for a stronger finish to the year.
10-Year Rates
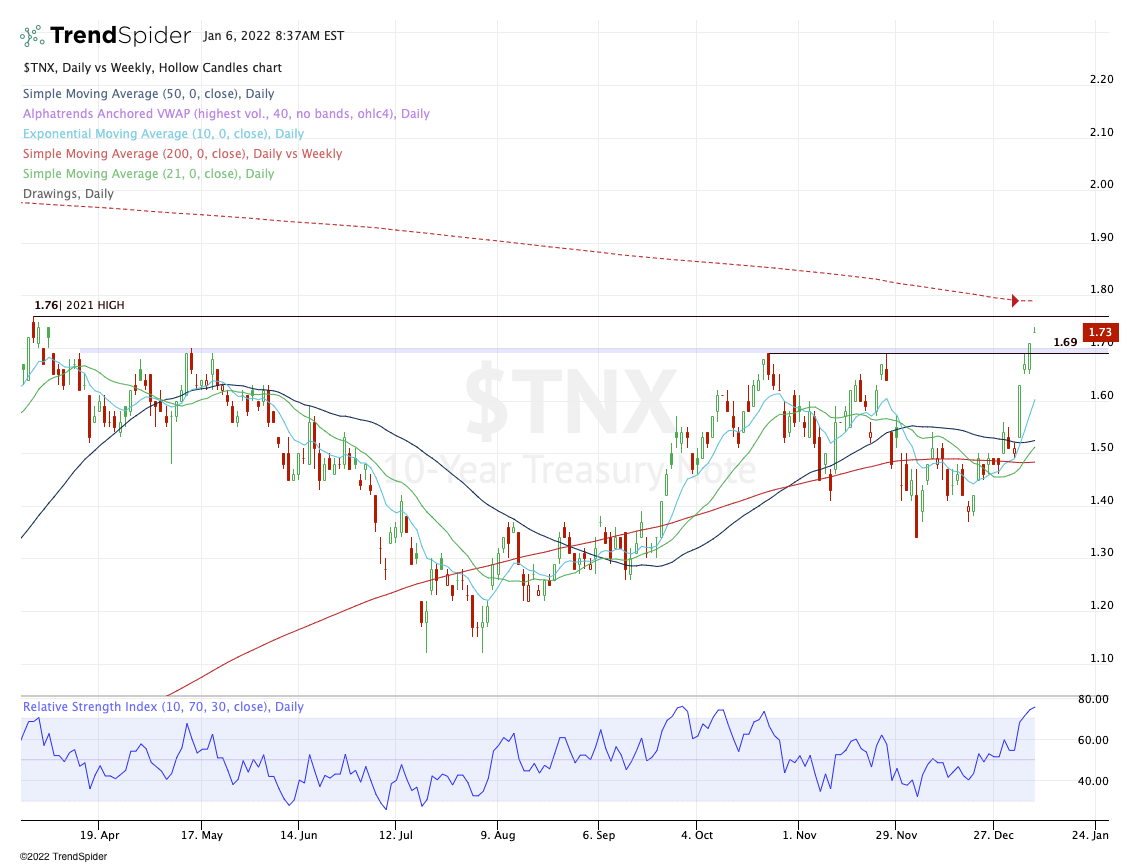
For now, just go ahead and keep this chart up on your screens. TNX is an important one to keep an eye on.
A fade should bode well for the Nasdaq and bonds. A further rally will have the opposite effect.
Individual Stocks
I’m likely taking today to get more defensive here and see what stocks shine through. Here’s a small list, sans charts.
- AVGO — A go-to name for us lately, at the 21-day moving average & prior breakout area. Reclaim of $642 could be a long if the QQQ stabilizes.
- CVS — remarkable strength
- ABBV
- TD
- PG
- MU — one of the few tech stocks still holding up; recently made new ATHs
- RACE — $257 to $260 is key downside area to hold
- F
- ON
Above all, my biggest piece of advice is to honor your plan at a time like this. There are times where you can get away with sloppy trading — ignoring a stop, not scaling out, etc. — and there are times where sloppy trading will be aggressively punished.
When you enter a position, know where your stop is. Take it if it’s hit. This is not the climate to hold through a stop and hope for a bounce.
It’s also perfectly okay to sit out for a few days or weeks. Remember what we said earlier this week: Know when to use the brake and when to use the gas.
Also, don’t forget about smaller position sizes, which keep the mental taxes from accumulating.
Disclaimer: Charts and analyses are for discussion and education purposes only. I am not a financial advisor, do not give financial advice, and am not recommending the buying or selling of any security.
Remember: Not all setups will trigger. Not all setups will be profitable. Not all setups should be taken. These are simply the setups that I have put together for years on my own and what I watch as part of my own “game plan” coming into each day. Good luck!
Economic Outlook

Comments are closed