The Opening Print Recap
The ES that finished weak on Tuesday’s close continued its weakness right into yesterday’s open. No surprise there.
Shortly after the open, the ES got hit by a wave of sell imbalances that pushed it down to 4681.25 at 9:48. From there it upticked slightly, then traded down to a new low of 4679.25 at 9:55. A buy program at 10:00 a.m. pushed the futures up to 4687.50.
After a little sideways price action, the ES popped through the VWAP up to a high at 4693.
It was a pretty bumpy day in reality and we were just getting started.
The ES pulled back to the 4685.50 area, popped to a lower high at 4691.50, chopped around some more, then pushed up to a new high near 4696. From here, the ES seesawed into a tightening range for most of the day. It faded from the 4696 area all the way down to ~4681, rallied back to 4692 (a lower high) then fell to 4684.50 (a higher low).
Learn how to trade that two-way “chop” and you are golden on days like this.
The ES traded 4689 as the 3:30 cash imbalance showed $508 million to sell, traded 4686.25 at 4:00, and dropped down to 4682.25 shortly after the cash close. After the drop, the ES bounced a bit and settled at 4685.25 on the 5:00 futures close, down about 11 points or -0.24% on the day.
In The End
In the end, the market acted and traded on the weak side — it’s exactly what Our Lean called for yesterday. In terms of the ES’s overall tone, it didn’t hold the rallies well. Each meaningful rally was sold into and any time the ES got near 4700, it faded.
In terms of the ES’s overall trade, volume was low at 1.02 million contracts traded. We have seen volumes drop in the past, but the current levels are historically low. I’m not sure if traders are waiting for another pullback or if it’s just a “too high to buy and too firm to sell” type of trade.
The all-time ES record volume day was 6.69 million contracts in March of 2009. Clearly, the futures index markets have lost volume but when the ES does 1 million contracts or less and you subtract the Globex volume, it’s more in line with 800,000 to 850,000.
Bottom line: Liquidity dries up the higher the S&P goes and that’s what we’re seeing now.
Our View — A Convo With The Pitbull
The PitBull continues to warn of a larger selloff. but he is now saying “It won’t come until 2022.”
There is not enough meat on the bone for me, but I can’t discount what the Bull has to say because he’s the one who told me, “there is rotten wood floating around in the market leaders” — that being the brokerage and bank stocks in late 2007 when subprime was just coming to the surface.
I know he bases his view off of all the stocks he charts each night and this is what he said: “It’s not good, many of the big-name stocks are well off their highs and others are trading below their 50-day moving average. This usually is not a good omen.”
I agree but unlike 2008, there is a record level of liquidity and rates are still near zero. Yes, next year the Fed will taper but that’s next year. Right now I want to concentrate on buying pullbacks and looking for the next 100 to 150 point rip.
Our Lean
Sometimes the most basic rule is the most important rule. I am really old school when it comes to the trend. I know we all know what it is, but sometimes we need a refresher. According to Investopedia, the definition of the word “trend” is:
“A trend is the overall direction of a market or an asset’s price. In technical analysis, trends are identified by trendlines or price action that highlight when the price is making higher swing highs and higher swing lows for an uptrend, or lower swing lows and lower swing highs for a downtrend.”
I got it, but the concept of “trend” — and more importantly, not fighting the trend — has really become important in the last two years.
Yes, there were occasions when the ES sold off — and in some cases sharply — but the end result has remained the same: New highs.
The S&P 500 has experienced 10% corrections in 29 of the past 50 years, happening about once every 19 months, on average, going back to 1928.
That’s the problem, we don’t get 10% corrections! So if you are waiting to “catch a long” for a year-end move, I think it may be a good idea to start scaling in. I know this won’t happen, but if the Dow futures got down to 35,000, I would load the boat with cheap calls.
Our Lean: The current weakness may continue for part of the day. One of our setups is to buy the ES if it’s weak late in the day on Thursday. It’s a high-percentage trade, but if that same “sell the Dow and S&P, and buy the Nasdaq” rotation is floating around, that could be a problem.
I know it doesn’t look this way, but I still think 4760 is in the cards. Buy the pullbacks. The last few days have been a big “back-and-fill” pattern and the November options expiration is bullish.
As we all know, there’s no crystal ball when it comes to trading stocks, options, or futures. But the Market Imbalance Meter may be as close as it comes. Knowing how the “Big Money” is placing its bets can give our trading room a big wave to ride — or a warning sign to stay out of the water. Come check it out now, risk-free for 30 days.
Technical Breakdown — S&P, Russell & the Nasdaq
Danny just spoke about 4760 still being in the cards and that’s very much a reality. However, it’s also a reality that 4700 remains — as we said earlier this week — a “tough nut to crack.” Each rally to the 4700 area has been faded so far.
The bull case is pretty simple: Even if we strip out all of the stimulus and low rates, earnings, trends, etc. — we end up with the simple fact that the buy-stops from the shorts are building throughout the 4700 to 4712 area. They keep selling against this area of resistance and so far, it’s been working.
But notice that the ES keeps putting in higher lows and riding its short-term moving averages.
If we get a push through resistance and those buy-stops start cascading, then we get our potential push to the 4725 to 4728 area, opening the door for a larger push towards Danny’s target.
The bear case is also pretty simple: One could argue that the ES (or SPY and S&P 500) has double-topped here with some hearty divergence on the RSI.

So how do we manage this?
When questions remain, I default to the trend. Until it fails, that’s where my bias will rest.
Who has had control? For now, it’s the bulls’ game to lose and while the bears have some opportunity, they are in a “prove-it” state as of now.
As for the weekly setup, we are making an adjustment.

On the upside, our view remains the same. We had an inside doji candle last week. Should we get a weekly-up setup over 4707, we could see a real squeeze to the upside, putting our first round of targets in play.
However, here’s our adjustment in regards to risk. Rather than waiting for a potential weekly-down trigger at 4625 to get defensive, let’s become more cautious on a move below this week’s low at 4667.
That was Monday’s low and we’ve been building above it ever since, with each daily low since then getting higher and higher. If we see a ~30 handle fade and fail to hold 4667, it’s time to be a bit more defensive.
There’s no sense in waiting for a 75-handle dip to start thinking about how to play defense. By then, the market may very well be back to thinking offense.
The Russell (IWM)

The Russell (IWM) has a pretty nice setup. We had a powerful breakout over resistance and the IWM is now fading back down to that breakout level and the 21-day moving average.
Any type of upside reversal or strong support at this $234.50 area should get the bulls’ attention. I know it will get mine. If the IWM can take out this week’s high at some point at $240.76, a push to the highs is on the table. Above that puts the 161.8% extension near $250 in play.
On the downside, a break of the 21-day and $234 breakout level puts $230 or lower on deck.
Nasdaq

The Nasdaq futures (NQ) is a pretty straightforward setup. It’s currently pushing for a weekly-up rotation over the 16,391 level. It has wicked down pretty hard from this level in the past, but a push over it could really get things going.
Above 16,400 puts the all-time high in play at 16,448.50, followed by a possible push to the 16,500 to 16,530 area.
On a failure, watch the overnight low at 16,320, followed by yesterday’s low at 16,270.
Technical Breakdown — TGT, NVDA, ROKU and V
Remember yesterday when we laid out the post-earnings play for Target and hit the reversal in Lucid Motors?
Well now we have an update on TGT and are looking for two more reversals on the day.
ROKU had a nasty spill on the day and is trading lower in the pre-market. That’s my No. 1 candidate for a buy-reversal going into today. That’s a gap below Wednesday’s low and getting long if it reclaims that low (which is at $243.16). As long as it doesn’t fall too far, our stop will be just below today’s low.
I’m watching the same thing for Visa (V). However, this is less likely to trigger because of yesterday’s big bounce. We’ll see if it trades down and breaks the low, then reclaims if. If so, we’ll be long.
Conversely, an open above $205 that quickly goes daily-up over $207.31 may have me sniffing around a long position with my stop at today’s low.
Target (TGT)
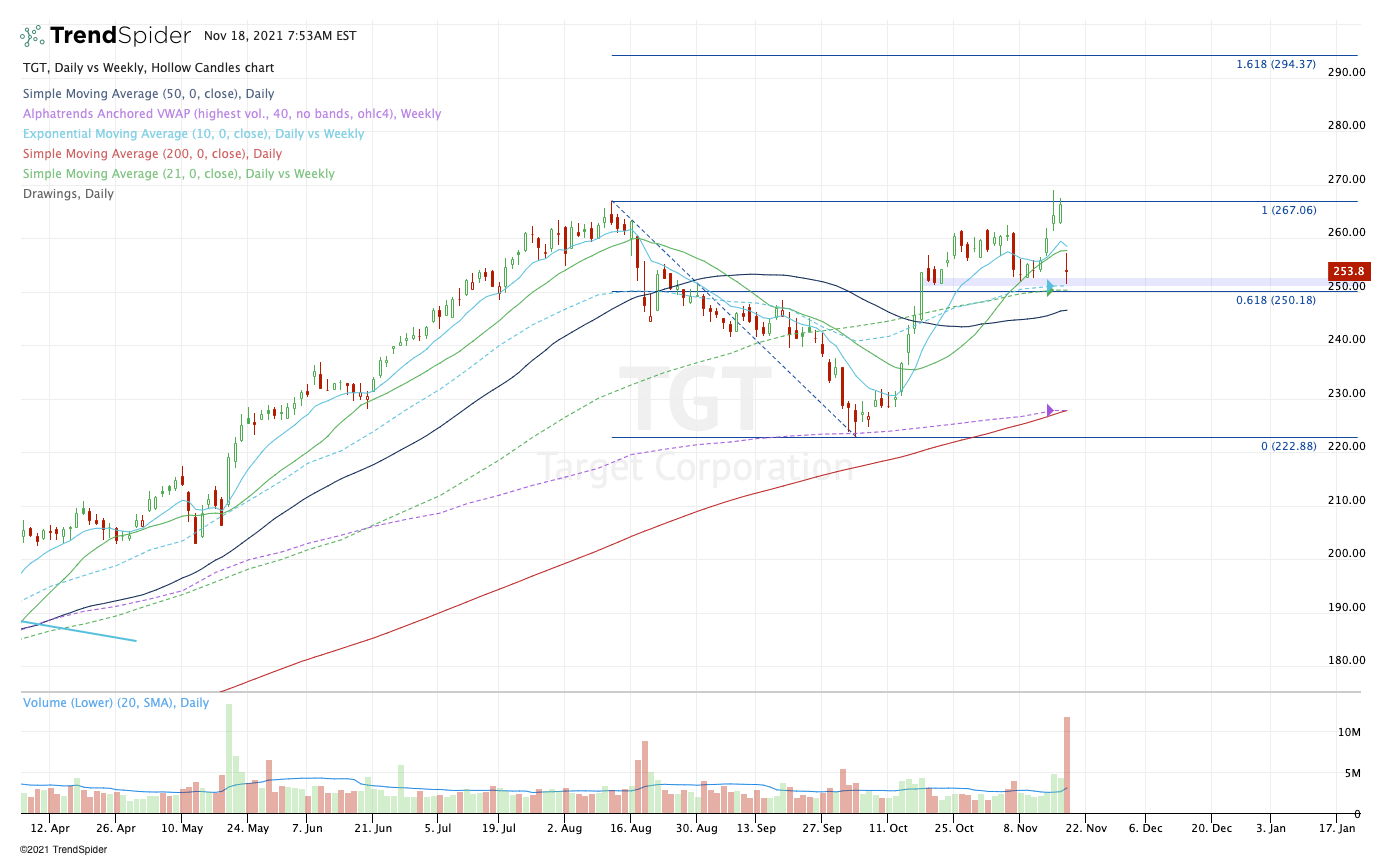
Target found support right where we were looking for it yesterday. Now let’s see if we can go doji daily-up over $257.17.
Nvidia
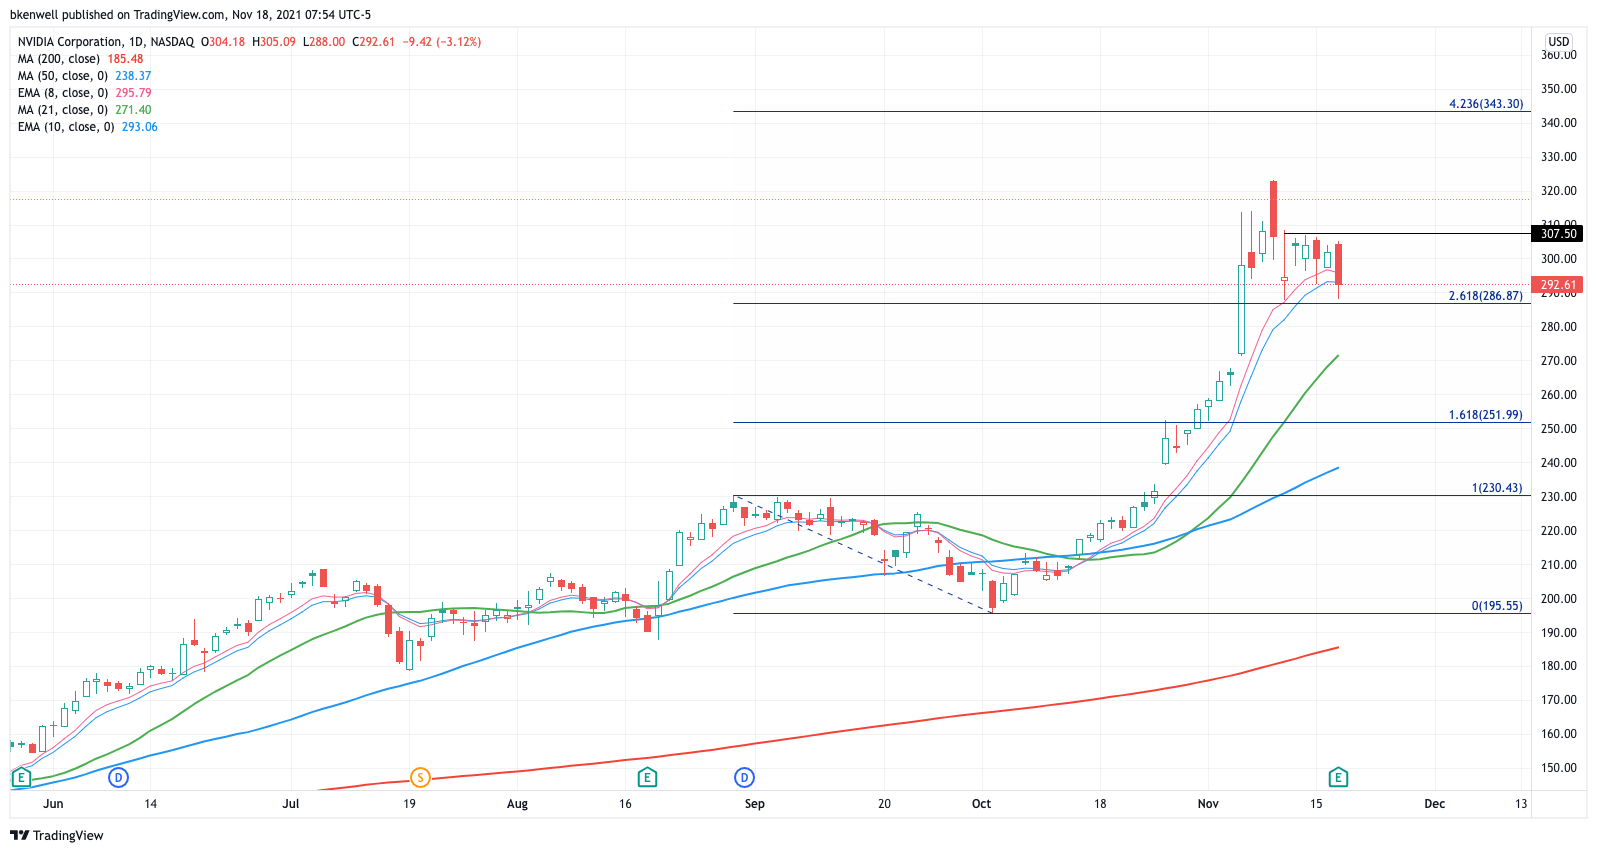
Nvidia gave a really nice pre-earnings reset, finding support in the $290s. Now rallying on the print, I would love to see this stock hold the $307 to $308 area on the upside, clearing a ton of recent daily highs.
Above $315 opens the door to the current ATH near $323. Above $325 and a push to the $340 to $343 area is possible, followed by $350.
Disclaimer: Charts and analysis are for discussion and education purposes only. I am not a financial advisor, do not give financial advice and am not recommending the buying or selling of any security.
Remember: Not all setups will trigger. Not all setups will be profitable. Not all setups should be taken. These are simply the setups that I have put together for years on my own and what I watch as part of my own “game plan” coming into each day. Good luck!
Disclaimer: Charts and analyses are for discussion and education purposes only. I am not a financial advisor, do not give financial advice and am not recommending the buying or selling of any security.
Remember: Not all setups will trigger. Not all setups will be profitable. Not all setups should be taken. These are simply the setups that I have put together for years on my own and what I watch as part of my own “game plan” coming into each day. Good luck!
Economic Outlook
Comments are closed