Our View
Putin sending some equipment back to its bases in Russia isn’t going to stop the market from falling again and it won’t stop the Fed from jacking up interest rates. As noted yesterday in the “Game Plan,” the consensus has now shifted to a 50 bps hike.
Nothing has changed! According to @Bespokeinvest, yesterday was the third day this year that the SPY opened in positive territory and stayed there the entire trading day. From 12/28 through 2/1, the SPY traded below the prior day’s close for 25 straight trading days, which was the longest streak in over 10 years.
The higher close was good, but the 25 lower closes are the key to that paragraph. As I said in yesterday’s OP, the ES can rally for one to two days on good news from Eastern Europe. Then we’ll see what it’s really made of.
Our Lean — False Starts
I probably write too much, but the point of posting yesterday’s chart of the 1973-1974 stock market was to highlight that there can be big bear market rallies. Over the last 10 years, so many traders have gotten used to “V-bottoms” and shallow dips that always get bought.
In fact, many traders have never even traded in a bear market. That’s not a bad thing or an insult of any kind. But I posted that chart to put into context that not every rally is the start of a new uptrend. Sometimes it’s just part of the larger overall trend to the downside.
Those rallies are what I call “false starts.”
Our lean is to sell the early rallies and buy the pullbacks. I have a big resistance area mapped out just above 4600 to 4610.
Daily Recap
The ES traded 4441.50 on Tuesday’s regular session open, up 47 handles from the prior close. After the open, the ES rallied up to 4462 and faded back down to the opening range, but ultimately held the 4438 to 4440 area.
Despite rallying higher on strong breadth, the ES struggled with the 4462 to 4464 area for the rest of the morning before fading back down to the opening range at 12:30. It made its session low at 4436 at 12:50, bounced, and rallied to ~4463 at 3:00 before topping out and pulling back again, this time down to 4442 — a higher low.
The ES finally rallied to a new session high at 4466.75 just after 3:50 as the cash imbalance flipped to $800 million to buy. On the 4:00 cash close, the ES traded 4464.50 before settling at 4457 on the 5:00 futures close, up 62.50 points or 1.42% on the day.
In the end, Russia pulling back some of its military hardware from the Ukrainian border caused a short-covering rally. In terms of the ES’s overall tone, it was firm. In terms of the ES’s overall trade, volume was steady but on the low side, with 1.48 million contracts traded.
Tuesday’s Full-Day Range, 86.25 points:
- H: 4468
- L: 4381.75
- C: 4464.50
- V: 1.48 million
Technical Edge
- NYSE Breadth: 79.95% Upside Volume (!)
- NASDAQ Breadth: 86.9% Upside Volume (!)
We had a strong breadth day in the market yesterday, but for it to really mean anything, we will need another 80%-plus upside day today.
S&P 500 — SPY
- Feel free to extrapolate this layout to the ES.
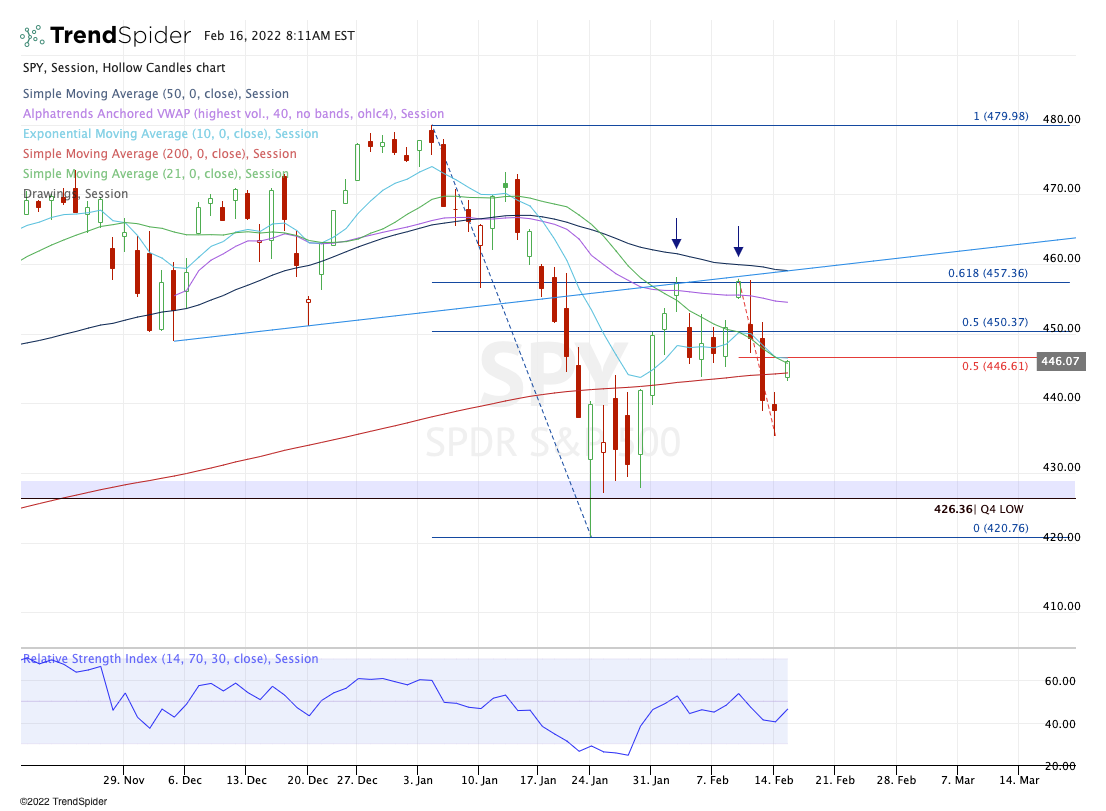
The 4467 to 4470 area really held in as resistance for the ES on Tuesday and the upside levels remain the same as yesterday. For the SPY, the upside levels are:
- $446.28 — yesterday’s high
- $446.60 — puts it over the 50% retracement of current range, as well as the 10-day and 21-day moving averages
- $450 — the 50% retracement of the full range
Downside levels of interest:
- $443.18 — yesterday’s low
- $441.60 — gap fill
- ~$439 — last week’s low
Nasdaq — QQQ
- Feel free to extrapolate this layout to the NQ.

Upside Levels:
- $356.37 — y’day high & the 21-day moving average
- $358 — 61.8% retracement of current range
- $360 to $361 — recent resistance
- $366.50-ish — last week’s high and the 200-day
Downside Levels:
- $351.82 — y’day low
- $350.30 to $351 — Q4 low and the gap fill, respectively
- $345.80 — last week’s low
Individual Stocks & Go-To Watchlist —
*Feel free to build your own trades off these relative strength leaders*
Guys & Gals, we must know the climate we are in right now. With the VIX still in the mid-$20s, multi-day swing trades are difficult.
It’s why we were quick to trim our position in ABBV yesterday morning.
It’s why last week we were quick to reduce AMD and AAPL, even though they looked great from our initial entry. This market is not rewarding patience, it’s punishing stubbornness.
Given this observation, my trims may move from ⅓ of the position up to ½ for the time being. Here’s the go-to list & notes, followed by some charts.
Go-To Watch List — This list is getting longer, which is a good sign.
- TD — Inside Day — Looking for daily-up over $84.29. Still long.
- ABBV — 261.8% extension is $147-ish — Trimmed some yesterday, still long.
- BROS — 2x daily up over $53.70.
- TSN
- WFC, MET — MS 2x daily up over $104.50
- Energy — HAL, OXY, SLB, etc.
- BRK.B
- H and MAR (very strong) — Airlines looking better too
- PM (very strong)
- COOP (very strong)
- TU (very strong)
- MAT (very strong)
- DE
- V & MA — Resetting now. See if a bid comes in soon
- MKC
- TECK
ZTS

Despite talking of a longer Go-To list above, ZTS could be setting up as a short.
The 10-day, 21-day, and 200-day are acting as resistance, along with the daily VWAP measure and the $200 level. If ZTS can clear all of these, then the bulls can grab control and try for a weekly-up rotation over $205.50.
As it stands though — and even with a top- and bottom-line beat yesterday — the sellers keep selling ZTS.
Daily-down below $196.50 that’s not quickly reclaimed could put last week’s low in play at $194.42. Weekly-down could put $190 or lower on deck.
OXY

Yesterday I said we should give the energy group some time, but for the strong names, we can look for bounces from the 21-day. This chart also highlights why I like reversals so much.
OXY undercut last week’s low of $38.97 by 16 cents — giving us a stop-loss of about 20 to 25 cents — and letting bulls play for a bounce. I missed this one yesterday and did not snag it, but it’s exactly what we should be on the lookout for.
Daily-up over $40.50 could get another run to the upside started. Be careful of a fade.
SHOP

Trading lower after a top- and bottom-line beat, SHOP is down about 5% in the premarket now.
With the mild dip, we’re close to the three-day low and last week’s low at $835. If we can get an undercut, it could create a bullish reversal, particularly as the stock is into uptrend support (blue line).
If SHOP breaks $835 and can’t reclaim it — aka no reversal — then it may test down into the $780 to $800 range, which has been a bounce zone for the last month.
Economic Outlook

Comments are closed