Our View – No Rest for the Weary
The ES is now down 22% from its January high. Bitcoin traded under $21,000, an 18-month low, Coinbase dropped 11% on Monday and is now 85% below its opening IPO price, and the yield on the 10-year note is 3.336%, the highest close since 2011. I think there is reason to be concerned.
Where is the bottom? I have a few levels in mind and they include 3600, 3300, then the 3100 to 2900 area. This is probably the first time in my life that I hope I’m wrong — remember yesterday, where I said I’m a bull at heart — but it feels like a total liquidation trade right now.
In fact, and I can’t verify if, but I heard a story about how the mutual funds are so backed up with investors taking money out that it takes 3 or 4 days to get the orders through. I am growing very concerned about people’s retirement accounts. Like during the 2008 credit crisis, some stocks will not make it and some will never fully recover.
Let’s face it: We live in scary times right now.
Our Lean
There is a good chance we see some short-covering today. Buy the early pullbacks and sell the rallies.
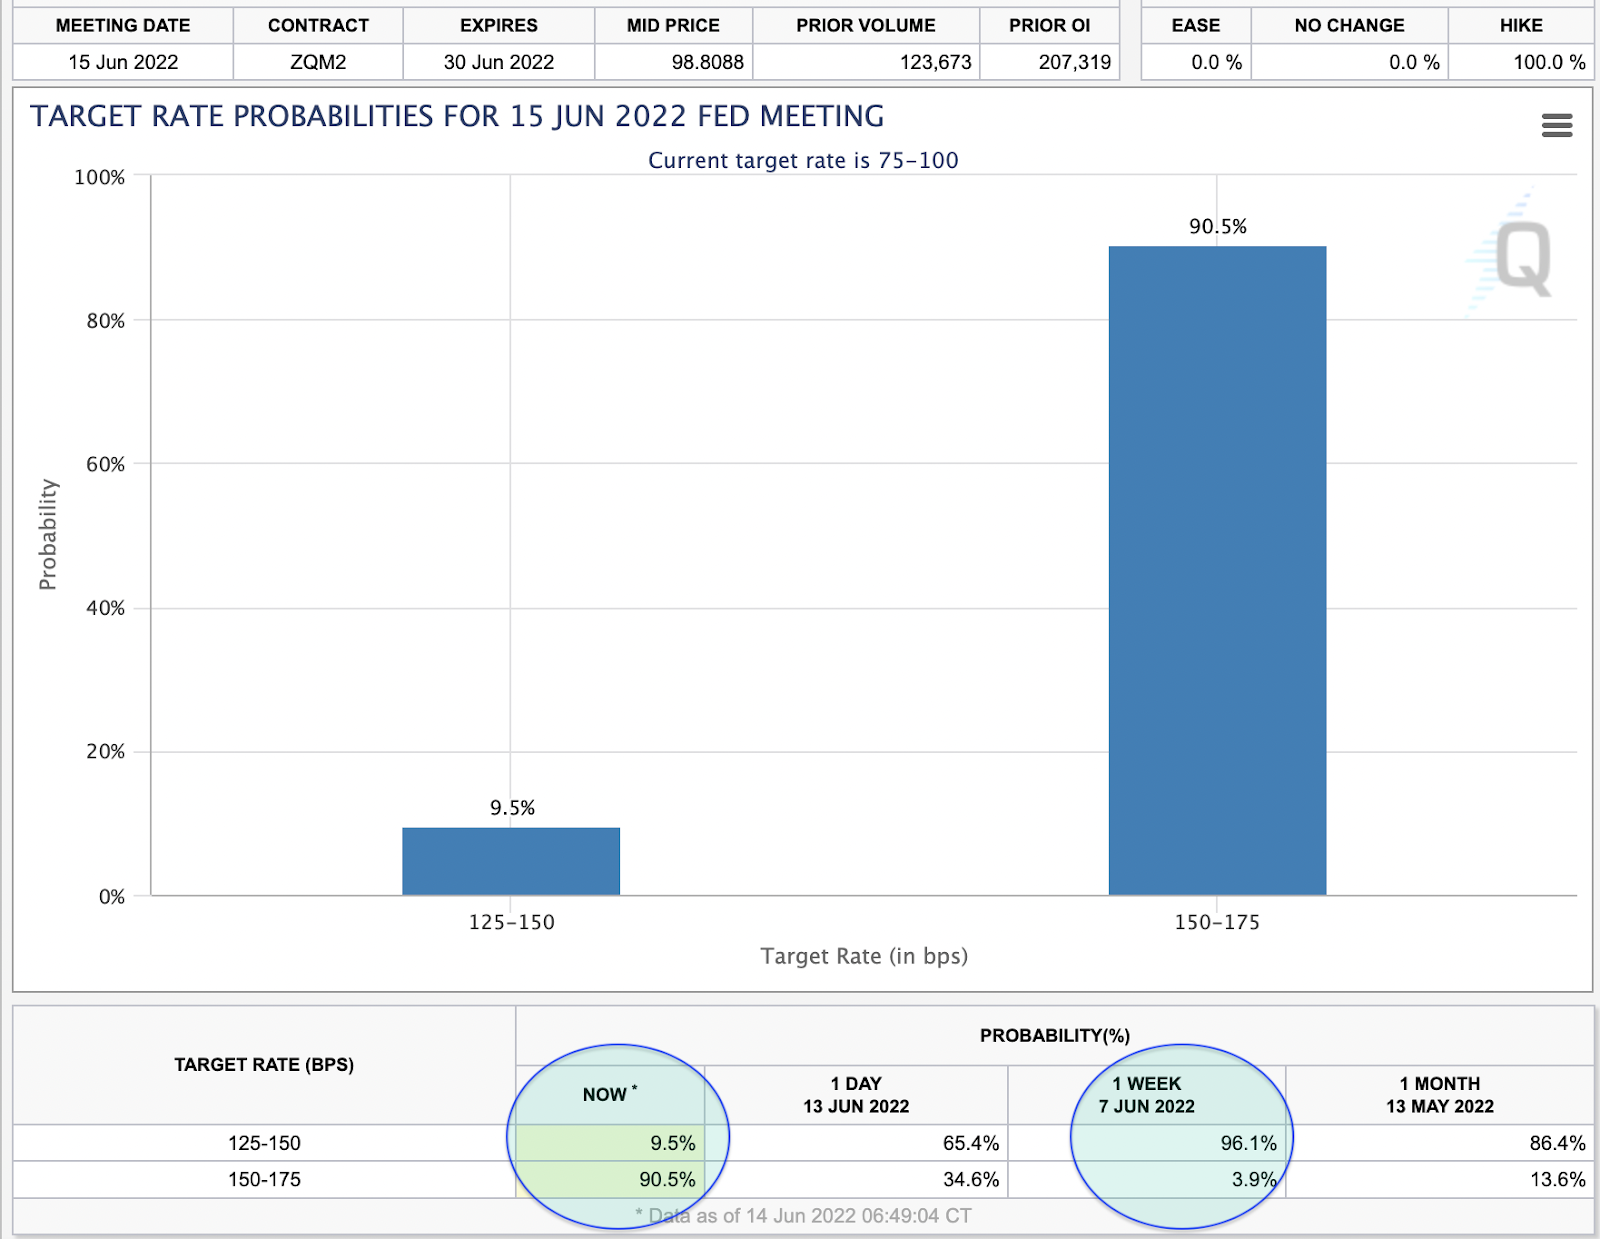
Tomorrow the Fed will raise interest rates by 50 bps, although there is a growing sense of belief it may be by 75 basis points — including by Goldman Sachs Chief Economist Jan Hatzius — but I don’t think that’s in the cards. What is in the cards is a lot of 30- to 50-point swings.
Just look at where the odds stood last week and where they stand now, regarding rates:
Daily Recap
The S&P futures traded 3798.75 on Tuesday’s 9:30 open, down 103 points. After the open, the ES traded up to 3819.50 and then sold off down to 3750.50 at 11:10 am, down 156 points on the day. After the low, the ES rallied 65 points up to 3815.50 at 12:35 and then sold off down to 3770.25, then rallied to a lower high at 3801.50.
After the pop, the ES sold back down to 3772.75, rallied back up to another lower high at 3791.75 at 2:40, and then sold off down to the low of the day at 3739.25 after the 3:50 cash imbalance showed $5.6 billion to sell. The ES traded up to 3762.75 at 4:15 and settled at 3757.50, down 140 points or -3.6% on the day.
In the end, it was a total ‘meltdown.’ In terms of the ES’s overall tone, it seems to be going from bad to worse. In terms of the ES’s overall trade, volume was HIGH at 3.1 million contracts traded, the highest one-day reading since the Jan. 24 low.
- Daily Range: 143.25 points
- H: 3878.50
- L: 3735.25
Technical Edge
- NYSE Breadth: 98.4% Downside Volume (!!!)
- NASDAQ Breadth: 86%% Downside Volume (!)
- VIX: ~$33.50
Monday marked our third straight session of 89%+ downside volume. Yesterday’s reading of 98.4% downside vol is the highest I can recall on a closing basis. At one point during the day, we cracked the 99%+ threshold. I have never seen that before, so how the market handles from here will be quite interesting.
Game Plan — S&P 500 (ES and SPY), Nasdaq
The market looks like it is discounting the FOMC meeting on Wednesday, as it continues to sell off amid increasing speculation that the Fed hikes 75 bps instead of 50 bps.
I don’t like that we’re gapping up coming into the day. If that’s the case, I think we will give up all of those gap-up gains and retest yesterday’s closing prints at the minimum and retesting the lows would not be surprising at all.
We are lacking in individual setups, but the environment is horrendous. The VIX is $33+ and the market is melting down. The best play right now is capital preservation and nimble trading on the indices with small position sizing. If the action is too hectic, there is zero shame in sitting this stuff out for the time being and taking it one session at a time.
S&P 500 — ES

I want to look at the bigger picture here with the S&P. Yesterday was simple, right? Hold 3800 or face lower prices. It was the latter and we got the flush down to the 3750 area.
With the Fed meeting on the books for Wednesday, maybe we can get some sort of selloff into the event, then a rally. 3800 remains a key pivot. If it’s reclaimed, we can have more upside, potentially to 3896, then back up toward 4000.
If 3800 is resistance, we must be fluid and open-minded that more downside is in play. Remember, we are traders. We follow the flow and go where there is the least amount of resistance.
Ultimately, we could be in store for a test of ~3500. That’s where we find the 200-week moving average and the big breakout area from Q3 2020.
The bad news is that that’s more than 225 points below this week’s low. The good news? Well, it’s “just” a 6% drop from current levels.
S&P 500 — SPY

Zooming back in with the daily chart, there is still no new low on the RSI reading for the SPY, which is a bit surprising.
$380.50 remains key and notice how it rejected the SPY yesterday. I don’t like that we’re gapping slightly higher coming into the day. I think we will give up all of those gains and at a minimum and retest yesterday’s close at $375, and potentially test $373.30.
How the SPY handles those levels will say a lot.
Nasdaq — NQ

Similar to the ES, the NQ broke 11,490 and down we went. Remember, the indices are just taking the path of least resistance at the moment; They are following the trend.
In this case, just a 4% dip from yesterday’s low gets us to the 200-week moving average and even less of a dip will get us into that key breakout zone from the second half of 2020.
On the upside, 11,500 remains key. Back above that and we can see a further squeeze.
Note: We saw a peak-to-trough decline of 32.1% during the Covid selloff (far left of the chart). We are currently sitting at 32.7%.
Bitcoin

We talked about Bitcoin a week ago about how it wasn’t mustering up much of a bounce despite sitting on strong support. Now we know why.
That said, it must hold this $20,000 area now. Between $19,500 and $22K, it has the 200-week moving average and a retest of the prior ATH near $19,650. This zone is critical.
Go-To Watchlist — Individual Stocks
*Feel free to build your own trades off these relative strength leaders*
- Numbered are the ones I’m watching most closely.
- Bold are the trades with recent updates.
- Italics show means the trade is closed.
- DXY / UUP — I am down to just ¼ of a position here, as the response in the USD has been fantastic. One of the lone bright spots in a sea of red. → Can hold for a higher push here, potentially in the FOMC event, and use a B/E stop or cash out completely.
Relative strength leaders (List is cleaned up and shorter!) →
- These are on watch for dip-buys:
- XLE
- AR
- XOM
- TECK
- DLTR
- AMD —
- IBM
- DOW
- ARCH
- NVA
- XLU
- TMST
- VRTX —
- AMGN
- MRK
- MCK
- BMY
Economic Calendar

As we all know, there’s no crystal ball when it comes to trading stocks, options, or futures. But the Market Imbalance Meter may be as close as it comes. Knowing how the “Big Money” is placing its bets can give our trading room a big wave to ride — or a warning sign to stay out of the water. Come check it out now, risk-free for 30 days.
As we all know, there’s no crystal ball when it comes to trading stocks, options, or futures. But the Market Imbalance Meter may be as close as it comes. Knowing how the “Big Money” is placing its bets can give our trading room a big wave to ride — or a warning sign to stay out of the water. Come check it out now, risk-free for 30 days.
Comments are closed