Danny’s view: The Opening Print Recap
Just after 9:00, a headline hit saying that President Joe Biden was renominating Jerome Powell for a second term as the Fed Chairman and will put forth Fed Governor Lael Brainard as Vice Chairman. There was a level of concern the president was going to replace Powell, but when the headlines hit the tape, the ES buy programs hit. From there, the ES and NQ started running buy-stops.
The ES that closed weak on Friday firmed up on Globex and made a high of 4716.75, then opened Monday’s regular session at 4713, up 15 points on the day. It didn’t stop there, climbing to 4740.50 at 10:18, up 28.50 points off the opening low and 45.5 handles off the Globex low at 4695.
It was an easy start to the holiday-shortened week — too easy, in fact.
That’s when the reversal kicked in. After the high, the ES pulled back down to the 4697.50 level at 11:58, 43 points off the high. After some back-and-fill, the ES slowly rallied all the way up to the 4729 level just after 3:13, up 31.50 points off the low as the early MiM showed $319 million to buy.
But that rally didn’t last either, as the ES again reversed lower and flushed into the close. It slipped down to 4701 at 3:49, about 39 points off the high as the MIM flipped to $335 million to sell. The ES traded 4699.50 as the final 3:50 cash imbalance showed $2.4 billion to sell and then sold off down to 4678 at 3:59, 58 points off the high of the day.
On the 4:00 cash close, the ES traded 4679 and shortly after 4:00, it traded down to 4674.25, down 66.25 points off the high of the day. After a small bounce, the ES settled at 4684 on the 5:00 futures close, down about 14 points or 0.3% on the day.
In The End
In the end, the ES traded up to my 4740 level, exactly what I was looking for last Friday. However, there always has to be some level of pain before it works. It was a total “pain game” that is not going to get any easier as year-end rolls around.
In terms of the ES’s overall tone, the ES and the NQ were firm early in the day and very weak late in the day. In terms of the ES’s overall trade, volume was higher at 1.626 million contracts traded.
Our View — Big Volume, Big Reversal
I want to remind everyone that I do not adjust the Our View or Our Lean part of the Opening Print. It’s written during the trading session and is usually finished by 6:00 pm.
I did not sell yesterday because of the Powell news open, but I did try it a few times on the way up to the 4740.50 high. Shorting early was like standing in front of a freight train. Like I said in Our View yesterday — I expected a two-way trade — but I didn’t expect such a big late-day reversal.
While many are looking for a straight “up” move this week, I actually remember the Thanksgiving holiday week having some big twists and turns, but closing firm. One thing we know for sure is, ‘everyone’ loves the upside.
I agree…but you have to be patient! Let the shorts enter into weakness then start looking for a low.
I want to express something. While I still think the ES goes up I also think the higher the S&P goes, the slipperier it will get. I am not one of those bulls that thinks the year-end rally will be a piece of cake. As of today’s close, the S&P cash is up about 25%. Let’s not forget that.
Our Lean
If the ES goes out at a big discount to the S&P cash, there could be an early pop. The problem with the S&P isn’t that it can’t rally, it’s that it’s not holding its gains on those rallies. That is a big problem right now but it should resolve itself this week.
Our Lean is to take a guided approach based on yesterday’s selloff. My guess is we see some further downside and then rally on Wednesday and Friday. If the YM falls to 35,000 or near there, I am going to buy the YMZ and hold. If I’m right, the Dow can rally significantly by year-end. Remember to use stops in an approach like this.
As we all know, there’s no crystal ball when it comes to trading stocks, options, or futures. But the Market Imbalance Meter may be as close as it comes. Knowing how the “Big Money” is placing its bets can give our trading room a big wave to ride — or a warning sign to stay out of the water. Come check it out now, risk-free for 30 days.
Technical Breakdown — SPY, QQQ, Breadth
Let’s back up and not get overly wordy here. The situation was simple:
- Trend was (is) our friend.=
- SPY was above all major moving averages
- QQQ was above all major moving averages, at new ATHs and went weekly-up
However, the caution flags were piling up, too.
- Notable divergence on the SPY and QQQ while at ATHs
- Poor breadth all week (I’ll leave yesterday’s chart of last week here).
- Lack of traction at ATHs and stalling at our upside targets

Breadth obviously doesn’t tell the entire story, but it shows how — even on some of the market’s stronger days — breadth was poor. Short of Monday (11/15), the NYSE couldn’t even muster up a 40% upside day.
So where do we go from here?
The ES closed down just 14 points from Friday’s close, but the action was much more discouraging than that. That’s as it actually fell over 56 handles from the high, while the ES settled 369 points off its high.
We’re looking for opportunities, but after a roaring six-week uptrend, the last thing we want to do is force something stupid and pay the price — especially in a holiday-shortened week.
Yes, the holidays tend to side with the bulls, but that doesn’t guarantee a rally.
S&P 500 Futures

As you can see, the ES actually broke our downside risk level at 4667 in the Globex session and all but tested the 21-day moving average.
That low is at 4654.50. If the ES finds some energy here, the bulls could get the move they are looking for, but as always in a trend trade, I prefer any asset on the long side to be over the 8/10-day moving averages.
Below does not mean it won’t succeed, but it’s open to more potential risk.
A break of 4667 in the regular-hours session could put a retest of the overnight low in play. That’s the downside risk for now. If the ES breaks the 4654 level and can’t reclaim it, it could be vulnerable to a dip down to the 4625 area.
SPY

As for the SPY, it’s actually a little better situation for the bulls. The SPY is still trading above the $466.23 level we laid out yesterday. Down into the 10-day moving average now, we can’t rule out a bounce.
However, the SPY essentially closed on its low, which isn’t a good look. A break of the 10-day at ~$467 puts last week’s low in play (our risk level).
A sustained break below that puts the 21-day moving average on the table. I’m a level-by-level trader. But for now, I’m seeing a worst-case scenario of a 4% to 5% correction in the short term. That would send us to the prior breakout zone at $454 and the 50-day moving average.
However — I will also readily admit that it took ages for us to get a 5% correction this year. The trend has been overwhelmingly in the bulls’ favor and while the SPY remains above all of its short-term moving averages, I’m not going to reverse my stance with a snap of my fingers.
Further, one “bad day” will have me upright and paying attention, but not shifting to a “worst-case” mindset overnight.
Yes, there’s divergence and yes there’s bad breadth. But we need rotational proof — daily-down, weekly-down, etc. — before we can commit to the downside.
On Monday I wrote:
If [the SPY] can resolve higher and effectively go three-times weekly-up over ~$471, that could open the door to the $480 to $482 area.
The fact that we did go weekly-up then reversed hard is not a great feeling. Let’s see if and where the SPY can find its footing today.
Dow

Danny spoke about the Dow in his section above and I wanted to add some technicals to the setup.
Currently, the Dow Futures (YM) are holding the prior breakout area as support, effectively 35,520. The YM did breach this level overnight, bottoming at 35,370. If we take out the 35,500 level, this low is back in play. Below that lands the YM at the 50-day moving average and 35,000 area — just as Danny was talking about as his area of interest.
He mentions using stops and that’s a good idea. Coming off the Q3 and Q4 low, the 34,850 level was pretty solid resistance. We haven’t had a chance to test this level as support since the big run, but I would argue that if the YM doesn’t hold this level, more downside could be in play.
We currently have a gentle “ABC” correction down to current levels. I want to see if we can resolve up through the 21-day moving average and the 36,000 level. That puts the high in play at 36,446, followed by our 161.8% extensions between 36,623 and 36,884 — call it 36,750 if you’d like.
Those are measured from the current range (Oct. low to the August high) and from the Q1 Covid range. So both are meaningful.
Individual Stocks
Growth names were indiscriminately crushed yesterday. These are tough ones, as they are clearly in a bear market while the overall market continues to chug higher. It’s also — in my opinion — why the advance/decline ratios look so poor.
Longer-term, this is a concern if they can’t find their footing. The higher-quality names are trying, but so far, it’s unconvincing.
Bulls need some capitulation in this area of the market. We had some concerted efforts yesterday by sellers, as this whole group was puking in sync. I don’t know that we capitulated, but many put in a low to trade against.
Keep an eye on TWLO, ROKU, and PYPL as a few leaders in this space. All three bounced hard off the lows. Three things can happen from here:
- Red-to-green (R2G) off the open and the low from Monday “sticks.”
- An undercut of Monday’s low and a R2G reversal follows.
- A continuation lower, as they lose Monday’s low and can’t reclaim it.
Two Other Reversals

Visa is above and Mastercard is below. I don’t know that these names are prepared to reverse quite yet. I do like them quite a bit as long-term investments and the selloffs have been aggressive as of late — especially in a high-spend environment.
For Visa and Mastercard, they both may need to break and reclaim the 2021 low, which is just below current levels. Otherwise, a move back up through the prior November low could signal a potential bottom.

Unity (U)
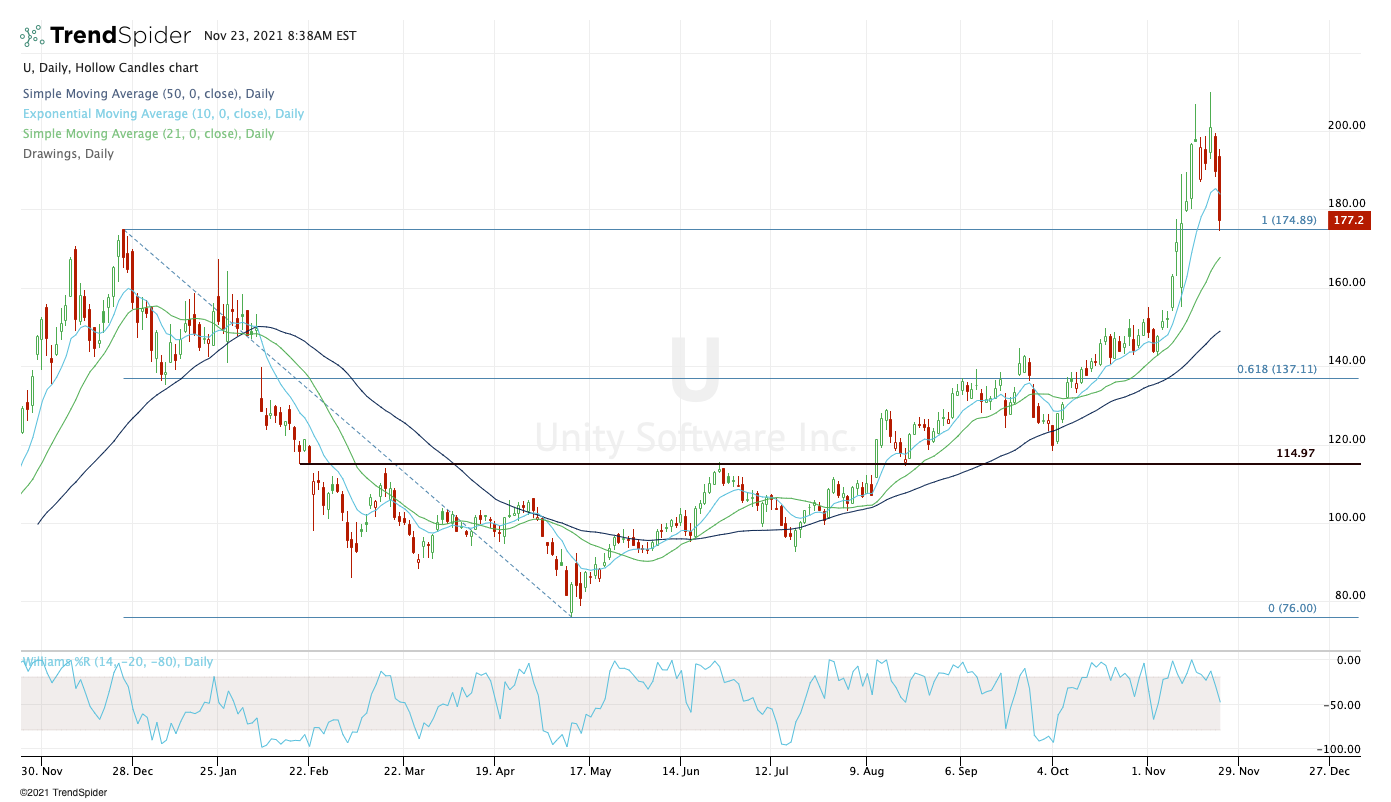
Trades like Unity require a lot of discipline because you have to be willing to say “I’m wrong” and get out when the tides turn.
The setup in this one is not simple, but it’s there. Retesting the prior high from a year ago, bulls are looking for this one to bounce soon. But it will depend on what growth stocks as a whole are doing.
A break of yesterday’s low at $174.39 that’s reclaimed can give us a potential long trigger depending on how far down the low is (which becomes our stop). A break of the low that’s not reclaimed could put the 21-day moving average in play.
Conversely, a higher or flat open that goes 4H up over $176.52 could put the $185 to $188 area back in play.
Go-To Watch List
ZS — watching for a 21-day tag and/or reversal up through Monday’s low. (Daily)
SNOW — watching for a 10-week tag and/or reversal through Monday’s low. (Weekly)
JCI — watching for a tag of the 8/10-day moving averages (Daily)
DDOG — watching for gap-fill & 10-week tag.

Disclaimer: Charts and analyses are for discussion and education purposes only. I am not a financial advisor, do not give financial advice and am not recommending the buying or selling of any security.
Remember: Not all setups will trigger. Not all setups will be profitable. Not all setups should be taken. These are simply the setups that I have put together for years on my own and what I watch as part of my own “game plan” coming into each day. Good luck!
Economic Outlook

Comments are closed