Our View
I want to remind everyone about something. It doesn’t matter if you are trading index futures or corn futures — you are entitled to change your opinion at your choosing. Meaning if the S&P is firm and going up and then something major happens, there are no rules about changing your mind and becoming bearish.
If you are a short-term trader, your opinion could change several times in an hour or even minutes and if you are holding for the longer-term timeframes, you more than likely have an exit strategy.
I never understood why people were so critical of others for “changing their mind” — as if doing so was a negative. On the trading floor, we called that being flexible and if you wanted to survive, you had to be flexible.
On September 10th, MrTopStep is going to show you several different trading styles during our long-awaited webinar. We don’t push people to buy products or sign up for our chat room. In fact, “retail investors” are not buying, and as a very good friend on Twitter said, retail is in a deep depression.
A long time ago, a competitor said that we should spend a bunch of money on marketing. Maybe we should have, but MrTopStep is not Mr. TikTok.
MrTopStep does not consist of just one good trader, but several who are part of our trading collective, and sharing is at the center of what we do — not marketing or advertising. If you are looking for a trading tune-up or you’re a seasoned trader that just wants to see what the ‘other’ traders are doing, we are the place to go.
In the next few days, we will be putting up the link to join the webinar. As the famous bond futures trader Charlie D always said, “It’s up to the traders that know how to trade to share their knowledge with the next young trader” and MrTopStep has been doing that for the public since the day we opened the company some-15 years ago.
Our View
When the markets go up, everyone gets bullish and when they go back down everyone gets bearish. But two big names continue to forecast their bearish forecast: Jeremy Granthman and Jamie Dimon.
Granthman sounded the alarm that there would be a multi-asset bubble in the US and predicted a brutal decline in stocks, and said he would celebrate bitcoin’s demise. Dimon — CEO of JPMorgan — said there are “storm clouds” on the horizon.
It’s a strong economy and consumers’ balance sheets are in good shape. Businesses are equally in good shape. When you forecast, you have to think differently. What is out there? There are storm clouds. Higher rates, QT, high oil, Russia/Ukraine war, China/Taiwan threats, etc.
If I had to put odds: soft landing 10%. Harder landing, mild recession, 20%, 30%. Harder recession, 20%, 30%. And maybe something worse at 20% to 30%. It’s a bad mistake to say “here is my single-point forecast.” — remember, we need to be flexible; adapt.
MrTopStep’s trading plan for 2022 was that the S&P would fall over 15%, see a summer rally and then look for a selloff into late-Q3/October, then a big year-end rally. The ES has already rallied 19% and the question is will the ES retrace a little and then rally again or will there actually be new lows first?
Our Lean
After the 4:00 cash close on Friday, the NQ continued to downtick into the 5:00 futures close. The selling has trickled into this morning, with the S&P down about 1% as of 8:00 ET.
I think we may see an initial early rally, then another selloff.
We are already trading below a few of my key levels, but other marks I am watching include 4188, 4166 to 4170, 4144, and 4120 to 4123.
On the upside, the key levels I have on my screens are 4246, 4253, and 4262 to 4265.
Daily Recap

The ES opened Friday’s regular session at 4259, traded up to the regular-session high of 4261.75, and dropped 36 points down to 4235 at 9:56.
From there, the ES rallied back up to ~4245, up about 20 points, then bled down to 4220.75, the regular session low at 3:10. That marked a 25-point dip from late-morning rally and set a bearish tone into the close.
The ES traded 4227.50 at 3:43 and the early MIM showed $250 million to sell. The ES traded 4230 on the 4:00 cash close and settled at 4228.50, down 58 points or -1.35% on the day.
In the end, despite the weakness in the ES, the NQ was the weak link. In terms of the ES’s overall tone, it was weak but held together better than the NQ. In terms of the ES’s overall trade, volume was average at 1.6 million contracts traded, but low for the type of selloff.
- Daily Range: 67.25 points
- H: 4288
- L: 4220.75
Technical Edge
- NYSE Breadth: 84% Downside Volume (!)
- NASDAQ Breadth: 82% Downside Volume (!)v
- VIX: ~$23
Game Plan: S&P, Nasdaq, TLT
Last week, we mentioned if there would be a “change in tune” — and we would know if we had our ⅓ and ½ running long positions in the winners get stopped out.
The S&P is not finding its footing at active support, so we’ll need to see if this is just a shakeout or something more.
S&P 500 — ES

The ES is pulling back into the 4170s as we speak. This is a big area to me. The S&P is not holding active support via the 10-day moving average, a measure it has held for the past month.
The 4170s area was resistance until the Aug. 10 breakout. Let’s see if this area — along with the weekly VWAP and rising 21-day moving average — is enough for an opening morning bounce.
If so, my upside targets are 4200, then ~4220 (which is the underside of the 10-day and Friday’s low). Reclaiming this area is bullish. Not doing so leaves the S&P suspect in my book.
S&P 500 — SPY

On Friday, our plan was to cover our short hedges into the 10-day and look for bounce. If no bounce materialized “$416 to $417 could be in play next week.”
Well, here we are in “next week” as the SPY is nearly trading this level in the pre-market. So let’s see how it handles the $416 to $417 zone, which was solid resistance in May/June and again in July.
If it’s support, then the bulls can maintain an edge.
Like the ES, an ideal bounce would send the SPY to $421 to $422, but we may not get that far. I like the QQQ more for a potential bounce (more on that in a second).
On a weekly basis, keep in mind we had climbed in four straight weeks prior to last week.
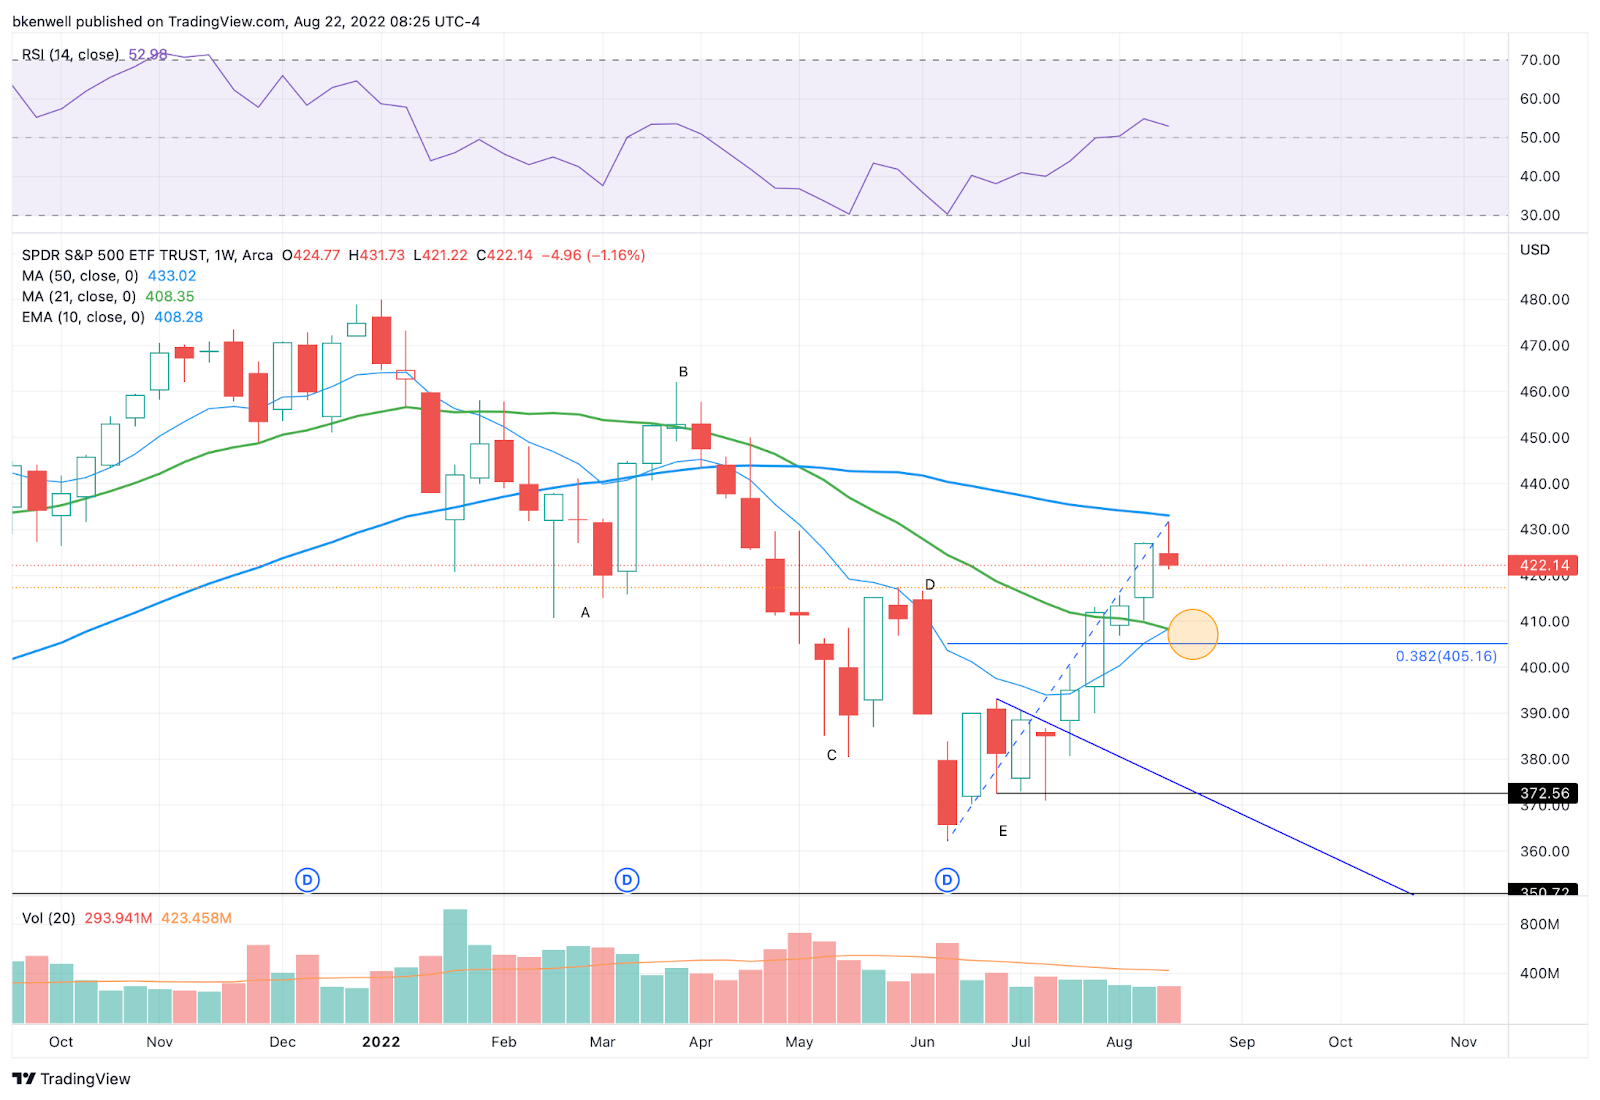
It’s not out of the realm of possibilities that we see a dip down to the $405 to $408 area. There we have the 10-week and 21-week moving averages, as well as the 38.2% retracement.
Keep that in the back of your mind going through the final ⅓ of August.
Nasdaq — QQQ
The QQQ has a good bounce setup coming into Monday morning: It’s set to open near the gap-fill level of $319 and the 21-day moving average.
If it doesn’t bounce from here, bulls will need to change gears quickly. But this seems like an obvious cash-flow bounce trade this morning.
TLT

I know I have not shut up about the bonds over the last few weeks, but they have been breaking down while stocks have been “climbing a wall of worry.”
This was a warning sign to me and investors need to see the bonds stabilize, IMO. No trade here, just an observation. $114.25 to $114.50 is an area it needs to reclaim.
Go-To Watchlist — Individual Stocks
*Feel free to build your own trades off these relative strength leaders*
- Numbered are the ones I’m watching most closely.
- Bold are the trades with recent updates.
- Italics show means the trade is closed.
Trade Sheets: We may “feel” a turning point in the portfolio if we get stopped on a bunch of our “stress free” trades — those with B/E or better stops. Let’s see how the market reacts to this opening dip.
We have ½ UUP, ⅓ CHNG, ½ APLS and ⅔ AR.
- UUP — Down to roughly ½ position in UUP against $27.95 stop-loss for aggressive traders, B/E for conservative traders.
- CHNG — second target of $25 hit. Now down to just ⅓ position. Take all profit here or move to a B/E stop and look for $25.50.
- BMRN — long from $94.14 (last week’s low). $96.50 to $97 is the first target. $100 is the second target. Initial stop-loss at $92.50
- APLS — HALF position at $65.
- AR — long from $40.60, price target hit $42. Next target is $44 to $44.50. Stops at B/E or $39.50 for more aggressive traders.
Relative strength leaders (List is cleaned up and shorter!) →
- CNC
- F
- HRB
- BMRN
- APLS
- ENPH
- TAN
- FSLR
- LNG
- PWR
- CHNG
- CELH
- COST
- PEP
- UNH
- XLU
- MCK — monster
Economic Calendar
None — But watch the Fed’s Jackson Hole event later this week!
Comments are closed